Cited by 66Metabolomics and Mass Spectrometry StudiesTraditional Chinese Medicine AnalysisNatural Products and Biological Research

The DOI matches its Crossref record; the references it cites are not checked yet.

Metabonomics Study of the Therapeutic Mechanism of Gynostemma pentaphyllum and Atorvastatin for Hyperlipidemia in Rats

Open access

Abstract

Gynostemma pentaphyllum (GP) is widely used for the treatment of diseases such as hyperlipidemia, fatty liver and obesity in China, and atorvastatin is broadly used as an anti-hyperlipidemia drug. This research focuses on the plasma and liver metabolites in the following four groups of rats: control, a hyperlipidemia model, a hyperlipidemia model treated with GP and a hyperlipidemia model treated with atorvastatin. Using (1)H-NMR-based metabonomics, we elucidated the therapeutic mechanisms of GP and atorvastatin. Orthogonal Partial Least Squares-Discriminant analysis (OPLS-DA) plotting of the metabolic state and analysis of potential biomarkers in the plasma and liver correlated well with the results of biochemical assays. GP can effectively affect lipid metabolism, and it exerts its anti-hyperlipidemia effect by elevating the level of phosphatidylcholine and decreasing the level of trimethylamine N-oxide (TMAO). In contrast, atorvastatin affects hyperlipidemia mainly during lipid metabolism and protein metabolism in vivo.

Overview

The claims and statistics of this paper haven’t been checked yet.

Run the check — free, no account needed. It reads the open-access text and checks the sources it cites.

A few free checks a day · papers already verified open instantly · results are public

Integrity signals

Registry

Crossref · 10.1371/journal.pone.0078731

Cites

Statistics

Figures

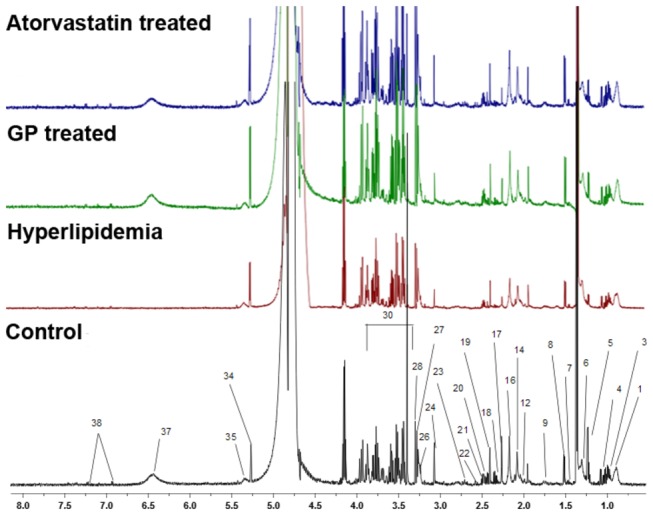
Figure 1 Typical 600 MHz 1H-NMR spectra of rat plasma samples. 1.Lipids (VLDL/LDL) 3. Isoleucine 4. Valine 5.3-Hydroxybutyrate 6. Lactate 7. Alanine 8. Lysine 9. Arginine 12. N-Acetyl glycoproteins 14. Glutamate 16. Acetoacetate 17. Acetone 18. Succinate 19. Pyruvate 20. Glutamine 21. Citrate 22. Glutathione 23. Aspartate 24. Creatine 26. Choline 27. Phosphocholine/GPC 28. TMAO 30. Glucose/aminoacids resonances 34.α-Glucose 35. Glycogen 37. Fumarate 38. Tyrosine.
Figure 1 Typical 600 MHz 1H-NMR spectra of rat plasma samples. 1.Lipids (VLDL/LDL) 3. Isoleucine 4. Valine 5.3-Hydroxybutyrate 6. Lactate 7. Alanine 8. Lysine 9. Arginine 12. N-Acetyl glycoproteins 14. Glutamate 16. Acetoacetate 17. Acetone 18. Succinate 19. Pyruvate 20. Glutamine 21. Citrate 22. Glutathione 23. Aspartate 24. Creatine 26. Choline 27. Phosphocholine/GPC 28. TMAO 30. Glucose/aminoacids resonances 34.α-Glucose 35. Glycogen 37. Fumarate 38. Tyrosine.CC BY · PubMed Central
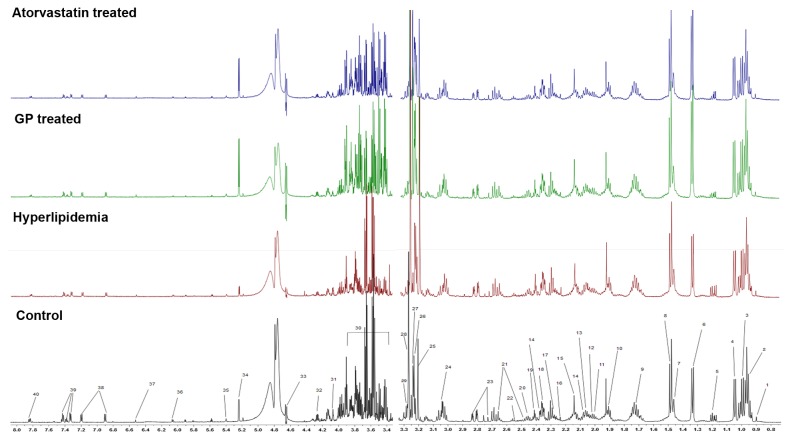
Figure 2 Typical 600 MHz 1H-NMR spectra of rat liver samples. 1. Lipids (VLDL/LDL) 2. Leucine 3. Isoleucine 4. Valine 5.3-Hydroxybutyrate 6. Lactate 7. Alanine 8. Lysine 9. Arginine 10. Acetate 11. Proline 12. N-Acetyl glycoproteins 13. O-Acetyl glycoproteins 14. Glutamate 15. Methionine 16. Acetoacetate 17. Acetone 18. Succinate 19. Pyruvate 20. Glutamine 21. Citrate 22. Glutathione 23. Aspartate 24. Creatine 25. Phosphatidylcholine 26. Choline 27. Phosphocholine/GPC 28. TMAO 29. Taurine 30. Glucose/aminoacids resonances 31.myo–Inositol 32. Threonine 33. β-Glucose 34.α-Glucose 35. Glycogen 36. Adenosine/Inosine 37. Fumarate 38. Tyrosine 39. Phenylalanine 40. Histidine.
Figure 2 Typical 600 MHz 1H-NMR spectra of rat liver samples. 1. Lipids (VLDL/LDL) 2. Leucine 3. Isoleucine 4. Valine 5.3-Hydroxybutyrate 6. Lactate 7. Alanine 8. Lysine 9. Arginine 10. Acetate 11. Proline 12. N-Acetyl glycoproteins 13. O-Acetyl glycoproteins 14. Glutamate 15. Methionine 16. Acetoacetate 17. Acetone 18. Succinate 19. Pyruvate 20. Glutamine 21. Citrate 22. Glutathione 23. Aspartate 24. Creatine 25. Phosphatidylcholine 26. Choline 27. Phosphocholine/GPC 28. TMAO 29. Taurine 30. Glucose/aminoacids resonances 31.myo–Inositol 32. Threonine 33. β-Glucose 34.α-Glucose 35. Glycogen 36. Adenosine/Inosine 37. Fumarate 38. Tyrosine 39. Phenylalanine 40. Histidine.CC BY · PubMed Central
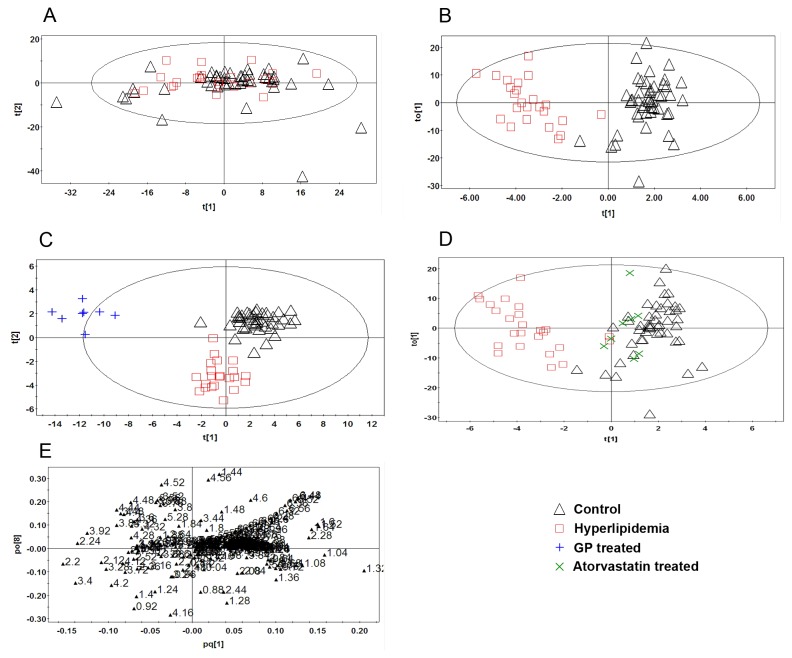
Figure 3 PR analysis of the 1H-NMR spectra of rat plasma. (A): PCA analysis of the spectra of plasma from normal and hyperlipidemia rats (R2X=0.988, Q2=0.885). (B): Scores plot of the OPLS-DA analysis of the spectra from the plasma of normal and hyperlipidemia rats (R2X=0.925, R2Y=0.874, Q2=0.642). (C): Scores plot of the OPLS-DA analysis of the spectra from the plasma of normal, hyperlipidemia and GP-treated rats (R2X=0.968, R2Y=0.878, Q2=0.538). (D): Scores plot of the OPLS-DA analysis of the spectra from the plasma of normal, hyperlipidemia and Atorvastatin-treated rats (R2X=0.909, R2Y=0.522, Q2=0.328). (E): Loading plot of the OPLS-DA analysis of the spectra from the plasma of normal and hyperlipidemia rats.
Figure 3 PR analysis of the 1H-NMR spectra of rat plasma. (A): PCA analysis of the spectra of plasma from normal and hyperlipidemia rats (R2X=0.988, Q2=0.885). (B): Scores plot of the OPLS-DA analysis of the spectra from the plasma of normal and hyperlipidemia rats (R2X=0.925, R2Y=0.874, Q2=0.642). (C): Scores plot of the OPLS-DA analysis of the spectra from the plasma of normal, hyperlipidemia and GP-treated rats (R2X=0.968, R2Y=0.878, Q2=0.538). (D): Scores plot of the OPLS-DA analysis of the spectra from the plasma of normal, hyperlipidemia and Atorvastatin-treated rats (R2X=0.909, R2Y=0.522, Q2=0.328). (E): Loading plot of the OPLS-DA analysis of the spectra from the plasma of normal and hyperlipidemia rats.CC BY · PubMed Central
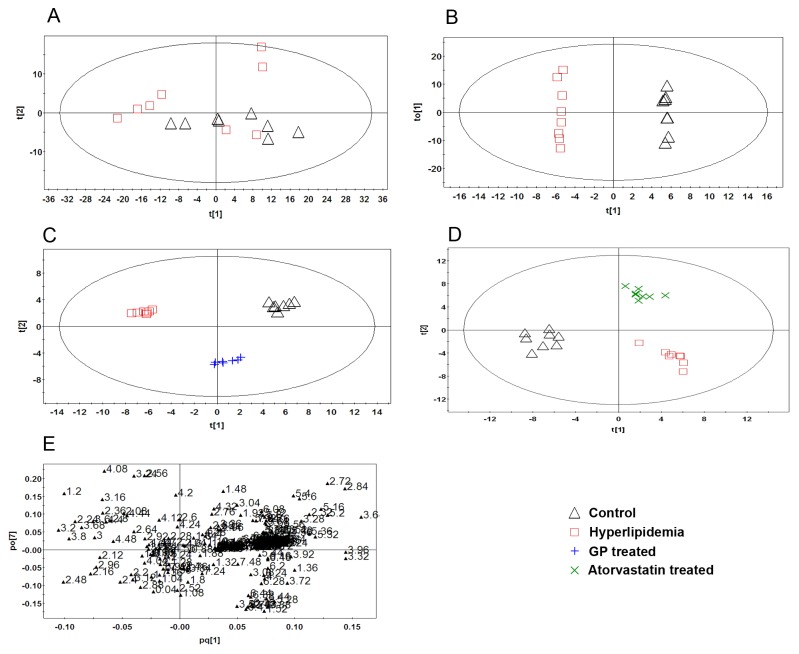
Figure 4 PR analysis of 1H-NMR spectra of rat liver tissues. (A): PCA analysis of the spectra of liver tissues from normal and hyperlipidemia rats (R2X=0.955, Q2=0.782). (B): Scores plot of the OPLS-DA analysis of the spectra from the liver tissues of normal and hyperlipidemia rats (R2X=0.953, R2Y=0.999, Q2=0.827). (C): Scores plot of the OPLS-DA analysis of the spectra from the liver tissues of normal, hyperlipidemia and GP-treated rats (R2X=0.955, R2Y=0.984, Q2=0.608). (D): Scores plot of the OPLS-DA analysis of the spectra from the liver tissues of normal, hyperlipidemia and Atorvastatin-treated rats (R2X=0.931, R2Y=0.945, Q2=0.544). (E): Loading plot of the OPLS-DA analysis of the spectra from the liver tissues of normal and hyperlipidemia rats.
Figure 4 PR analysis of 1H-NMR spectra of rat liver tissues. (A): PCA analysis of the spectra of liver tissues from normal and hyperlipidemia rats (R2X=0.955, Q2=0.782). (B): Scores plot of the OPLS-DA analysis of the spectra from the liver tissues of normal and hyperlipidemia rats (R2X=0.953, R2Y=0.999, Q2=0.827). (C): Scores plot of the OPLS-DA analysis of the spectra from the liver tissues of normal, hyperlipidemia and GP-treated rats (R2X=0.955, R2Y=0.984, Q2=0.608). (D): Scores plot of the OPLS-DA analysis of the spectra from the liver tissues of normal, hyperlipidemia and Atorvastatin-treated rats (R2X=0.931, R2Y=0.945, Q2=0.544). (E): Loading plot of the OPLS-DA analysis of the spectra from the liver tissues of normal and hyperlipidemia rats.CC BY · PubMed Central
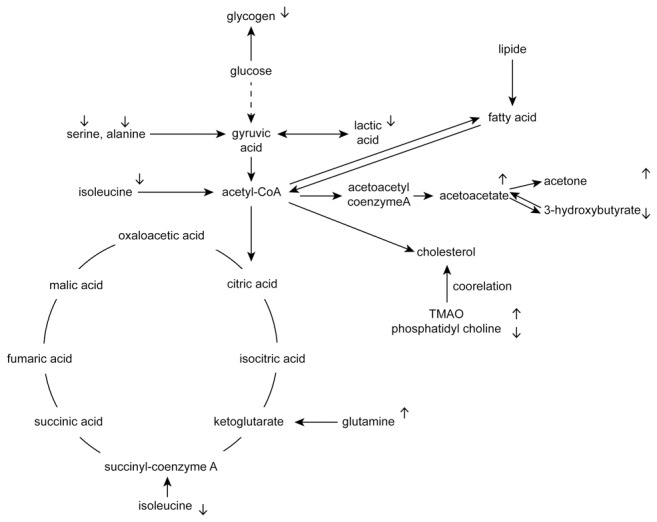
Figure 5 Summary of the metabolic pathways related to the metabolites that changed significantly in the hyperlipidemia model. “↑” and “↓” indicate that the compound is up- and down-regulated compared with the control group.
Figure 5 Summary of the metabolic pathways related to the metabolites that changed significantly in the hyperlipidemia model. “↑” and “↓” indicate that the compound is up- and down-regulated compared with the control group.CC BY · PubMed Central

Verification

Claims the paper makes

The claims and statistics of this paper haven’t been checked yet.

Run the check — free, no account needed. It reads the open-access text and checks the sources it cites.

A few free checks a day · papers already verified open instantly · results are public

Claims other papers make about this one

Each is checked against this paper’s own text: does it say what the citing paper says it does?

Self-check

Percentages, sums and reported differences re-computed from the paper’s own numbers.

The self-check needs the paper’s full text.

Citations

The citation lists haven’t been fetched yet

References 39 · Cited by 66

Metadata

Authors
Wang, M., Wang, F., Wang, Y., Ma, X., Zhao, M., & Zhao, C.
Affiliations
  • Shenyang Pharmaceutical University (CN)
  • Northeastern University (CN)
Corresponding author
Zhao, Chunjie
Venue
PLoS ONE
Published
2013-11-01
Volume
8
Issue
11
Pages
e78731
ISSN
1932-6203 (ISSN-L)
OpenAlex
W2004490753
Cited by
66
References
39
Citations by year
2026: 1 · 2025: 4 · 2024: 5 · 2023: 7 · 2022: 9 · 2021: 5 · 2020: 5 · 2019: 10 · 2018: 6 · 2017: 2 · 2016: 6 · 2015: 3 · 2014: 3
FWCI
1.79
Type
journal article
Language
en
Open access
Locations
  • PLoS ONE (publishedVersion, cc-by)
  • Europe PMC (PubMed Central) (publishedVersion, cc-by)
  • PubMed Central (publishedVersion, cc-by)
  • PubMed (publishedVersion)
  • DOAJ (DOAJ: Directory of Open Access Journals) (submittedVersion, cc-by-sa)
  • Figshare (submittedVersion, cc-by)
Funders
Shenyang Pharmaceutical University
Topics
  • Life Sciences › Biochemistry, Genetics and Molecular Biology › Molecular Biology › Metabolomics and Mass Spectrometry Studies
  • Health Sciences › Medicine › Complementary and alternative medicine › Traditional Chinese Medicine Analysis
  • Life Sciences › Pharmacology, Toxicology and Pharmaceutics › Pharmacology › Natural Products and Biological Research
Keywords
Gynostemma pentaphyllum, atorvastatin, hyperlipidemia, lipid metabolism, plasma metabolites, liver metabolites, phosphatidylcholine, trimethylamine N-oxide, biomarkers, therapeutic mechanisms, herbal medicine, statins
MeSH terms
Atorvastatin, Animals, Anticholesteremic Agents, Cholesterol, Heptanoic Acids, Hyperlipidemias, Cholesterol, HDL, Cholesterol, LDL, Liver, Male, Phytotherapy, Methylamines, Magnetic Resonance Spectroscopy, Phosphatidylcholines, Plant Extracts, Pyrroles, Triglycerides, Treatment Outcome, Rats, Sprague-Dawley, Gynostemma, Lipid Metabolism, Rats, Metabolomics

About these checks

Registry, retraction, Cites and statistics results are computed, not judged, with one exception: a printed reference that no index lists is read once by a model before it counts as a citation error. Claims are extracted by a model and kept only when their quote appears verbatim in the text; each cited source is then checked, with a model’s help, for whether it says what the claim relies on. Those verdicts can be wrong — read the claim’s quote and the cited source before relying on one.

Statistics and arithmetic are recomputed, not judged.

Confidence bands are shown only for fields calibrated on our annotated test set. None is calibrated yet, so no band is shown.

What counts as a claim ›How we measure confidence ›How we check this ›

Are you an author, or do you see a problem with this page? Request a review

How to cite

Cite CoChat for the checks on this page, and the paper for its own findings.

This page
CoChat. (2026). Citation check: Metabonomics Study of the Therapeutic Mechanism of Gynostemma pentaphyllum and Atorvastatin for Hyperlipidemia in Rats. https://app.cochat.ai/papers/10.1371/journal.pone.0078731
The paper
Wang, M., Wang, F., Wang, Y., Ma, X., Zhao, M., & Zhao, C. (2013). Metabonomics Study of the Therapeutic Mechanism of Gynostemma pentaphyllum and Atorvastatin for Hyperlipidemia in Rats. PLoS ONE. https://doi.org/10.1371/journal.pone.0078731