

The DOI matches its Crossref record; 37 of the 37 references it cites were found in a registry or an index.
Enhancement of CYP3A4 Activity in Hep G2 Cells by Lentiviral Transfection of Hepatocyte Nuclear Factor-1 Alpha
Open accessAbstract
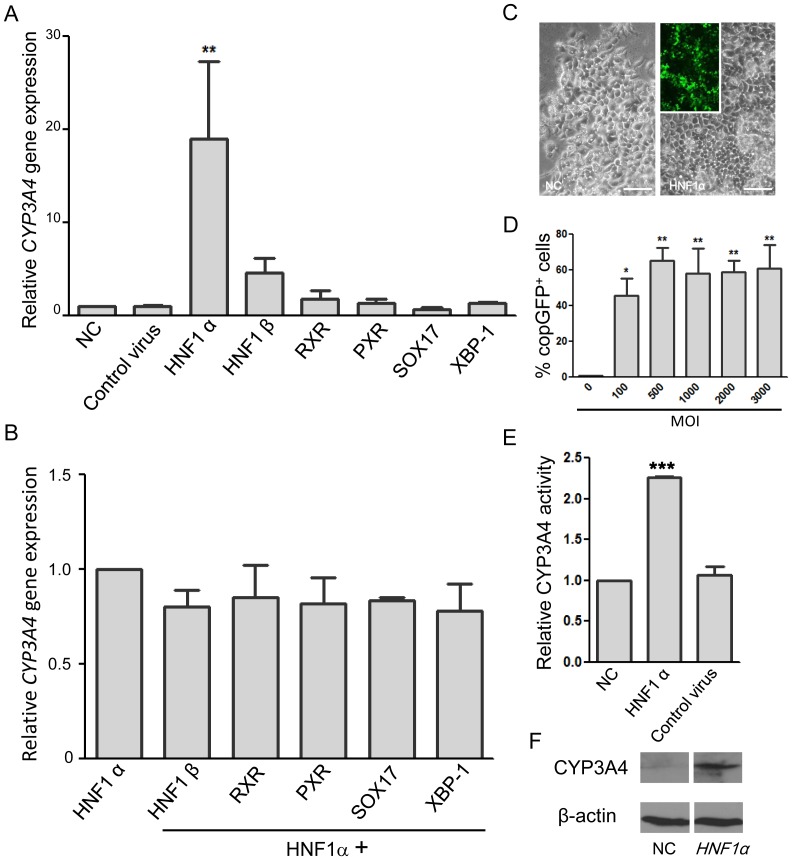
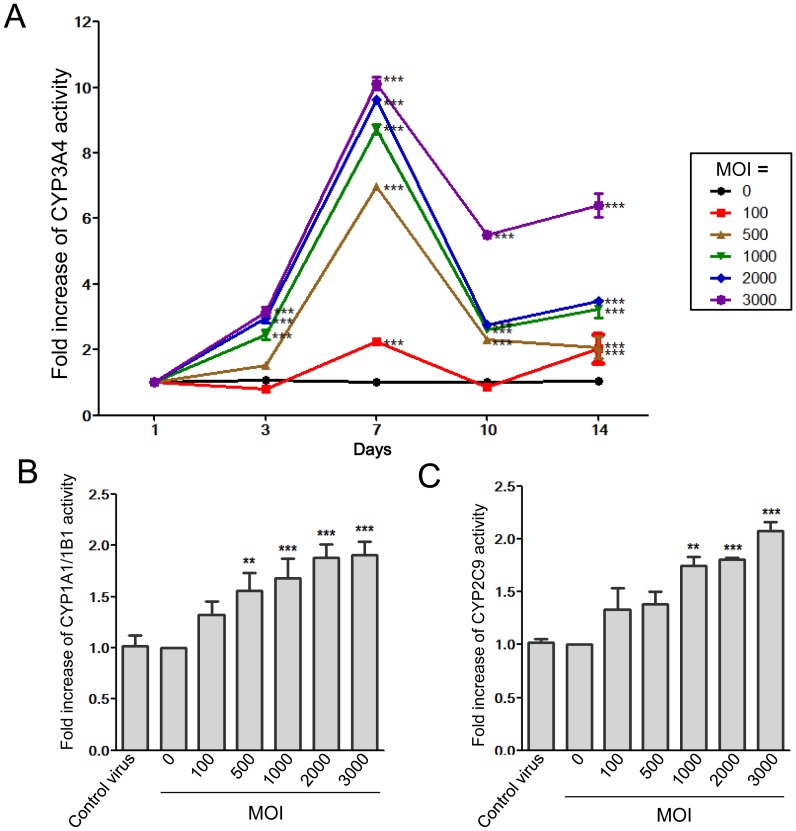
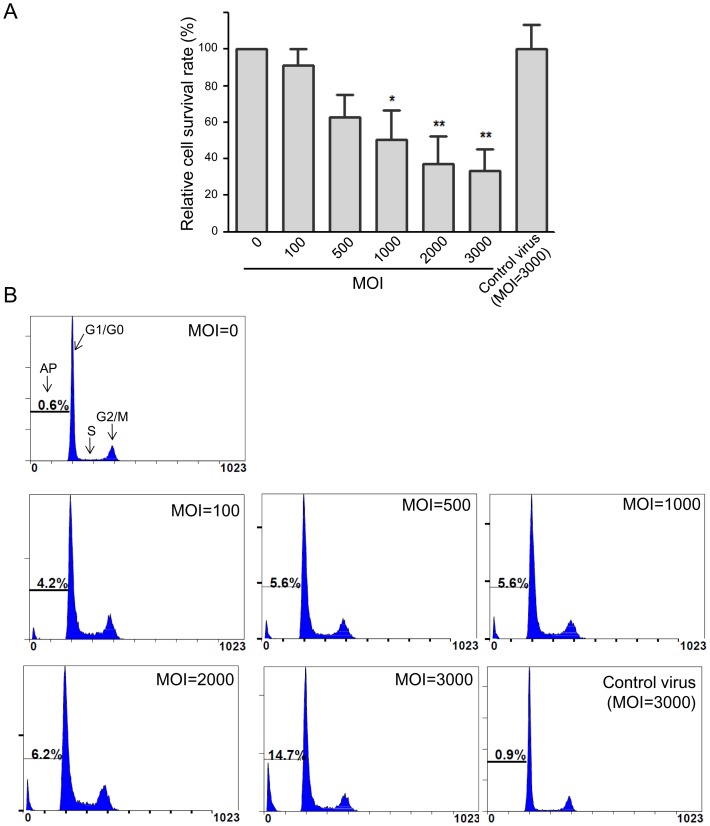
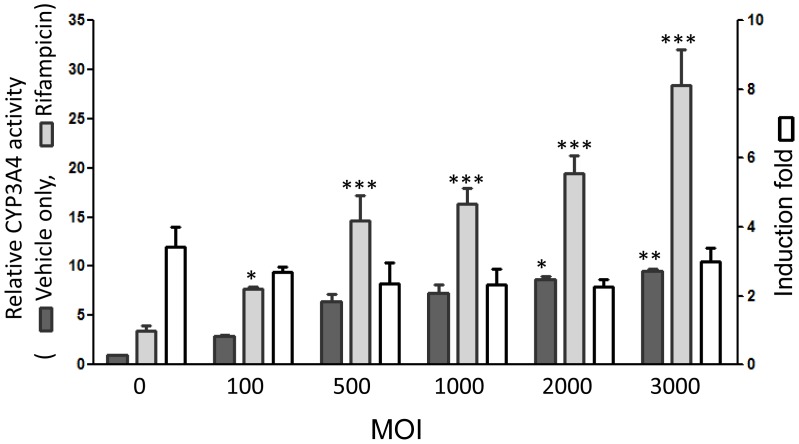
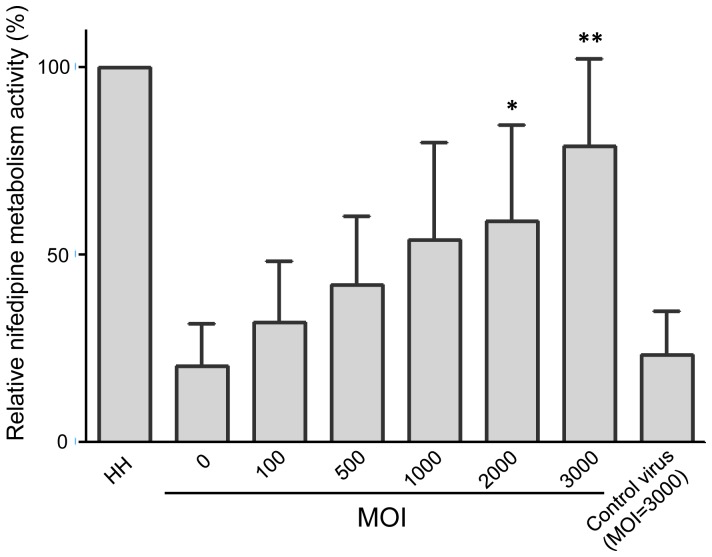
Human hepatoma cell lines are commonly used as alternatives to primary hepatocytes for the study of drug metabolism in vitro. However, the phase I cytochrome P450 (CYP) enzyme activities in these cell lines occur at a much lower level than their corresponding activities in primary hepatocytes, and thus these cell lines may not accurately predict drug metabolism. In the present study, we selected hepatocyte nuclear factor-1 alpha (HNF1α) from six transcriptional regulators for lentiviral transfection into Hep G2 cells to optimally increase their expression of the CYP3A4 enzyme, which is the major CYP enzyme in the human body. We subsequently found that HNF1α-transfected Hep G2 enhanced the CYP3A4 expression in a time- and dose-dependent manner and the activity was noted to increase with time and peaked 7 days. With a multiplicity of infection (MOI) of 100, CYP3A4 expression increased 19-fold and enzyme activity more than doubled at day 7. With higher MOI (1,000 to 3,000), the activity increased 8- to 10-fold; however, it was noted the higher MOI, the higher cell death rate and lower cell survival. Furthermore, the CYP3A4 activity in the HNF1α-transfected cells could be induced by CYP3A4-specific inducer, rifampicin, and metabolized nifedipine in a dose-dependent manner. With an MOI of 3,000, nifedipine-metabolizing activity was 6-fold of control and as high as 66% of primary hepatocytes. In conclusion, forceful delivery of selected transcriptional regulators into human hepatoma cells might be a valuable method to enhance the CYP activity for a more accurate determination of drug metabolism in vitro.
Overview
The claims and statistics of this paper haven’t been checked yet.
Run the check — free, no account needed. It reads the open-access text and checks the sources it cites.
Integrity signals
Registry
Cites
Statistics
Figures
Verification
Claims the paper makes
The claims and statistics of this paper haven’t been checked yet.
Run the check — free, no account needed. It reads the open-access text and checks the sources it cites.
Claims other papers make about this one
Each is checked against this paper’s own text: does it say what the citing paper says it does?
The cited source says what the claim attributes to it.
In the citing paper
“For example, lentiviral expression of HNF1α in HepG2 cells increased CYP3A4 activity, preserved the system’s sensitivity to rifampicin induction, and, under optimal transduction conditions, brought activity close to that of primary hepatocytes; however, at high multiplicity of infection (MOI), it was accompanied by increased cell death [165].”
From The HepG2 Cell Line as a Model for Studying Metabolic Dysfunction-Associated Steatotic Liver Disease (2026) · cites this paper as [165]
Self-check
Percentages, sums and reported differences re-computed from the paper’s own numbers.
The self-check needs the paper’s full text.
Citations
Cites
Cytochrome P450 and Chemical Toxicology
Guengerich, F. P. (2007) · Chemical Research in Toxicology · doi:10.1021/tx700079z · Cited by 1,789
Control of Pancreas and Liver Gene Expression by HNF Transcription Factors
Odom, D. T., Zizlsperger, N., Gordon, D. B., Bell, G. W., Rinaldi, N. J., Murray, H. L., Volkert, T. L., Schreiber, J., Rolfe, A., Gifford, D. K., et al. (2004) · Science · doi:10.1126/science.1089769 · Cited by 1,348
Induction of phase I, II and III drug metabolism/transport by xenobiotics
Xu, C., Li, C. Y.-T., & Kong, A. T. (2005) · Archives of Pharmacal Research · doi:10.1007/bf02977789 · Cited by 1,310
St. John's wort induces hepatic drug metabolism through activation of the pregnane X receptor
Moore, L. B., Goodwin, B. J., Jones, S. A., Wisely, G. B., Serabjit‐Singh, C. J., Willson, T. M., Collins, J. L., & Kliewer, S. A. (2000) · Proceedings of the National Academy of Sciences · doi:10.1073/pnas.130155097 · Cited by 946
The Pregnane X Receptor: A Promiscuous Xenobiotic Receptor That Has Diverged during Evolution
Jones, S. A., Moore, L. B., Shenk, J. L., Wisely, G. B., Hamilton, G. A., McKee, D. D., Tomkinson, N. C. O., LeCluyse, E. L., Lambert, M. H., Willson, T. M., et al. (2000) · Molecular Endocrinology · doi:10.1210/mend.14.1.0409 · Cited by 672
An essential role in liver development for transcription factor XBP-1Preprint
Reimold, A. M., Etkin, A., CLAUSS, I. M., Perkins, A. C., Friend, D. S., Zhang, J. H., Horton, H. F., Scott, A., Orkin, S. H., Byrne, M. C., et al. (2000) · Genes & Development · doi:10.1101/gad.14.2.152 · Cited by 517
Regulation of cytochrome P450 (CYP) genes by nuclear receptors
Honkakoski, P., & Negishi, M. (2000) · Biochemical Journal · doi:10.1042/0264-6021:3470321 · Cited by 505
Cytochrome P450 2E1 Genotype and the Susceptibility to Antituberculosis Drug–Induced Hepatitis
Huang, Y., Chern, H., Su, W., Wu, J., Chang, S.-C., Chiang, C., Chang, F., & Lee, S. (2003) · Hepatology · doi:10.1053/jhep.2003.50144 · Cited by 428
Hart, S. N., Li, Y., Nakamoto, K., Subileau, E.-A., Steen, D., & Zhong, X.-B. (2010) · Drug Metabolism and Disposition · doi:10.1124/dmd.109.031831 · Cited by 298
Cell Lines: A Tool for In Vitro Drug Metabolism Studies
Gómez‐Lechón, M. J., Donato, M. T., Lahoz, A., & Castell, J. V. (2008) · Current Drug Metabolism · doi:10.2174/138920008783331086 · Cited by 297
Cited by
Sorted by citations
Moskot, M., Jakóbkiewicz‐Banecka, J., Kłoska, A., Piotrowska, E., Narajczyk, M., & Gabig‐Cimińska, M. (2019) · International Journal of Molecular Sciences · doi:10.3390/ijms20020304 · Cited by 66
Zhang, N., Hu, Y. W., Ding, C., Zeng, W., Shan, W., Fan, H. J., Zhao, Y., Shi, X., Gao, L., Xu, T., et al. (2016) · Toxicology Letters · doi:10.1016/j.toxlet.2016.12.010 · Cited by 64
Chen, L., Bao, Y., Piekos, S. C., Zhu, K., Zhang, L., & Zhong, X. (2018) · Molecular Pharmacology · doi:10.1124/mol.118.112235 · Cited by 56
Zhou, Y., Zhou, J., Sun, B., Xu, W. G., Zhong, M., Li, Y., He, C., Chen, Y., Wang, X., Jones, P. M., et al. (2020) · International Journal of Biological Sciences · doi:10.7150/ijbs.37861 · Cited by 35
Wang, Y., Liang, Y., Liu, J., Chen, S., Liu, G., Nie, Y., Wang, P., Yang, W.-H., Chen, L., Zhong, X., et al. (2019) · Journal of Pharmacology and Experimental Therapeutics · doi:10.1124/jpet.118.252940 · Cited by 33
Metadata
- Authors
- Chiang, T.-S., Yang, K.-C., Chiou, L.-L., Huang, G.-T., & Lee, H.-S.
- Affiliations
- National Taiwan University (TW)
- Taipei Medical University (TW)
- Corresponding author
- Huang, Guan-Tarn
- Venue
- PLoS ONE
- Publisher
- Public Library of Science (PLoS)
- Published
- 2014-04-14
- Volume
- 9
- Issue
- 4
- Pages
- e94885
- ISSN
- 1932-6203 (ISSN-L)
- PMC
- PMC3986372
- OpenAlex
- W2095442432
- Cited by
- 17
- References
- 37
- Citations by year
- 2026: 1 · 2025: 1 · 2024: 2 · 2022: 1 · 2021: 1 · 2020: 1 · 2019: 4 · 2018: 2 · 2016: 2 · 2015: 2
- FWCI
- 1.53
- Type
- journal article
- Language
- en
- Open access
- gold
- doi.org
- Locations
- PLoS ONE (publishedVersion, cc-by)
- Europe PMC (PubMed Central) (publishedVersion, cc-by)
- PubMed Central (publishedVersion, cc-by)
- PubMed (publishedVersion)
- DOAJ (DOAJ: Directory of Open Access Journals) (submittedVersion, cc-by-sa)
- Funders
- National Science Council
- National Taiwan University
- Topics
- Life Sciences › Pharmacology, Toxicology and Pharmaceutics › Pharmacology › Pharmacogenetics and Drug Metabolism
- Health Sciences › Medicine › Oncology › Drug Transport and Resistance Mechanisms
- Life Sciences › Pharmacology, Toxicology and Pharmaceutics › Pharmacology › Drug-Induced Hepatotoxicity and Protection
- Keywords
- CYP3A4, HNF1A, HepG2 cells, lentiviral transfection, cytochrome P450 induction, rifampicin, multiplicity of infection, HNF1B, transcription factors
- MeSH terms
- Cell Survival, Cytochrome P-450 Enzyme System, Humans, Nifedipine, Rifampin, Transduction, Genetic, Transfection, Lentivirus, Apoptosis, Hepatocyte Nuclear Factor 1-alpha, Cytochrome P-450 CYP3A, Hep G2 Cells, HEK293 Cells
About these checks
Registry, retraction, Cites and statistics results are computed, not judged, with one exception: a printed reference that no index lists is read once by a model before it counts as a citation error. Claims are extracted by a model and kept only when their quote appears verbatim in the text; each cited source is then checked, with a model’s help, for whether it says what the claim relies on. Those verdicts can be wrong — read the claim’s quote and the cited source before relying on one.
Statistics and arithmetic are recomputed, not judged.
Confidence bands are shown only for fields calibrated on our annotated test set. None is calibrated yet, so no band is shown.
What counts as a claim ›How we measure confidence ›How we check this ›
Are you an author, or do you see a problem with this page? Request a review
