

The DOI matches its Crossref record; 50 of the 50 references it cites were found in a registry or an index; none of the 44 sources its claims cite is checked for support yet.
Mitochondrial Dysfunction in Human Leukemic Stem/Progenitor Cells upon Loss of RAC2
Open accessAbstract
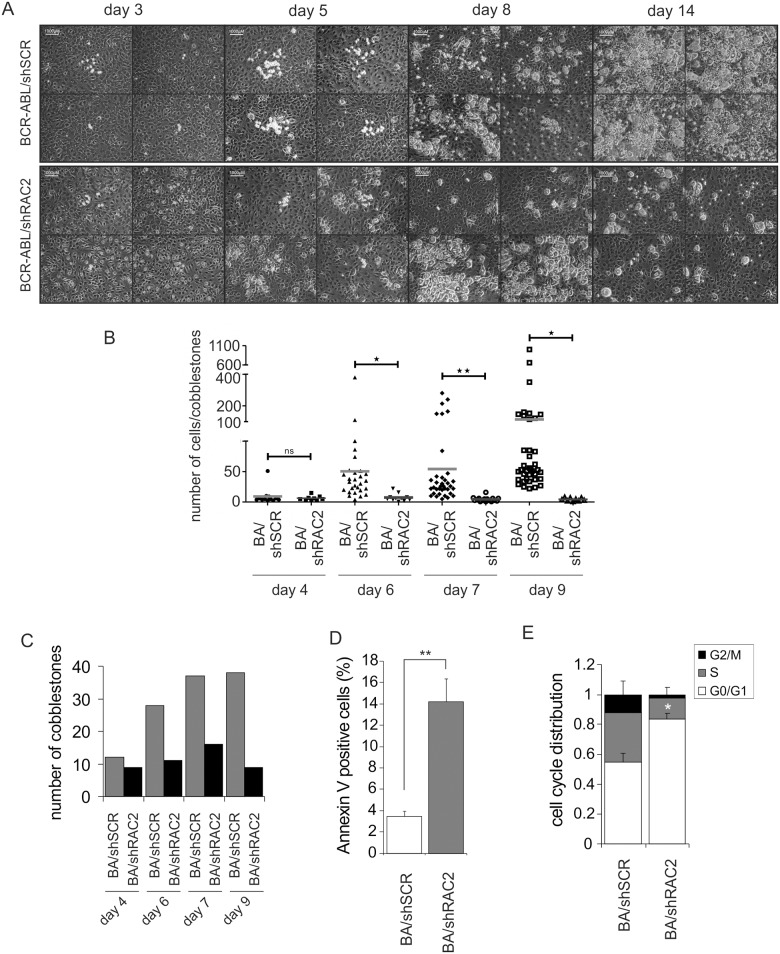
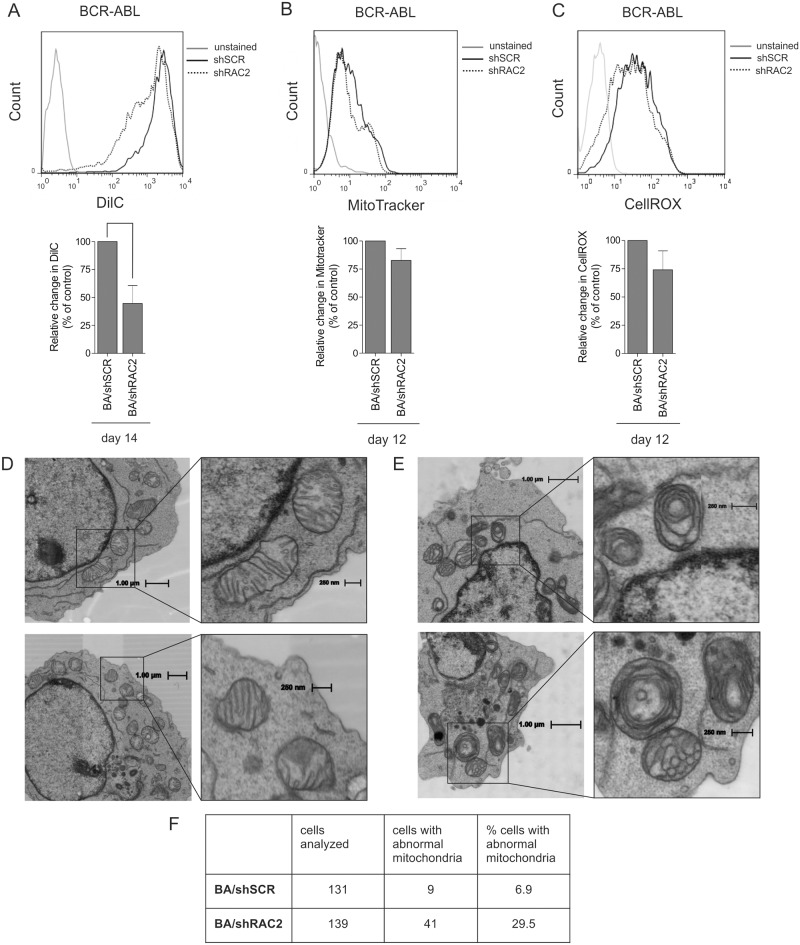
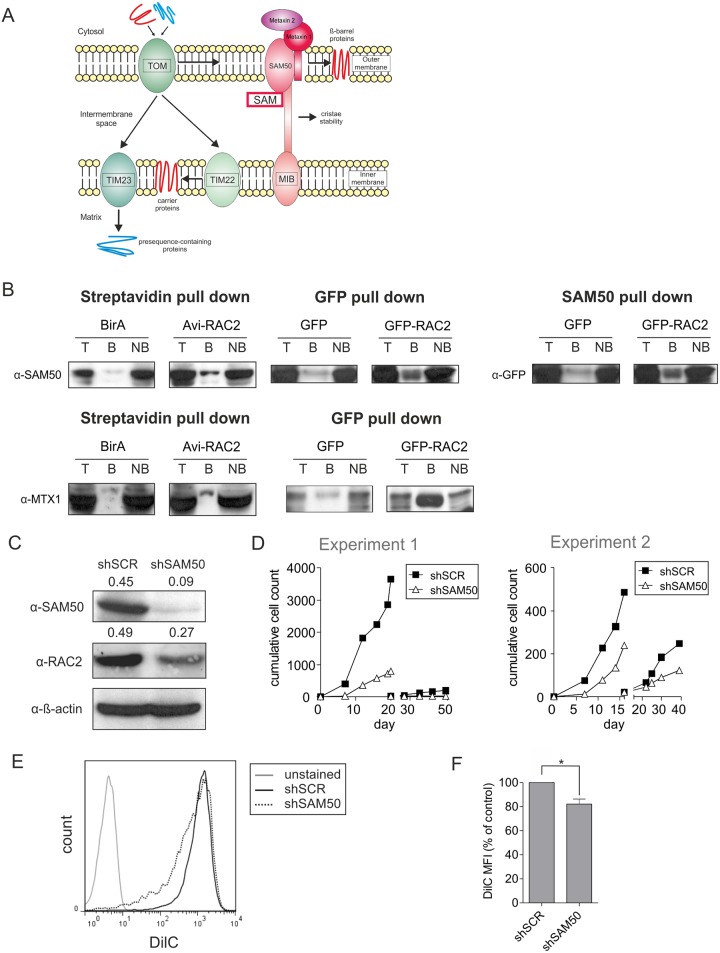
Leukemic stem cells (LSCs) reside within bone marrow niches that maintain their relatively quiescent state and convey resistance to conventional treatment. Many of the microenvironmental signals converge on RAC GTPases. Although it has become clear that RAC proteins fulfill important roles in the hematopoietic compartment, little has been revealed about the downstream effectors and molecular mechanisms. We observed that in BCR-ABL-transduced human hematopoietic stem/progenitor cells (HSPCs) depletion of RAC2 but not RAC1 induced a marked and immediate decrease in proliferation, progenitor frequency, cobblestone formation and replating capacity, indicative for reduced self-renewal. Cell cycle analyses showed reduced cell cycle activity in RAC2-depleted BCR-ABL leukemic cobblestones coinciding with an increased apoptosis. Moreover, a decrease in mitochondrial membrane potential was observed upon RAC2 downregulation, paralleled by severe mitochondrial ultrastructural malformations as determined by automated electron microscopy. Proteome analysis revealed that RAC2 specifically interacted with a set of mitochondrial proteins including mitochondrial transport proteins SAM50 and Metaxin 1, and interactions were confirmed in independent co-immunoprecipitation studies. Downregulation of SAM50 also impaired the proliferation and replating capacity of BCR-ABL-expressing cells, again associated with a decreased mitochondrial membrane potential. Taken together, these data suggest an important role for RAC2 in maintaining mitochondrial integrity.
Overview
CoChat Summary
Written by AI from the paper’s full text.
TL;DR
In BCR-ABL-transduced human hematopoietic stem/progenitor cells, RAC2 depletion—but not RAC1 depletion—impairs proliferation/self-renewal and causes mitochondrial dysfunction, including decreased membrane potential and abnormal cristae. RAC2 specifically interacts with mitochondrial transport proteins SAM50 and Metaxin 1, and SAM50 knockdown phenocopies key defects, suggesting RAC2 maintains mitochondrial integrity in leukemic stem/progenitor cells.
Key findings
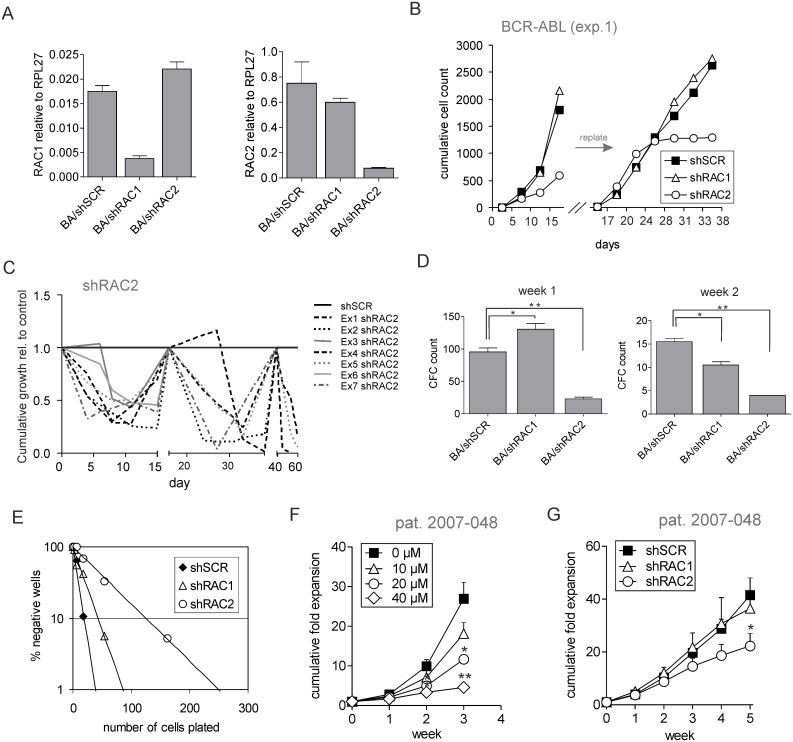
- RAC2 depletion in BCR-ABL CD34+ cord blood cells reduced proliferation, progenitor frequency, cobblestone formation, and replating capacity; LTC-IC frequency was 1:57 vs. 1:11 for control (p = 0.0001), while RAC1 depletion had little effect.
- RAC2-depleted BCR-ABL cells showed decreased mitochondrial membrane potential by DilC FACS, unchanged mitochondrial mass by MitoTracker Red, and reduced ROS that did not reach statistical significance; EM showed concentric cristae in almost one-third of RAC2-depleted cells vs. few control cells (131 control and 139 shRAC2 cells analyzed).
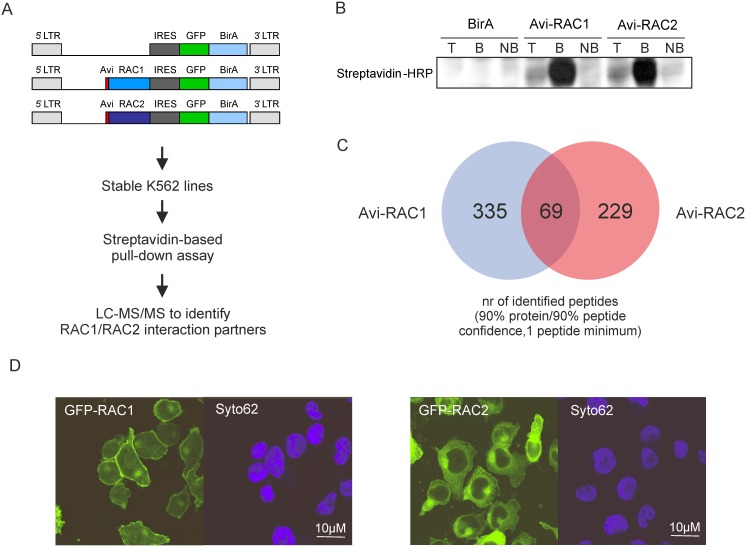
- Proteomics identified 335 RAC1-specific and 229 RAC2-specific peptides; RAC2 interacted with mitochondrial outer membrane/transport proteins including SAM50 and Metaxin 1, confirmed by co-immunoprecipitation, and SAM50 knockdown impaired proliferation/replating and reduced mitochondrial membrane potential.
- Primary BC CML CD34+ cells also showed a proliferative disadvantage upon RAC2 downregulation, with little effect from RAC1 depletion.
Methods
- shRNA knockdown of RAC1, RAC2, or SAM50 in BCR-ABL-transduced CD34+ cord blood HSPCs and primary BC CML CD34+ cells; MS5 stromal long-term co-cultures, CFC, LTC-IC limiting dilution, and replating assays.
- Flow cytometry for mitochondrial membrane potential (DilC1), mitochondrial mass (MitoTracker Red), ROS (CellROX), apoptosis (Annexin V), and cell cycle; automated electron microscopy/Nanotomy; qRT-PCR; Western blot.
- Proteomics used Avi-tagged RAC1/RAC2 with BirA in K562 cells, streptavidin pull-down, LC-MS/MS, GFP pull-down, and anti-SAM50 co-IP; DAVID GO annotation; Student’s t test with p < 0.05.
Limitations
- Stated: studies on a wider collection of leukemic samples are necessary; further studies are required to resolve whether SAM50 knockdown affects RAC2 stability; more experiments are needed to determine the exact molecular mechanisms.
- Evident: primary BC CML validation used a single patient (Methods says patient 2007–048; Fig 1 legend says 2007–043), and much mechanistic work used K562/TF-1 cell lines and in vitro stromal co-cultures rather than in vivo models.
- Evident: ROS reduction upon RAC2 downregulation did not reach statistical significance, and some co-IP controls showed background, although SAM50 and Metaxin 1 were enriched in RAC2 fractions.
Model-written summary. Check it against the paper before relying on it.
Integrity signals
Registry
Cites
Statistics
Figures
Verification
Claims the paper makes
55 Own result · 15 Own interpretation · 12 Check pending · 5 No full text of the sources · 4 Not checked yet · 4 Own method
A result the paper reports from its own data — it cites no other source for it, so there is none to check. The quote shows it is in the paper.
In the paper
“Treatment with RAC inhibitor resulted in a reduced expansion of BC CML cells in a dose-dependent manner.”
§ Mitochondrial Dysfunction in Human Leukemic Stem/Progenitor Cells upon Loss of RAC2 > Results > Human BCR-ABL transduced cells critically depend on RAC2 signaling
plainstates a causeSingle case- Asserted: passes — The authors put it forward as true.
- Checkable: passes — It can be checked against evidence.
- Load-bearing: passes — The paper’s conclusions depend on it.
- Based: passes — The paper gives a reason why it holds.
- Rests on an assumption not shown here.
A result the paper reports from its own data — it cites no other source for it, so there is none to check. The quote shows it is in the paper.
In the paper
“In both cases, SAM50 and Metaxin 1 were enriched in the RAC2 pull-down fraction above the control background levels.”
- Also stated in: § Discussion · boosted
“Although some background levels were detected in control precipitates, both SAM50 and Metaxin 1 were clearly enriched in the RAC2-bound fraction.”
§ Mitochondrial Dysfunction in Human Leukemic Stem/Progenitor Cells upon Loss of RAC2 > Results > The RAC2-interacting protein SAM50 is required for long-term expansion of human BCR-ABL-expressing HSPCs
boostedstates an association- Asserted: passes — The authors put it forward as true.
- Checkable: passes — It can be checked against evidence.
- Load-bearing: passes — The paper’s conclusions depend on it.
- Based: passes — The paper gives a reason why it holds.
- Also stated in: § Discussion · boosted
A result the paper reports from its own data — it cites no other source for it, so there is none to check. The quote shows it is in the paper.
In the paper
“Downregulation of SAM50 also impaired the proliferation and replating capacity of BCR-ABL-expressing cells”
§ Mitochondrial Dysfunction in Human Leukemic Stem/Progenitor Cells upon Loss of RAC2 > Abstract
plainstates a cause- Asserted: passes — The authors put it forward as true.
- Checkable: passes — It can be checked against evidence.
- Load-bearing: passes — The paper’s conclusions depend on it.
- Based: passes — The paper gives a reason why it holds.
A result the paper reports from its own data — it cites no other source for it, so there is none to check. The quote shows it is in the paper.
In the paper
“RAC2 specifically interacted with a set of mitochondrial proteins including SAM50 and Metaxin1, and downregulation of SAM50 also impaired the proliferation and replating capacity of BCR-ABL-expressing cells, again associated with a decreased mitochondrial membrane potential.”
§ Mitochondrial Dysfunction in Human Leukemic Stem/Progenitor Cells upon Loss of RAC2 > Discussion
plainstates an association- Asserted: passes — The authors put it forward as true.
- Checkable: passes — It can be checked against evidence.
- Load-bearing: passes — The paper’s conclusions depend on it.
- Based: passes — The paper gives a reason why it holds.
A result the paper reports from its own data — it cites no other source for it, so there is none to check. The quote shows it is in the paper.
In the paper
“Proteome analysis revealed that RAC2 specifically interacted with a set of mitochondrial proteins including mitochondrial transport proteins SAM50 and Metaxin 1”
§ Mitochondrial Dysfunction in Human Leukemic Stem/Progenitor Cells upon Loss of RAC2 > Abstract
plainstates an association- Asserted: passes — The authors put it forward as true.
- Checkable: passes — It can be checked against evidence.
- Load-bearing: passes — The paper’s conclusions depend on it.
- Based: passes — The paper gives a reason why it holds.
- It may state two separate claims as one. 34
- Probably not a substantial claim. 19
Create a free account to see these claims.
Create a free account to see these assumptions.
46 more claims
Create a free account to see all 95 claims and to verify the 24 references still open.
Self-check
Percentages, sums and reported differences re-computed from the paper’s own numbers.
Each contradiction between two passages listed here was confirmed by an independent check.
Rated minor: it would not touch a result — a value no result rests on, a p-value that stays on the same side of the significance level, or a conflict that is clerical, resolved elsewhere in the paper, or outside its own findings.
In the paper
§ Mitochondrial Dysfunction in Human Leukemic Stem/Progenitor Cells upon Loss of RAC2 > Materials and Methods > Long-term cultures on stroma, CFC and LTC-IC assay
“NSC2766 (NSC; Calbiochem, VWR, Amsterdam, The Netherlands)”
§ Mitochondrial Dysfunction in Human Leukemic Stem/Progenitor Cells upon Loss of RAC2 > Results > Human BCR-ABL transduced cells critically depend on RAC2 signaling
“the RAC inhibitor NSC23766 (NSC)”
Rated minor: it would not touch a result — a value no result rests on, a p-value that stays on the same side of the significance level, or a conflict that is clerical, resolved elsewhere in the paper, or outside its own findings.
In the paper
§ Mitochondrial Dysfunction in Human Leukemic Stem/Progenitor Cells upon Loss of RAC2 > Results > RAC2 depletion profoundly impairs expansion of primitive leukemic cobblestone cells
“Disappearance of cobblestones during the co-culture and the dramatic decrease in cell counts (Fig 1A and 1B)”
§ Mitochondrial Dysfunction in Human Leukemic Stem/Progenitor Cells upon Loss of RAC2 > Results > Human BCR-ABL transduced cells critically depend on RAC2 signaling
“Quantitative PCR was performed to measure RAC1 (left panel) or RAC2 mRNA levels (right panel) normalized against RPL27 mRNA.”
Rated minor: it would not touch a result — a value no result rests on, a p-value that stays on the same side of the significance level, or a conflict that is clerical, resolved elsewhere in the paper, or outside its own findings.
In the paper
§ Mitochondrial Dysfunction in Human Leukemic Stem/Progenitor Cells upon Loss of RAC2 > Materials and Methods > Primary cell isolation and culture conditions
“Blast crisis chronic myeloid leukemia (BC CML) blasts from peripheral blood cells from an untreated patient with BC CML (patient 2007–048, with the t(9;22) translocation)”
§ Mitochondrial Dysfunction in Human Leukemic Stem/Progenitor Cells upon Loss of RAC2 > Results > Human BCR-ABL transduced cells critically depend on RAC2 signaling
“BC CML CD34+ cells (patient 2007–043) were sorted and plated on MS5 stroma.”
Citations
Cites
Bonnet, D., & Dick, J. E. (1997) · Nature Medicine · doi:10.1038/nm0797-730 · Cited by 5,864
A cell initiating human acute myeloid leukaemia after transplantation into SCID mice
Lapidot, T., Sirard, C., Vormoor, J., Murdoch, B., Hoang, T., Caceres-Cortes, J., Minden, M., Paterson, B., Caligiuri, M. A., & Dick, J. E. (1994) · Nature · doi:10.1038/367645a0 · Cited by 4,783
Cytokine-mediated regulation of CXCR4 expression in human neutrophils
Nagase, H., Miyamasu, M., Yamaguchi, M., Imanishi, M., Tsuno, N. H., Matsushima, K., Yamamoto, K., Morita, Y., & Hirai, K. (2002) · Journal of Leukocyte Biology · doi:10.1189/jlb.71.4.711 · Cited by 4,713
Osteoblastic cells regulate the haematopoietic stem cell niche
Calvi, L. M., Adams, G. B., Weibrecht, K. W., Weber, J. M., Olson, D. P., Knight, M. C., Martin, R. P., Schipani, E., Pajevic, P. D., Bringhurst, F. R., et al. (2003) · Nature · doi:10.1038/nature02040 · Cited by 3,559
Kiel, M. J., Yilmaz, Ö. H., Iwashita, T., Yilmaz, O. H., Terhorst, C., & Morrison, S. J. (2005) · Cell · doi:10.1016/j.cell.2005.05.026 · Cited by 3,168
Sugiyama, T., Kohara, H., Noda, M., & Nagasawa, T. (2006) · Immunity · doi:10.1016/j.immuni.2006.10.016 · Cited by 2,419
The relationship between the spleen colony-forming cell and the haemopoietic stem cell.
Schofield, R. (1978) · PubMed · Cited by 2,332
Ishikawa, F., Yoshida, S., Saito, Y., Hijikata, A., Kitamura, H., Tanaka, S., Nakamura, R., Tanaka, T., Tomiyama, H., Saito, N., et al. (2007) · Nature Biotechnology · doi:10.1038/nbt1350 · Cited by 909
Stem cell engraftment at the endosteal niche is specified by the calcium-sensing receptor
Adams, G. B., Chabner, K. T., Alley, I. R., Olson, D. P., Szczepiorkowski, Z. M., Poznansky, M. C., Kos, C. H., Pollak, M. R., Brown, E. M., & Scadden, D. T. (2005) · Nature · doi:10.1038/nature04247 · Cited by 824
Uncertainty in the niches that maintain haematopoietic stem cells
Kiel, M. J., & Morrison, S. J. (2008) · Nature reviews. Immunology · doi:10.1038/nri2279 · Cited by 610
Cited by
Rho GTPase signaling in cancer progression and dissemination
Crosas‐Molist, E., Samain, R., Kohlhammer, L., Orgaz, J. L., George, S. L., Maiques, Ó., Barcelo, J., & Sanz‐Moreno, V. (2021) · Physiological Reviews · doi:10.1152/physrev.00045.2020 · Cited by 300
RHO GTPases in cancer: known facts, open questions, and therapeutic challenges
Bustelo, X. R. (2018) · Biochemical Society Transactions · doi:10.1042/bst20170531 · Cited by 89
Beyond Neuronal Microtubule Stabilization: MAP6 and CRMPS, Two Converging Stories
Cuveillier, C., Boulan, B., Ravanello, C., Denarier, É., Deloulme, J., Gory‐Fauré, S., Delphin, C., Bosc, C., Arnal, I., & Andrieux, A. (2021) · Frontiers in Molecular Neuroscience · doi:10.3389/fnmol.2021.665693 · Cited by 41
Whole exome sequencing in three families segregating a pediatric case of sarcoidosis
France), I. T. F. O. G. (. S., Calender, A., Farnier, P. A. R., Buisson, A., Pinson, S., Bentaher, A., Lebecque, S., Corvol, H., Taam, R. A., Houdouin, V., et al. (2018) · BMC Medical Genomics · doi:10.1186/s12920-018-0338-x · Cited by 38
Peris, L., Bisbal, M., Hernández, J. M., Saoudi, Y., Jonckheere, J., Rolland, M., Sébastien, M., Brocard, J., Denarier, É., Bosc, C., et al. (2018) · Nature Communications · doi:10.1038/s41467-018-05869-z · Cited by 37
Metadata
- Authors
- Capala, M. E., Maat, H., Bonardi, F., van den Boom, V., Kuipers, J., Vellenga, E., Giepmans, B. N. G., & Schuringa, J. J.
- Affiliations
- University Medical Center Groningen (NL)
- Corresponding author
- Schuringa, Jan Jacob
- Venue
- PLOS ONE
- Publisher
- Public Library of Science (PLoS)
- Published
- 2015-05-27
- Volume
- 10
- Issue
- 5
- Pages
- e0128585
- ISSN
- 1932-6203 (ISSN-L)
- PMC
- PMC4446344
- OpenAlex
- W2102434735
- Cited by
- 20
- References
- 50
- Citations by year
- 2026: 3 · 2023: 2 · 2021: 2 · 2020: 2 · 2019: 3 · 2018: 4 · 2017: 2 · 2016: 2
- FWCI
- 1.77
- Type
- journal article
- Language
- en
- Open access
- gold
- doi.org
- Licence
- Locations
- PLoS ONE (publishedVersion, cc-by)
- PubMed (publishedVersion)
- PubMed Central (publishedVersion, cc-by)
- University of Groningen research database (University of Groningen / Centre for Information Technology) (publishedVersion, cc-by)
- DOAJ (DOAJ: Directory of Open Access Journals) (submittedVersion, cc-by-sa)
- Figshare (submittedVersion, cc-by)
- University of Groningen research database (University of Groningen / Centre for Information Technology) (submittedVersion, cc-by)
- Funders
- ZonMw (91111.006, 91111)
- Nederlandse Organisatie voor Wetenschappelijk Onderzoek (91111, ZonMW 91111.006, 91111.006)
- Topics
- Health Sciences › Medicine › Hematology › Acute Myeloid Leukemia Research
- Life Sciences › Biochemistry, Genetics and Molecular Biology › Molecular Biology › Mitochondrial Function and Pathology
- Health Sciences › Medicine › Hematology › Chronic Myeloid Leukemia Treatments
- Keywords
- Rac2, Rac1, leukemia stem cells, hematopoietic stem and progenitor cells, BCR-ABL, mitochondrial dysfunction, mitochondrial membrane potential, mitochondrial ultrastructure, Sam50, mitochondrial transport proteins, self-renewal, apoptosis, cell cycle, Rac GTPase
- MeSH terms
- Mitochondrial Precursor Protein Import Complex Proteins, RAC2 GTP-Binding Protein, Bone Marrow Cells, Cell Cycle, Cell Line, Hematopoietic Stem Cells, Humans, Membrane Proteins, Mitochondria, Proteins, Stem Cells, Leukemia, Myelogenous, Chronic, BCR-ABL Positive, Down-Regulation, Fusion Proteins, bcr-abl, Apoptosis, rac GTP-Binding Proteins, Mitochondrial Proteins, Mitochondrial Diseases, Mitochondrial Membrane Transport Proteins, Immunoprecipitation, Cell Proliferation, Membrane Potential, Mitochondrial, HEK293 Cells
About these checks
Registry, retraction, Cites and statistics results are computed, not judged, with one exception: a printed reference that no index lists is read once by a model before it counts as a citation error. Claims are extracted by a model and kept only when their quote appears verbatim in the text; each cited source is then checked, with a model’s help, for whether it says what the claim relies on. Those verdicts can be wrong — read the claim’s quote and the cited source before relying on one.
A language model drew the claims from the paper on 2026-11-12, under version 3 of the claim definition (model deepseek-v4.1-flash, prompt extract-v3).
A second model labelled each claim on 2026-11-12 (model jev-1.13-20260917, definition revision gold-guideline-v0.2).
Statistics and arithmetic are recomputed, not judged.
Confidence bands are shown only for fields calibrated on our annotated test set. None is calibrated yet, so no band is shown.
What counts as a claim ›How we measure confidence ›How we check this ›
Are you an author, or do you see a problem with this page? Request a review
How to cite
Cite CoChat for the checks on this page, and the paper for its own findings.
- This page
- CoChat. (2026). Citation check: Mitochondrial Dysfunction in Human Leukemic Stem/Progenitor Cells upon Loss of RAC2. https://app.cochat.ai/papers/10.1371/journal.pone.0128585
- The paper
- Capala, M. E., Maat, H., Bonardi, F., van den Boom, V., Kuipers, J., Vellenga, E., Giepmans, B. N. G., & Schuringa, J. J. (2015). Mitochondrial Dysfunction in Human Leukemic Stem/Progenitor Cells upon Loss of RAC2. PLOS ONE. https://doi.org/10.1371/journal.pone.0128585
