

The DOI matches its Crossref record; 43 of the 43 references it cites were found in a registry or an index.
Glucagon-like peptide-1 receptor agonist Liraglutide has anabolic bone effects in ovariectomized rats without diabetes
Open accessAbstract
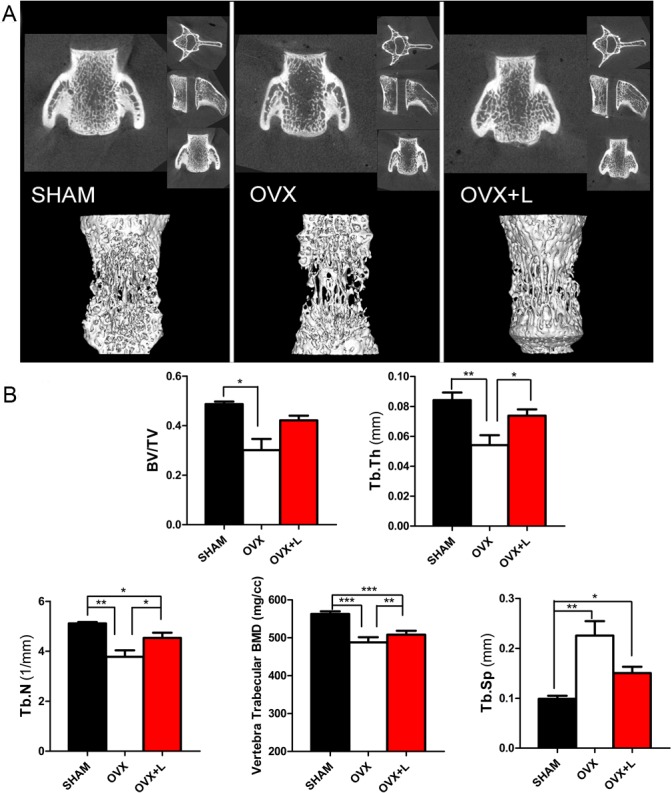
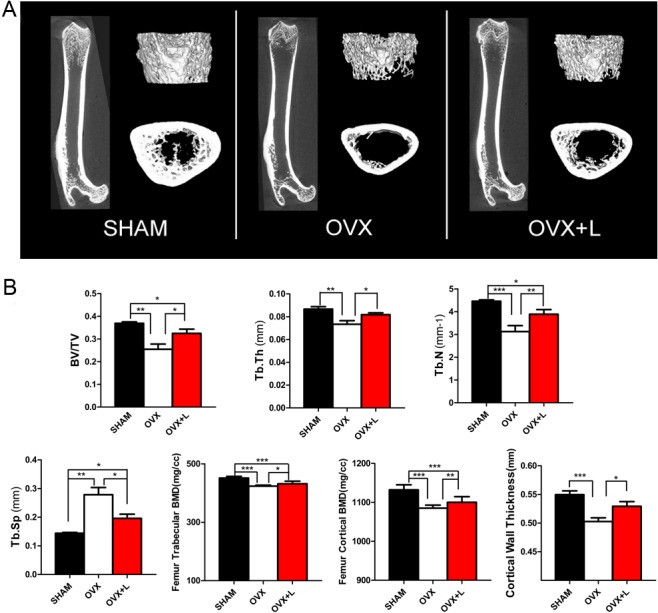
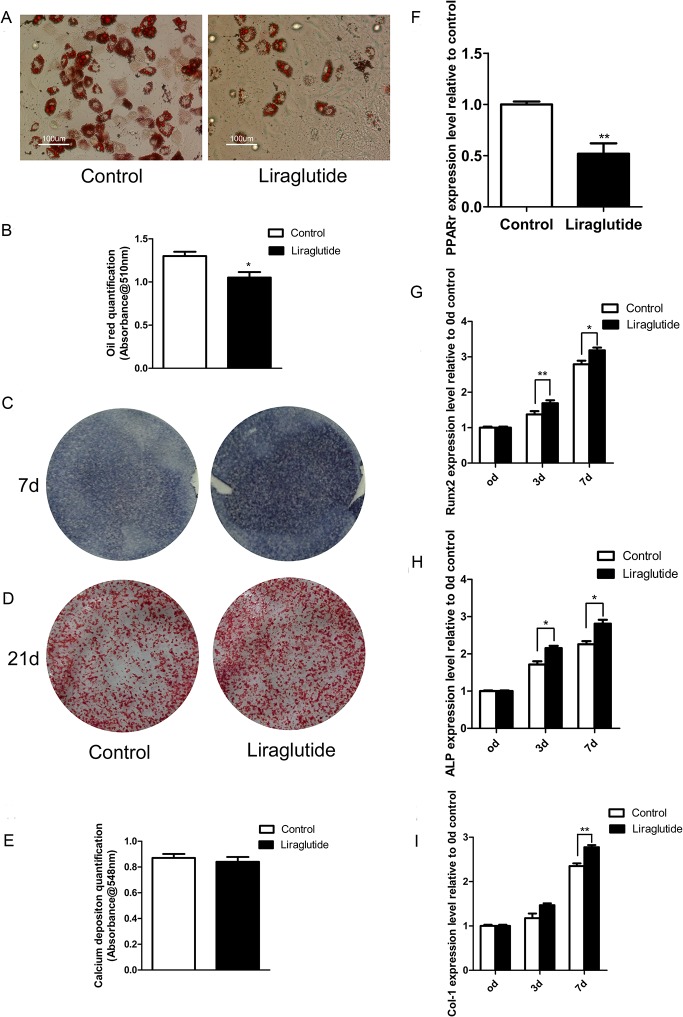
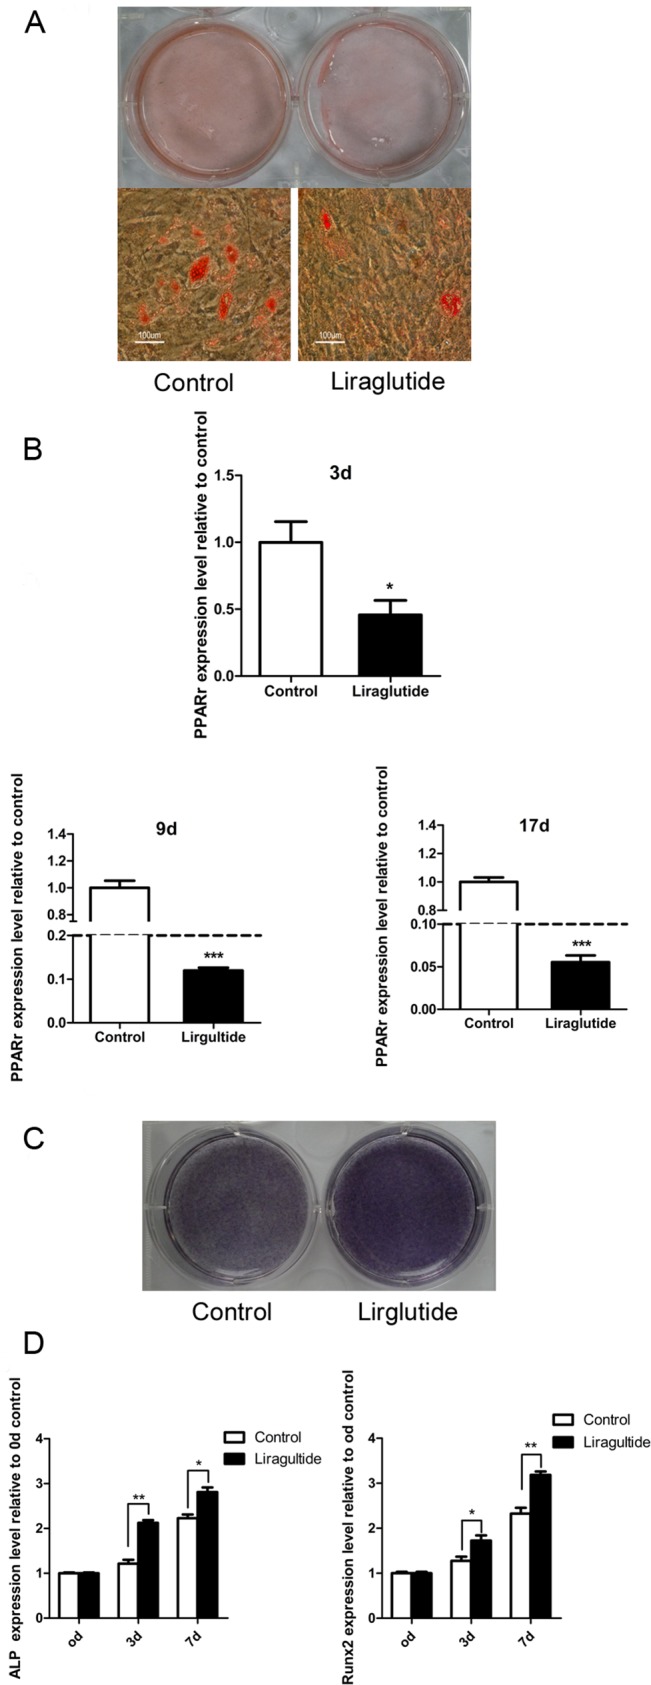
Recently, a number of studies have demonstrated the potential beneficial role for novel anti-diabetic GLP-1 receptor agonists (GLP-1RAs) in the skeleton metabolism in diabetic rodents and patients. In this study, we evaluated the impacts of the synthetic GLP-1RA Liraglutide on bone mass and quality in osteoporotic rats induced by ovariectomy (OVX) but without diabetes, as well as its effect on the adipogenic and osteoblastogenic differentiation of bone marrow stromal cells (BMSCs). Three months after sham surgery or bilateral OVX, eighteen 5-month old female Wistar rats were randomly divided into three groups to receive the following treatments for 2 months: (1) Sham + normal saline; (2) OVX + normal saline; and (3) OVX + Liraglutide (0.6 mg/day). As revealed by micro-CT analysis, Liraglutide improved trabecular volume, thickness and number, increased BMD, and reduced trabecular spacing in the femurs in OVX rats; similar results were observed in the lumbar vertebrae of OVX rats treated with Liraglutide. Following in vitro treatment of rat and human BMSCs with 10 nM Liraglutide, there was a significant increase in the mRNA expression of osteoblast-specific transcriptional factor Runx2 and the osteoblast markers alkaline phosphatase (ALP) and collagen α1 (Col-1), but a significant decrease in peroxisome proliferator-activated receptor γ (PPARγ). In conclusion, our results indicate that the anti-diabetic drug Liraglutide can exert a bone protective effect even in non-diabetic osteoporotic OVX rats. This protective effect is likely attributable to the impact of Liraglutide on the lineage fate determination of BMSCs.
Overview
The claims and statistics of this paper haven’t been checked yet.
Run the check — free, no account needed. It reads the open-access text and checks the sources it cites.
Integrity signals
Registry
Cites
Statistics
Figures
Verification
Claims the paper makes
The claims and statistics of this paper haven’t been checked yet.
Run the check — free, no account needed. It reads the open-access text and checks the sources it cites.
Claims other papers make about this one
Each is checked against this paper’s own text: does it say what the citing paper says it does?
In the citing paper
“Animal models have indicated positive effects of the GLP-1 receptor agonists exendin-4 and liraglutide on bone metabolism (11–13).”
Self-check
Percentages, sums and reported differences re-computed from the paper’s own numbers.
The self-check needs the paper’s full text.
Citations
Cites
Guidelines for assessment of bone microstructure in rodents using micro–computed tomography
Bouxsein, M., Boyd, S. K., Christiansen, B., Guldberg, R. E., Jepsen, K. J., & Müller, R. (2010) · Journal of Bone and Mineral Research · doi:10.1002/jbmr.141 · Cited by 4,461
Komori, T., Yagi, H., Nomura, S., Yamaguchi, A., Sasaki, K., Deguchi, K., Shimizu, Y., Bronson, R. T., Gao, Y.-H., Inada, M., et al. (1997) · Cell · doi:10.1016/s0092-8674(00)80258-5 · Cited by 4,244
The biology of incretin hormones
Drucker, D. J. (2006) · Cell Metabolism · doi:10.1016/j.cmet.2006.01.004 · Cited by 2,210
Pharmacology, physiology, and mechanisms of incretin hormone action.
Campbell, J. E., & Drucker, D. J. (2013) · Cell Metabolism · doi:10.1016/j.cmet.2013.04.008 · Cited by 1,500
Astrup, A., Rössner, S., Van Gaal, L., Rissanen, A., Niskanen, L., Al Hakim, M., Madsen, J., Rasmussen, M. F., & Lean, M. E. (2009) · The Lancet · doi:10.1016/s0140-6736(09)61375-1 · Cited by 1,163
PPAR γ insufficiency enhances osteogenesis through osteoblast formation from bone marrow progenitors
Akune, T., Ohba, S., Kamekura, S., Yamaguchi, M., Chung, U., Kubota, N., Terauchi, Y., Harada, Y., Azuma, Y., Nakamura, K., et al. (2004) · Journal of Clinical Investigation · doi:10.1172/jci19900 · Cited by 869
PPAR γ insufficiency enhances osteogenesis through osteoblast formation from bone marrow progenitors
Akune, T., Ohba, S., Kamekura, S., et al. (2004) · Journal of Clinical Investigation · doi:10.1172/jci200419900 · Cited by 730
Bjerre Knudsen, L., Madsen, L. W., Andersen, S., Almholt, K., de Boer, A. S., Drucker, D. J., Gotfredsen, C., Egerod, F. L., Hegelund, A. C., Jacobsen, H., et al. (2010) · Endocrinology · doi:10.1210/en.2009-1272 · Cited by 672 · cited 1×
“In rodent models, Liraglutide can stimulate calcitonin release, which can bind to receptors on rat osteoclasts and inhibit bone resorption [35, 41].”
BackgroundCardiovascular Biology of the Incretin System
Ussher, J. R., & Drucker, D. J. (2012) · Endocrine Reviews · doi:10.1210/er.2011-1052 · Cited by 534
Panjwani, N., Mulvihill, E. E., Longuet, C., Yusta, B., Campbell, J. E., Brown, T. J., Streutker, C., Holland, D., Cao, X., Baggio, L. L., et al. (2013) · Endocrinology · doi:10.1210/en.2012-1937 · Cited by 346
Cited by
Sorted by citations
Incretin hormones: Their role in health and disease
Nauck, M. A., & Meier, J. J. (2018) · Diabetes, Obesity and Metabolism · doi:10.1111/dom.13129 · Cited by 950
Update on the impact of type 2 diabetes mellitus on bone metabolism and material properties
Picke, A., Campbell, G. M., Napoli, N., Hofbauer, L. C., & Rauner, M. (2019) · Endocrine Connections · doi:10.1530/ec-18-0456 · Cited by 207
BMI and BMD: the potential interplay between obesity and bone fragility
Palermo, A., Tuccinardi, D., Defeudis, G., Watanabe, M., D’Onofrio, L., Lauria Pantano, A., Napoli, N., Pozzilli, P., & Manfrini, S. (2016) · International Journal of Environmental Research and Public Health · doi:10.3390/ijerph13060544 · Cited by 197
Savvidis, C., Tournis, S., & Dede, A. D. (2018) · HORMONES · doi:10.1007/s42000-018-0018-4 · Cited by 155
Perna, S., Guido, D., Bologna, C., Solerte, S. B., Guerriero, F., Isu, A., & Rondanelli, M. (2016) · Aging Clinical and Experimental Research · doi:10.1007/s40520-015-0525-y · Cited by 125
Metadata
- Authors
- Lu, N., Sun, H., Yu, J., Wang, X., Liu, D., Zhao, L., Sun, L., Zhao, H., Tao, B., & Liu, J.
- Affiliations
- Shanghai Jiao Tong University (CN)
- Corresponding author
- Tao, Bei
- Liu, Jianmin
- Venue
- PLOS ONE
- Publisher
- Public Library of Science (PLoS)
- Published
- 2015-07-15
- Volume
- 10
- Issue
- 7
- Pages
- e0132744
- ISSN
- 1932-6203 (ISSN-L)
- PMC
- PMC4503456
- OpenAlex
- W897329354
- Cited by
- 108
- References
- 42
- Citations by year
- 2026: 10 · 2025: 13 · 2024: 11 · 2023: 8 · 2022: 5 · 2021: 6 · 2020: 4 · 2019: 14 · 2018: 18 · 2017: 12 · 2016: 6 · 2015: 1
- FWCI
- 12.73
- Type
- journal article
- Language
- en
- Open access
- gold
- doi.org
- Licence
- Locations
- PLoS ONE (publishedVersion, cc-by)
- PubMed Central (publishedVersion, cc-by)
- PubMed (publishedVersion)
- DOAJ (DOAJ: Directory of Open Access Journals) (submittedVersion, cc-by-sa)
- Funders
- National Natural Science Foundation of China (81370977, 81170804, 81370018)
- Shanghai Municipal Health Bureau
- Topics
- Health Sciences › Medicine › Orthopedics and Sports Medicine › Bone health and osteoporosis research
- Life Sciences › Biochemistry, Genetics and Molecular Biology › Molecular Biology › Bone Metabolism and Diseases
- Health Sciences › Medicine › Endocrinology, Diabetes and Metabolism › Diabetes Treatment and Management
- Keywords
- liraglutide, GLP-1 receptor agonists, osteoporosis, ovariectomy, bone mass, bone quality, mesenchymal stem cells, osteogenic differentiation, adipogenesis, Runx2, PPARγ, trabecular bone
- MeSH terms
- Glucagon-Like Peptide-1 Receptor, Liraglutide, Glucagon-Like Peptide-1 Receptor Agonists, Animals, Bone and Bones, Cells, Cultured, Diabetes Mellitus, Female, Humans, Male, Osteoblasts, Osteogenesis, Osteoporosis, Ovariectomy, Bone Density, Rats, Wistar, Anabolic Agents, PPAR gamma, Adipogenesis, Rats, Mesenchymal Stem Cells
About these checks
Registry, retraction, Cites and statistics results are computed, not judged, with one exception: a printed reference that no index lists is read once by a model before it counts as a citation error. Claims are extracted by a model and kept only when their quote appears verbatim in the text; each cited source is then checked, with a model’s help, for whether it says what the claim relies on. Those verdicts can be wrong — read the claim’s quote and the cited source before relying on one.
Statistics and arithmetic are recomputed, not judged.
Confidence bands are shown only for fields calibrated on our annotated test set. None is calibrated yet, so no band is shown.
What counts as a claim ›How we measure confidence ›How we check this ›
Are you an author, or do you see a problem with this page? Request a review
