

The DOI matches its Crossref record; 94 of the 94 references it cites were found in a registry or an index.
Investigating the Role of TNF-α and IFN-γ Activation on the Dynamics of iNOS Gene Expression in LPS Stimulated Macrophages
Open accessAbstract
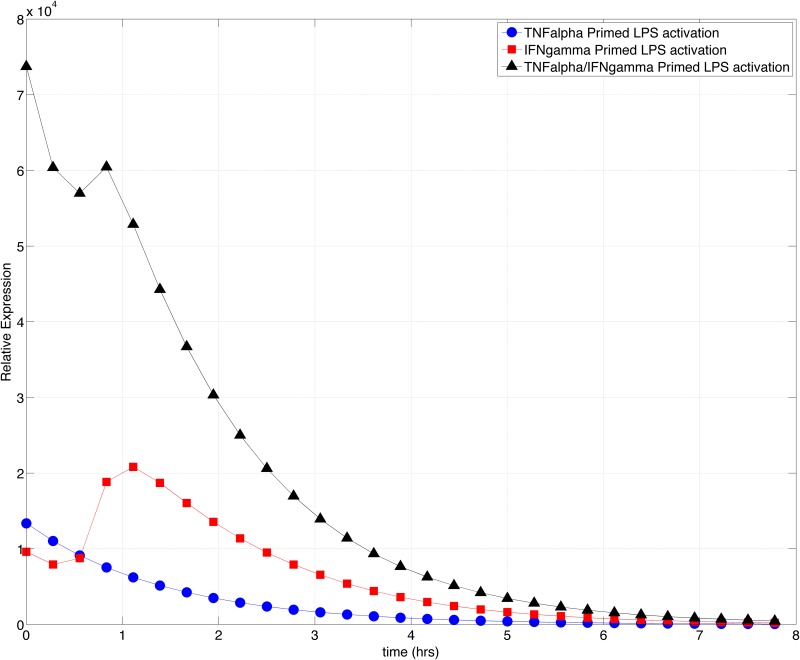
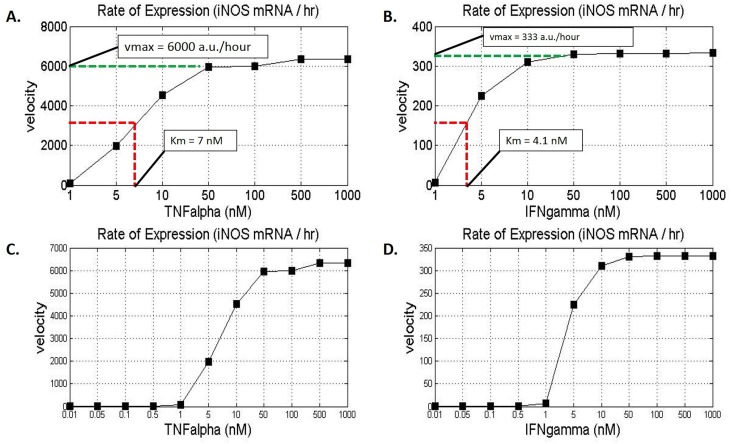
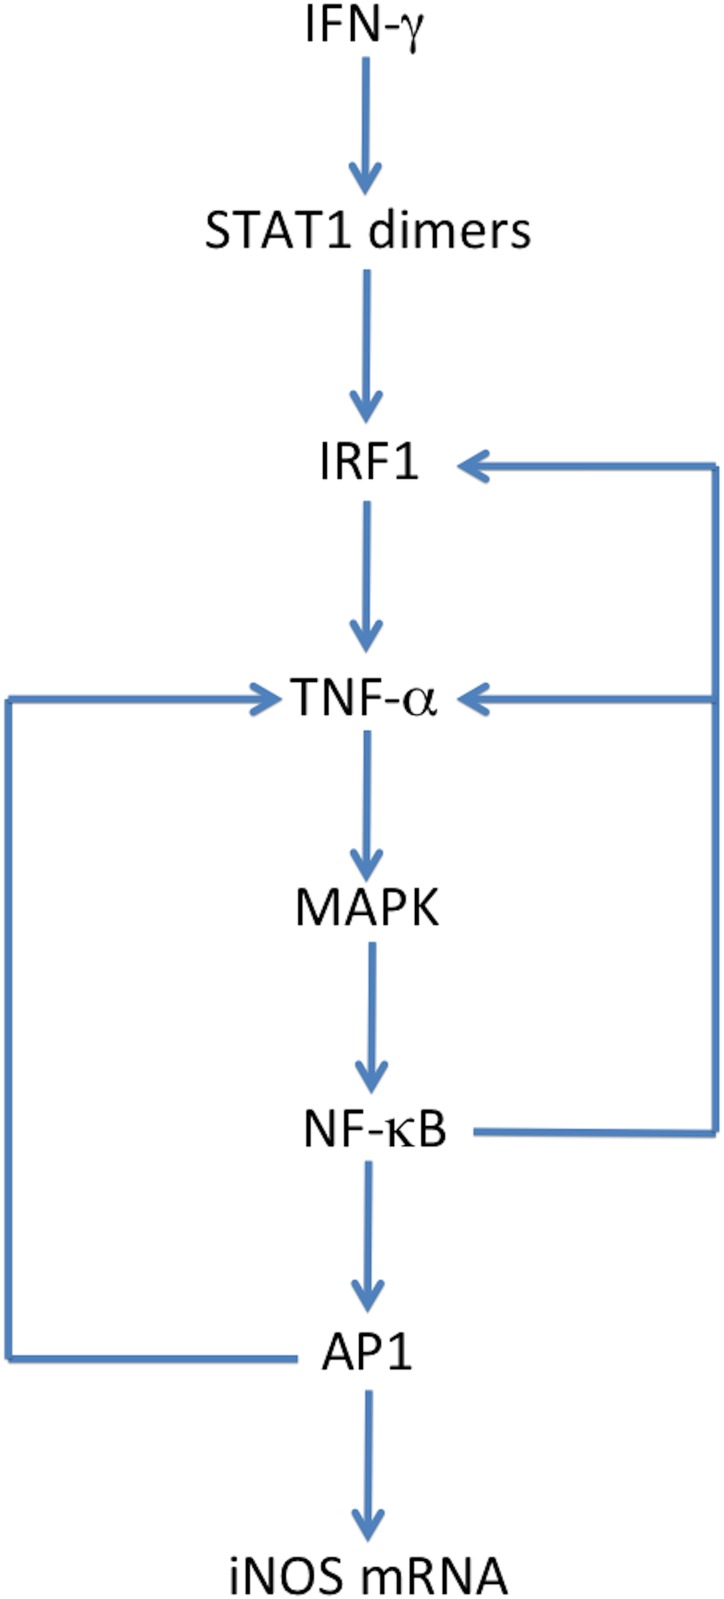
Macrophage produced inducible nitric oxide synthase (iNOS) is known to play a critical role in the proinflammatory response against intracellular pathogens by promoting the generation of bactericidal reactive nitrogen species. Robust and timely production of nitric oxide (NO) by iNOS and analogous production of reactive oxygen species are critical components of an effective immune response. In addition to pathogen associated lipopolysaccharides (LPS), iNOS gene expression is dependent on numerous proinflammatory cytokines in the cellular microenvironment of the macrophage, two of which include interferon gamma (IFN-γ) and tumor necrosis factor alpha (TNF-α). To understand the synergistic effect of IFN-γ and TNF-α activation, and LPS stimulation on iNOS expression dynamics and NO production, we developed a systems biology based mathematical model. Using our model, we investigated the impact of pre-infection cytokine exposure, or priming, on the system. We explored the essentiality of IFN-γ priming to the robustness of initial proinflammatory response with respect to the ability of macrophages to produce reactive species needed for pathogen clearance. Results from our theoretical studies indicated that IFN-γ and subsequent activation of IRF1 are essential in consequential production of iNOS upon LPS stimulation. We showed that IFN-γ priming at low concentrations greatly increases the effector response of macrophages against intracellular pathogens. Ultimately the model demonstrated that although TNF-α contributed towards a more rapid response time, measured as time to reach maximum iNOS production, IFN-γ stimulation was significantly more significant in terms of the maximum expression of iNOS and the concentration of NO produced.
Overview
The claims and statistics of this paper haven’t been checked yet.
Run the check — free, no account needed. It reads the open-access text and checks the sources it cites.
Integrity signals
Registry
Cites
Statistics
Figures
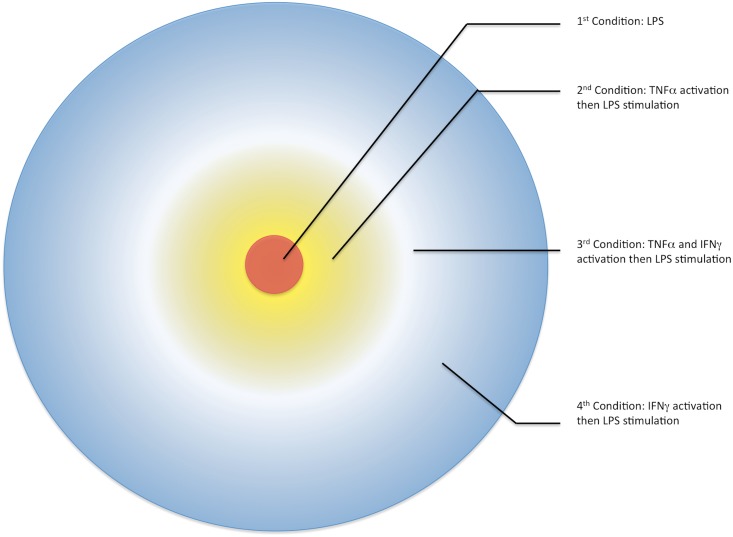
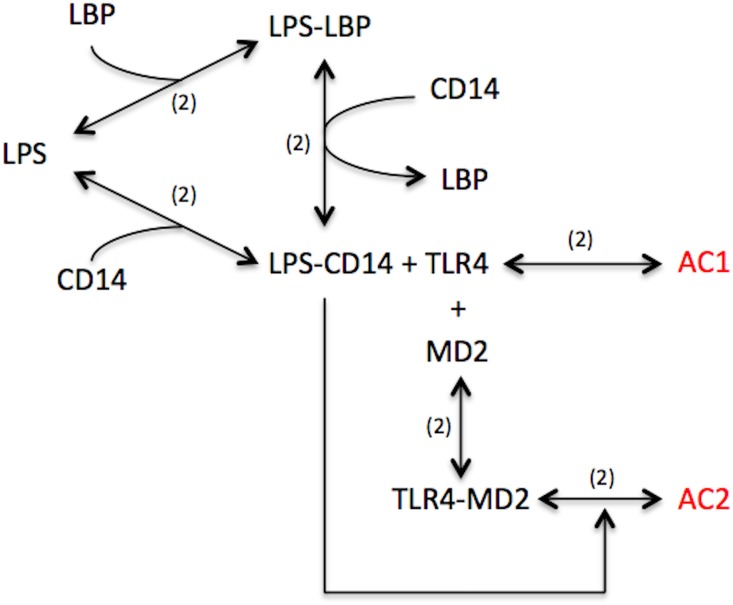
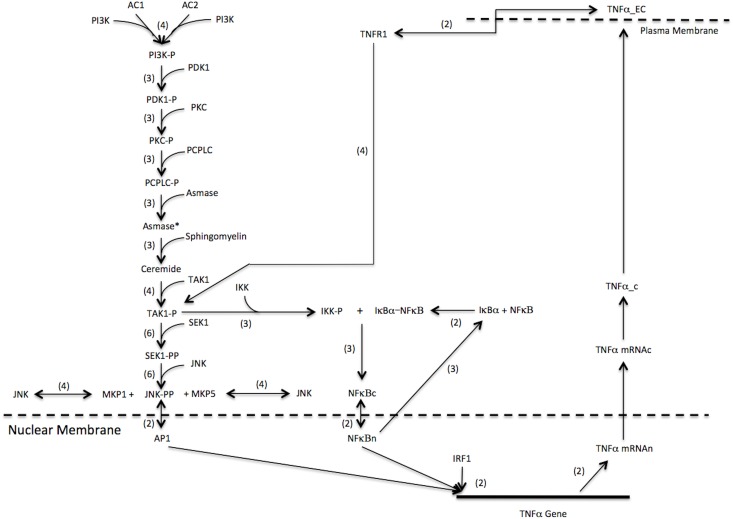
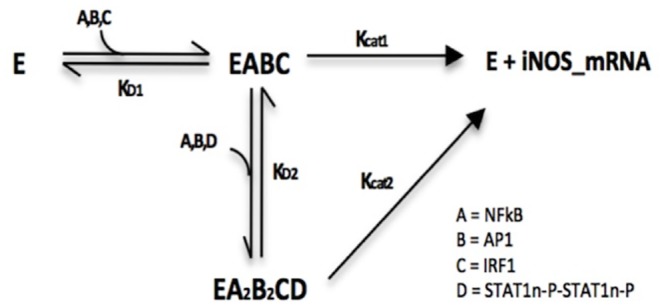
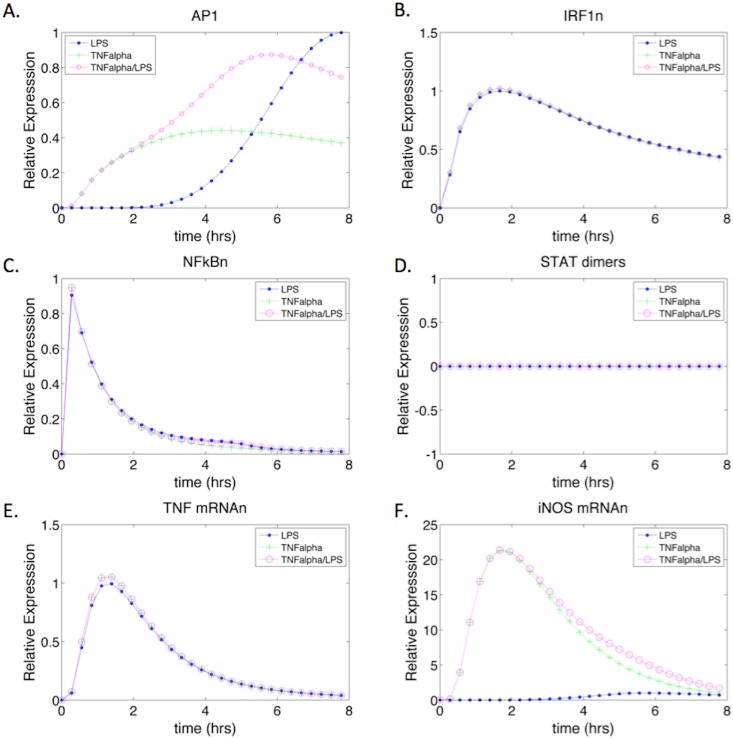
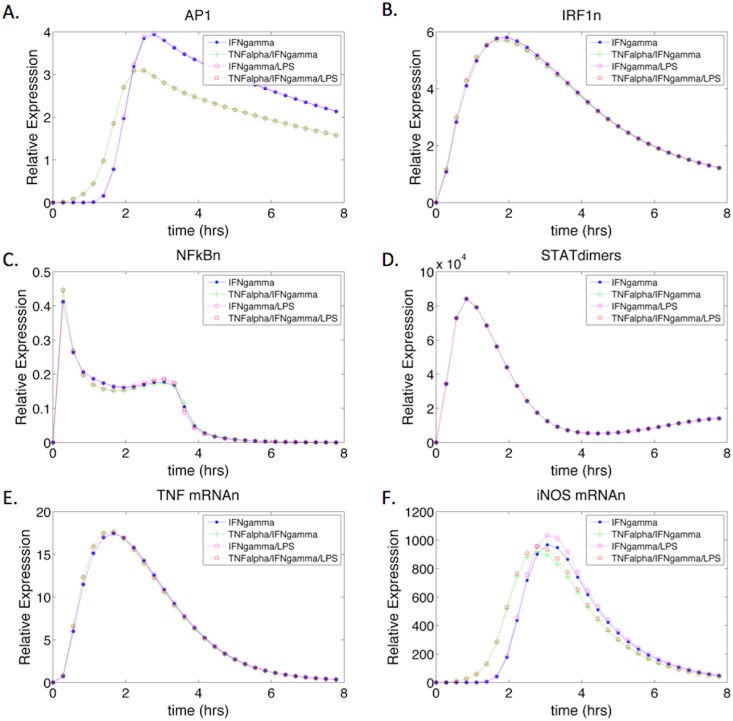
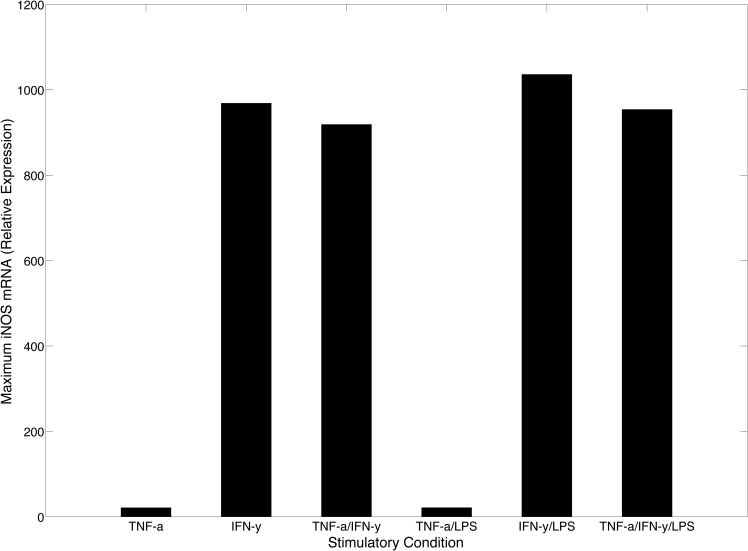
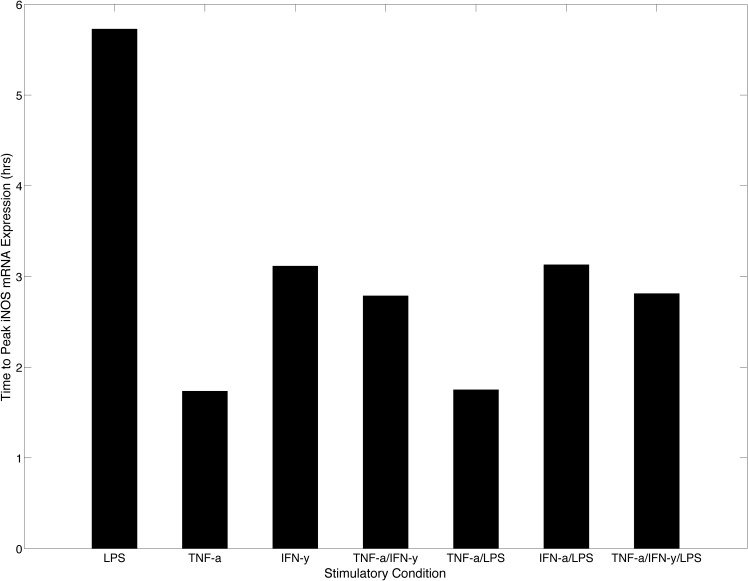
Verification
Claims the paper makes
The claims and statistics of this paper haven’t been checked yet.
Run the check — free, no account needed. It reads the open-access text and checks the sources it cites.
Claims other papers make about this one
Each is checked against this paper’s own text: does it say what the citing paper says it does?
In the citing paper
“The expression of iNOS is inducible by cytokines (IFN-γ, TNF-α, and IL-2) [106].”
From The Role of Reactive Species on Innate Immunity (2022) · cites this paper as [106]
Self-check
Percentages, sums and reported differences re-computed from the paper’s own numbers.
The self-check needs the paper’s full text.
Citations
Cites
1 retracted
Guo, H., Mi, Z., & Kuo, P. C. (2008) · Journal of Biological Chemistry · doi:10.1074/jbc.m804062200 · Cited by 17
RetractedNITRIC OXIDE AND MACROPHAGE FUNCTION
MacMicking, J. D., Xie, Q. W., & Nathan, C. (1997) · Annual Review of Immunology · doi:10.1146/annurev.immunol.15.1.323 · Cited by 4,245
Interferon-γ: an overview of signals, mechanisms and functions
Schroder, K., Hertzog, P. J., Ravasi, T., & Hume, D. A. (2004) · Journal of Leukocyte Biology · doi:10.1189/jlb.0603252 · Cited by 4,120
Regulation of Interferon‐γ During Innate and Adaptive Immune Responses
Schoenborn, J. R., & Wilson, C. B. (2007) · Advances in immunology · doi:10.1016/s0065-2776(07)96002-2 · Cited by 1,709
Tumor Necrosis Factor-α Signaling in Macrophages
Parameswaran, N., & Patial, S. (2010) · Critical Reviews in Eukaryotic Gene Expression · doi:10.1615/critreveukargeneexpr.v20.i2.10 · Cited by 1,490
Type I Inteferon Gene Induction by the Interferon Regulatory Factor Family of Transcription Factors
Honda, K., Takaoka, A., & Taniguchi, T. (2006) · Immunity · doi:10.1016/j.immuni.2006.08.009 · Cited by 1,386
Ultrasensitivity in the mitogen-activated protein kinase cascade.
Huang, C. Y., & Ferrell, J. E. (1996) · Proceedings of the National Academy of Sciences · doi:10.1073/pnas.93.19.10078 · Cited by 1,186
BioNumbers—the database of key numbers in molecular and cell biology
Milo, R., Jorgensen, P., Moran, U., Weber, G., & Springer, M. (2010) · Nucleic Acids Research · doi:10.1093/nar/gkp889 · Cited by 1,055
Nitric Oxide Production and Signaling in Inflammation
Korhonen, R., Lahti, A., Kankaanranta, H., & Moilanen, E. (2005) · Current Drug Targets - Inflammation & Allergy · doi:10.2174/1568010054526359 · Cited by 920
Klipp, E., Wierling, C., & Liebermeister, W. (1994) · Cited by 740
Research works printed but not linked: 9
- E Bartee, 2013, Cytokine synergy: an underappreciated contributor to innate anti-viral immunity, Cytokine, 63, 237, 10.1016/j.cyto.2013.04.036 · DOI
- GC Sharp, 2013, A computational model of lipopolysaccharide-induced nuclear factor kappa B activation: a key signalling pathway in infection-induced preterm labour, PLoS One, 8, e70180, 10.1371/journal.pone.0070180 · DOI
- J Gutierrez, 2010, Propagation of kinetic uncertainties through a canonical topology of the TLR4 signaling network in dierent regions of biochemical reaction space. Additional file 1—Mathematical structure of the signal transductionnetwork: kinetic parameters, initial conditions, and rate equations, Theoretical Biology and Medical Modeling
- H Helge, 1990, Haldorsen, Elvind Damsleth, Stochastic Modeling, 42
- HJ Shin, 2007, Kinetics of binding of LPS to recombinant CD14, TLR4, and MD-2 proteins, Mol Cells, 24, 119, 10.1016/S1016-8478(23)10763-1 · DOI
- HJ Shin, 2007, Kinetics of binding of LPS to recombinant CD14, TLR4, and MD-2 proteins, Mol Cells, 24, 119, 10.1016/S1016-8478(23)10763-1 · DOI
- T Rein, 1994, In vivo footprinting of the IRF-1 promoter: inducible occupation of a GAS element next to a persistent structural alteration of the DNA, Nucleic Acids Res, 22, 3033, 10.1093/nar/22.15.3033 · DOI
- MP Hayes, 1995, IFN-gamma priming of monocytes enhances LPS-induced TNF production by augmenting both transcription and MRNA stability, Cytokine, 7, 427, 10.1006/cyto.1995.0058 · DOI
- JG Williams, 1992, Macrophage priming by interferon gamma: a selective process with potentially harmful effects, J Leukoc Biol, 52, 579, 10.1002/jlb.52.6.579 · DOI
Cited by
Sorted by citations
Karki, R., Sharma, B. R., Tuladhar, S., Williams, E. P., Zalduondo, L., Samir, P., Zheng, M., Sundaram, B., Banoth, B., Malireddi, R. K. S., et al. (2021) · Cell · doi:10.1016/j.cell.2020.11.025 · Cited by 1,734
The dual nature of type I and type II interferons
Lee, A. J., & Ashkar, A. A. (2018) · Frontiers in Immunology · doi:10.3389/fimmu.2018.02061 · Cited by 690
Pathogenesis of Important Virulence Factors of Porphyromonas gingivalis via Toll-Like Receptors
Lü, J., Han, N., Du, J., Guo, L., Luo, Z., & Liu, Y. F. (2019) · Frontiers in Cellular and Infection Microbiology · doi:10.3389/fcimb.2019.00262 · Cited by 284
Activating a collaborative innate-adaptive immune response to control metastasis
Sun, L., Kees, T., Almeida, A. S., Liu, B., He, X., Ng, D. C., Han, X., Spector, D. L., McNeish, I. A., Gimotty, P. A., et al. (2021) · Cancer Cell · doi:10.1016/j.ccell.2021.08.005 · Cited by 268
Nitric oxide in cellular adaptation and disease
Gantner, B. N., LaFond, K. M., & Bonini, M. G. (2020) · Redox Biology · doi:10.1016/j.redox.2020.101550 · Cited by 217
Sensitivity analysis methods in the biomedical sciences
Qian, G., & Mahdi, A. (2020) · Mathematical Biosciences · doi:10.1016/j.mbs.2020.108306 · Cited by 169
The Role of Reactive Species on Innate Immunity
Andrés, C., Pérez de la Lastra, J., Juan, C., Plou, F., & Pérez-Lebeña, E. (2022) · Vaccines · doi:10.3390/vaccines10101735 · Cited by 142
Functional Amino Acids in Pigs and Chickens: Implication for Gut Health
Chalvon‐Demersay, T., Luise, D., Floc'H, N. L., Tesseraud, S., Lambert, W., Bosi, P., Trevisi, P., Beaumont, M., & Corrent, E. (2021) · Frontiers in Veterinary Science · doi:10.3389/fvets.2021.663727 · Cited by 115
Hyperglycemia acts in synergy with hypoxia to maintain the pro-inflammatory phenotype of macrophages
Morey, M., Gaora, P. Ó., Pandit, A. S., & Hélary, C. (2019) · PLoS ONE · doi:10.1371/journal.pone.0220577 · Cited by 116
Mammana, S., Cavalli, E., Gugliandolo, A., Silvestro, S., Pollastro, F., Bramanti, P., & Mazzon, E. (2019) · Medicina · doi:10.3390/medicina55110747 · Cited by 87
Mu, K., Yu, S., & Kitts, D. D. (2019) · International Journal of Molecular Sciences · doi:10.3390/ijms20071755 · Cited by 84
Nitric Oxide as a Target for Phytochemicals in Anti-Neuroinflammatory Prevention Therapy
Subedi, L., Gaire, B. P., Kim, S. Y., & Parveen, A. (2021) · International Journal of Molecular Sciences · doi:10.3390/ijms22094771 · Cited by 82
Modulating Nitric Oxide: Implications for Cytotoxicity and Cytoprotection
Belenichev, I. F., Popazova, O., Bukhtiyarova, N. V., Savchenko, D., Oksenych, V., & Kamyshnyi, O. (2024) · Antioxidants · doi:10.3390/antiox13050504 · Cited by 89
Dutta, S., Saha, S., Mahalanobish, S., Sadhukhan, P., & Sil, P. C. (2018) · Food and Chemical Toxicology · doi:10.1016/j.fct.2018.05.032 · Cited by 79
Farahani, A., Farahani, A., Kashfi, K., & Ghasemi, A. (2025) · Pharmacological Research · doi:10.1016/j.phrs.2025.107781 · Cited by 83
Yang, F., Liao, J., Yu, W., Pei, R., Qiao, N., Han, Q., Hu, L., Li, Y., Guo, J., Pan, J., et al. (2020) · Ecotoxicology and Environmental Safety · doi:10.1016/j.ecoenv.2020.110715 · Cited by 72
Zheng, P., He, J., Fu, Y., Yang, Y., Li, S., Duan, B., Yang, Y., Hu, Y., Yang, Z., Wang, M., et al. (2024) · ACS Nano · doi:10.1021/acsnano.3c06987 · Cited by 71
Kisty, E. A., Falco, J. A., & Weerapana, E. (2023) · Cell chemical biology · doi:10.1016/j.chembiol.2023.02.006 · Cited by 55
Elhefnawy, E. A., Zaki, H. F., Maraghy, N. N. E., Ahmed, K. A., & El-Haleim, E. A. A. (2023) · Biochemical Pharmacology · doi:10.1016/j.bcp.2023.115673 · Cited by 52
Abdel‐Wahab, B. A., Walbi, I. A., Albarqi, H. A., Ali, F. E. M., & Hassanein, E. H. M. (2021) · Food and Chemical Toxicology · doi:10.1016/j.fct.2021.112133 · Cited by 52
Abdel‐Wahab, B. A., Alkahtani, S. A., & Elagab, E. A. M. (2020) · Reproductive Toxicology · doi:10.1016/j.reprotox.2020.06.015 · Cited by 50
Valencia, J. C., Egbukichi, N., & Erwin-Cohen, R. A. (2018) · Journal of Interferon & Cytokine Research · doi:10.1089/jir.2018.0060 · Cited by 51
Immunostimulatory and antioxidant activities of a lignin isolated from Conocarpus erectus leaves
Santos, D. K. D. D. N., Barros, B. R. D. S., Aguiar, L. M. D. S., Filho, I. J. D. C., de Lorena, V. M. B., de Melo, C. M. L., & Napoleão, T. H. (2020) · International Journal of Biological Macromolecules · doi:10.1016/j.ijbiomac.2020.02.052 · Cited by 46
Zhang, X., Ruan, Q., Zhai, Y., Lu, D., Li, C., Fu, Y., Zheng, Z., Song, Y., & Guo, J. (2020) · Cancer Science · doi:10.1111/cas.14577 · Cited by 46
Tao, H., Song, Z., Ding, X., Yang, J., Shi, K., & Li, J. (2018) · Heart Failure Reviews · doi:10.1007/s10741-018-9694-z · Cited by 44
de Sousa, J. R., Vasconcelos, P. F. D. C., & Quaresma, J. A. S. (2019) · Infection and Drug Resistance · doi:10.2147/idr.s208576 · Cited by 48
Zhang, X., Li, G., Guo, Y., Song, Y., Chen, L., Ruan, Q., Wang, Y., Sun, L., Hu, Y., Zhou, J., et al. (2019) · Theranostics · doi:10.7150/thno.32479 · Cited by 43
Zhao, C., Medeiros, T. X., Sové, R. J., Annex, B. H., & Popel, A. S. (2021) · iScience · doi:10.1016/j.isci.2021.102112 · Cited by 43
Targeting SHP2 as a therapeutic strategy for inflammatory diseases
Liu, Y., Yang, X., Wang, Y., Yang, Y., Sun, D., Li, H., & Chen, L. (2021) · European Journal of Medicinal Chemistry · doi:10.1016/j.ejmech.2021.113264 · Cited by 40
Zygner, W., Gójska-Zygner, O., & Norbury, L. J. (2023) · Pathogens · doi:10.3390/pathogens12020166 · Cited by 43
Sahnoun, S., Sellami, A., Chakroun, N. F., Mseddi, M., Attia, H., Rebaï, T., & Lassoued, S. (2017) · Journal of Assisted Reproduction and Genetics · doi:10.1007/s10815-017-0957-8 · Cited by 40
Ding, X., Liang, Y., Peng, W., Li, R., Lin, H., Zhang, Y., & Lu, D. (2017) · Fish & Shellfish Immunology · doi:10.1016/j.fsi.2017.11.042 · Cited by 39
Metabolism and inflammation: implications for traumatic brain injury therapeutics
Killen, M. J., Giorgi-Coll, S., Helmy, A. E., Hutchinson, P. J., & Carpenter, K. L. H. (2019) · Expert Review of Neurotherapeutics · doi:10.1080/14737175.2019.1582332 · Cited by 39
Abdel‐Wahab, B. A., Alkahtani, S. A., Alqahtani, A. A., & Hassanein, E. H. M. (2022) · Environmental Science and Pollution Research · doi:10.1007/s11356-021-18252-1 · Cited by 35
Troy, N. M., Strickland, D. H., Serralha, M., de Jong, E., Jones, A. C., Read, J. F., Galbraith, S., Islam, M. Z., Kaur, P., Mincham, K. T., et al. (2022) · Journal of Allergy and Clinical Immunology · doi:10.1016/j.jaci.2022.01.001 · Cited by 35
Topical therapy for regression and melanoma prevention of congenital giant nevi
Choi, Y. S., Erlich, T. H., von Franque, M., Rachmin, I., Flesher, J. L., Schiferle, E. B., Zhang, Y., da Silva, M. P., Jiang, A. Y., Dobry, A. S., et al. (2022) · Cell · doi:10.1016/j.cell.2022.04.025 · Cited by 35
Kang, S. H., Chung, B. Y., Park, J. E., Jeon, J., & Park, Y. D. (2020) · Talanta · doi:10.1016/j.talanta.2020.121053 · Cited by 34
Plant lectins: A new antimicrobial frontier
Konozy, E. H. E., Osman, M. E. M., Dirar, A. I., & Ghartey‐Kwansah, G. (2022) · Biomedicine & Pharmacotherapy · doi:10.1016/j.biopha.2022.113735 · Cited by 34
Regulation of macrophage subsets and cytokine production in leishmaniasis
Carneiro, M. B. H., Vaz, L. G., Afonso, L., Horta, M. F., & Vieira, L. Q. (2020) · Cytokine · doi:10.1016/j.cyto.2020.155309 · Cited by 30
Lupeol induces immunity and protective efficacy in a murine model against visceral leishmaniasis
Kaur, G., Chauhan, K., & Kaur, S. (2019) · Parasitology · doi:10.1017/s0031182019000659 · Cited by 29
In vitro and in vivo properties of the bovine antimicrobial peptide, Bactenecin 5
Price, R. L., Bugeon, L., Mostowy, S., Makendi, C., Wren, B. W., Williams, H. D., & Willcocks, S. (2019) · PLoS ONE · doi:10.1371/journal.pone.0210508 · Cited by 29
Lima‐Cabello, E., Ramírez, J. D. D. A., Morales, S., Clemente, A., & Jiménez-López, J. C. (2019) · Antioxidants · doi:10.3390/antiox9010012 · Cited by 30
Nitric oxide-based multi-synergistic nanomedicine: an emerging therapeutic for anticancer
Tang, Y., Li, Q., Zhou, Z., Bai, H., Xiao, N., Xie, J., & Li, C. (2024) · Journal of Nanobiotechnology · doi:10.1186/s12951-024-02929-z · Cited by 27
Ferrari, D. P., Bortolanza, M., & Bel, E. A. D. (2021) · Neurotoxicity Research · doi:10.1007/s12640-021-00345-x · Cited by 27
Venkatesan, S., Smirne, C., Aquino, C. I., Surico, D., Remorgida, V., Pour, M. M. O., Pirisi, M., & Grossini, E. (2026) · International Journal of Molecular Sciences · doi:10.3390/ijms27020629 · Cited by 30
Sawoo, R., & Bishayi, B. (2024) · Immunobiology · doi:10.1016/j.imbio.2024.152840 · Cited by 27
Razim, A., Zabłocka, A., Schmid, A. M., Thaler, M., Černý, V., Weinmayer, T., Whitehead, B., Martens, A., Skalska, M., Morandi, M. I., et al. (2024) · Journal of Extracellular Vesicles · doi:10.1002/jev2.70004 · Cited by 25
Sun, P., Kraus, C. N., Zhao, W., Xu, J., Suh, S., Nguyen, Q., Jia, Y. Y., Nair, A., Oakes, M., Tinoco, R., et al. (2025) · Journal of Investigative Dermatology · doi:10.1016/j.jid.2025.08.022 · Cited by 25
Yasukawa, K., Hirago, A., Yamada, K., Tun, X., Ohkuma, K., & Utsumi, H. (2019) · Free Radical Biology and Medicine · doi:10.1016/j.freeradbiomed.2019.03.025 · Cited by 27
Osman, E. O., Khalil, N. A., Magdy, A., & El‐Dash, Y. (2024) · RSC Medicinal Chemistry · doi:10.1039/d4md00135d · Cited by 24
Yadav, S. K., Ito, N., Soin, D., Ito, K., & Dhib-Jalbut, S. S. (2021) · Journal of Clinical Medicine · doi:10.3390/jcm10040857 · Cited by 24
Hotter, G., Mastora, C., Jung, M., Brüne, B., Carbonell, T., Josa‐Laorden, C., Pérez‐Calvo, J. I., Cruzado, J. M., Guiteras, R., & Solà, A. (2020) · Scientific Reports · doi:10.1038/s41598-020-72342-7 · Cited by 23
Diterpenoid alkaloids from Delphinium forrestii var. viride and their anti-inflammation activity
Song, Z., Gao, C., Jiang, Q., Xu, J., Xiong, L., Liu, K., Sun, D., Li, H., & Chen, L. (2021) · Phytochemistry · doi:10.1016/j.phytochem.2021.112971 · Cited by 23
Lima‐Cabello, E., Morales, S., Foley, R. C., Melser, S., Alché, V., Siddique, K. H. M., Singh, K. B., Ramírez, J. D. D. A., & Jiménez-López, J. C. (2017) · Journal of Functional Foods · doi:10.1016/j.jff.2017.11.040 · Cited by 28
Long-term methylglyoxal intake aggravates murine Th2-mediated airway eosinophil infiltration
Medeiros, M. L., de Oliveira, M. G., Tavares, E. B. G., de Mello, G. C., Anhê, G. F., Mónica, F. Z., & Antunes, E. (2020) · International Immunopharmacology · doi:10.1016/j.intimp.2020.106254 · Cited by 22
Seo, H., Seong, H., Kim, G. Y., Jo, Y. M., Cheon, S. W., Song, Y., Ryu, B. H., Kang, H. J., & Han, N. S. (2021) · Frontiers in Microbiology · doi:10.3389/fmicb.2021.760476 · Cited by 21
Inflammation and mitochondria in the pathogenesis of chronic Chagas disease cardiomyopathy
Nunes, J. P. S., Roda, V. M. D. P., Andrieux, P., Kalil, J. E., Chevillard, C., & Cunha‐Neto, E. (2023) · Experimental Biology and Medicine · doi:10.1177/15353702231220658 · Cited by 22
Mahrous, E. A., Elosaily, A. H., Salama, A., Salama, A. M., & El-Zalabani, S. M. H. (2022) · Plants · doi:10.3390/plants11020218 · Cited by 20
Lee, E. K., Koh, E. M., Kim, Y. N., Song, J., Song, C. H., & Jung, K. J. (2022) · Pharmaceutics · doi:10.3390/pharmaceutics14071423 · Cited by 20
Hu, X., Li, Y., Cao, Y., Shi, F., & Li, S. (2024) · Biochimica et Biophysica Acta (BBA) - Reviews on Cancer · doi:10.1016/j.bbcan.2024.189156 · Cited by 20
Wang, G., Zhan, Q., & Wu, H. (2020) · International Immunopharmacology · doi:10.1016/j.intimp.2020.107040 · Cited by 20
Sharma, J. R., & Yadav, U. C. S. (2021) · Obesity Research & Clinical Practice · doi:10.1016/j.orcp.2021.01.004 · Cited by 21
Streyczek, J., Apweiler, M., Sun, L., & Fiebich, B. L. (2022) · Molecules · doi:10.3390/molecules27030784 · Cited by 20
Moen, G.-H., Moen, A., Schistad, E. I., & Gjerstad, J. (2017) · Cytokine · doi:10.1016/j.cyto.2017.06.005 · Cited by 20
André, D. M., Horimoto, C. M., Calixto, M. C., Alexandre, E. C., & Antunes, E. (2018) · International Immunopharmacology · doi:10.1016/j.intimp.2018.06.028 · Cited by 20
Biochemical Strategies to Counter Nitrosative Stress
Alhasawi, A. A., Legendre, F., Jagadeesan, S., Appanna, V. P., & Appanna, V. D. (2018) · Elsevier eBooks · doi:10.1016/b978-0-12-814849-5.00010-1 · Cited by 19
Neutrophil S100A9 supports M2 macrophage niche formation in granulomas
Mizutani, T., Ano, T., Yoshioka, Y., Mizuta, S., Takemoto, K., Ouchi, Y., Morita, D., Kitano, S., Miyachi, H., Tsuruyama, T., et al. (2023) · iScience · doi:10.1016/j.isci.2023.106081 · Cited by 19
IFN-γ Mediated Signaling Improves Fungal Clearance in Experimental Pulmonary Mucormycosis
dos Santos, A. R., Fraga‐Silva, T. F. D. C., Donanzam, D. D. F. A., dos Santos, R. F., Finato, A. C., Soares, C. T., Lara, V. S., Almeida, N. L. M., Andrade, M. I., de Arruda, O. S., et al. (2021) · Mycopathologia · doi:10.1007/s11046-021-00598-2 · Cited by 18
Bioenergetic Heterogeneity in Mycobacterium tuberculosis Residing in Different Subcellular Niches
Akela, A. K., & Kumar, A. (2021) · mBio · doi:10.1128/mbio.01088-21 · Cited by 18
Kotb, M. A., Kotb, A., Talaat, S. M., Shehata, S. M. K., Dessouki, N. E., Elhaddad, A., Tagy, G. E., Esmat, H., Shehata, S., Hashim, M., et al. (2022) · Medicine · doi:10.1097/md.0000000000030368 · Cited by 17
Cho, H. Y., Lee, J., Lee, J. H., Ahn, D. U., & Paik, H. (2023) · Journal of Functional Foods · doi:10.1016/j.jff.2023.105487 · Cited by 17
Nitric oxide in the cardio-cerebrovascular system: Source, regulation and application
Fu, X., Lu, H., Gao, M., Li, P., He, Y., He, Y., Luo, X., Rao, X.-Y., & Liu, W. (2024) · Nitric Oxide · doi:10.1016/j.niox.2024.09.005 · Cited by 17
The protective effects of wine pomace products on the vascular endothelial barrier function
Gerardi, G., Cavia-Sáiz, M., Rivero-Perez, M. D., José, M., & Múñiz, P. (2020) · Food & Function · doi:10.1039/d0fo01199a · Cited by 18
Pinello, N., Song, R., Lee, Q., Calonne, E., Duan, K., Wong, E., Tieng, J., Mehravar, M., Rong, B., Lan, F., et al. (2024) · Cellular and Molecular Life Sciences · doi:10.1007/s00018-024-05261-9 · Cited by 16
Ent-kauranes and ent-atisanes from Euphorbia wallichii and their anti-inflammatory activity
Wang, Y., Jiang, Q., Sun, D., Zhang, N., Lin, Y., Li, H., & Chen, L. (2023) · Phytochemistry · doi:10.1016/j.phytochem.2023.113643 · Cited by 15
dos Reis, A. S., Vogt, A. G., Pinz, M. P., Voss, G. T., da Fonseca, C. A. R., Paltian, J. J., Peglow, T. J., Vaucher, R. D. A., Echenique, J. V. Z., Soares, M. P., et al. (2019) · Chemico-Biological Interactions · doi:10.1016/j.cbi.2019.108790 · Cited by 15
Ruan, D., Deng, S., Liu, Z., & He, J. (2021) · BioMed Research International · doi:10.1155/2021/6698366 · Cited by 15
RetractedTanikawa, T., Kitamura, M., Hayashi, Y., Tomida, N., Uwaya, A., Isami, F., & Inoue, Y. (2021) · Medicines · doi:10.3390/medicines8080043 · Cited by 16
van Schaik, E. J., Fratzke, A. P., Gregory, A. E., Dumaine, J. E., & Samuel, J. E. (2024) · Frontiers in Cellular and Infection Microbiology · doi:10.3389/fcimb.2024.1282183 · Cited by 15
El-Sayed, A., Sallam, A. M., & Abousoliman, I. (2024) · BMC Veterinary Research · doi:10.1186/s12917-024-04018-7 · Cited by 14
Mairal, A., Mehrotra, S., Kumar, A., Maiwal, R., Marsal, J., & Kumar, A. (2024) · ACS Applied Materials & Interfaces · doi:10.1021/acsami.3c14113 · Cited by 13
Proton pump inhibitor effect on macrophage and neutrophil function: a systematic review
Fowler, J. F., Eubank, T. A., & Garey, K. W. (2024) · Frontiers in Immunology · doi:10.3389/fimmu.2024.1477993 · Cited by 13
Assessment of the Number and Phenotype of Macrophages in the Human BMB Samples of CML
Jian-xin, S., Dian, Z.-J., Wen, Y., Mei, F., Li, R.-W., & Sa, Y.-L. (2016) · BioMed Research International · doi:10.1155/2016/8086398 · Cited by 13
ICT-based fluorescent ratiometric probe for monitoring mitochondrial peroxynitrite in living cells
Du, Y., Wang, H., Zhang, T., Wei, W. Y., & Guo, M. (2021) · New Journal of Chemistry · doi:10.1039/d1nj01713f · Cited by 13
Tun, X., Yasukawa, K., & Yamada, K. (2018) · Biological and Pharmaceutical Bulletin · doi:10.1248/bpb.b18-00558 · Cited by 13
Investigating the comorbidity of COPD and tuberculosis, a computational study
Sershen, C. L., Salim, T., & May, E. E. (2023) · Frontiers in Systems Biology · doi:10.3389/fsysb.2023.940097 · Cited by 13
Self-citationModeling Skin Inflammation Using Human In Vitro Models
Boarder, E., Rumberger, B., & Howell, M. D. (2021) · Current Protocols · doi:10.1002/cpz1.72 · Cited by 12
CTRP9 induces iNOS expression through JAK2/STAT3 pathway in Raw 264.7 and peritoneal macrophages
Chen, J., Lei, S., Li, T., Li, J., Zuo, A., Xu, D., Song, C., & Guo, Y. L. (2019) · Biochemical and Biophysical Research Communications · doi:10.1016/j.bbrc.2019.12.008 · Cited by 11
Hu, R., Chantana, W., Pitchakarn, P., Subhawa, S., Chantarasuwan, B., Temviriyanukul, P., & Chewonarin, T. (2022) · Cancers · doi:10.3390/cancers14112665 · Cited by 11
Genomic instabilities in hepatocellular carcinoma: biomarkers and application in immunotherapies
Hung, J., Teng, C.-F., Hung, H.-C., Chen, Y., Chen, P.-J., Ho, C., Chuang, C.-H., & Huang, W. (2024) · Annals of Hepatology · doi:10.1016/j.aohep.2024.101546 · Cited by 10
Magryś, A., Deryło, K., Bogut, A., Olender, A., & Tchórzewski, M. (2018) · PLoS ONE · doi:10.1371/journal.pone.0207312 · Cited by 11
Rukmana, A., Supardi, L. A., Sjatha, F., & Nurfadilah, M. (2022) · Genes · doi:10.3390/genes13111954 · Cited by 10
Isolation of mouse mammary carcinoma-derived macrophages and cancer cells for co-culture assays
Sun, L., Han, X., & Egeblad, M. (2022) · STAR Protocols · doi:10.1016/j.xpro.2022.101833 · Cited by 10
Latif, M., & May, E. E. (2018) · Bulletin of Mathematical Biology · doi:10.1007/s11538-018-0494-3 · Cited by 10
Self-citationKim, H. J., Lee, J., Kim, S., Seo, J. Y., Hong, S. B., & Park, Y. I. (2020) · Journal of Food Biochemistry · doi:10.1111/jfbc.13215 · Cited by 10
Dobréva, A., Brady‐Nicholls, R., Larripa, K., Puelz, C., Mehlsen, J., & Olufsen, M. S. (2021) · The Journal of Physiology · doi:10.1113/jp280883 · Cited by 10
Pimentel, P. M. D. O., de Assis, D. R. R., Gualdrón‐López, M., Barroso, A., Brant, F., Leite, P. G., Oliveira, B. C. D. L., Esper, L., McKinnie, S. M. K., Vederas, J. C., et al. (2021) · Clinical Immunology · doi:10.1016/j.clim.2021.108713 · Cited by 10
Immune Subtyping in Latent Tuberculosis
Banerjee, U., Baloni, P., Singh, A., & Chandra, N. R. (2021) · Frontiers in Immunology · doi:10.3389/fimmu.2021.595746 · Cited by 10
Hunter, E., Koutsothanasi, C., Wilson, A. J., Santos, F. C., Salter, M., Powell, R., Dring, A. M., Brajer, P., Egan, B., Westra, J. W., et al. (2021) · bioRxiv (Cold Spring Harbor Laboratory) · doi:10.1101/2021.03.14.435295 · Cited by 10
Liu, Z., Li, X., Li, W., Cai, M., Yan, J., Zang, C., Cai, R., Gao, Y., & Qi, Y. (2023) · Journal of Functional Foods · doi:10.1016/j.jff.2023.105505 · Cited by 9
Metadata
- Authors
- Salim, T., Sershen, C. L., & May, E. E.
- Affiliations
- University of Houston (US)
- Corresponding author
- May, Elebeoba E.
- Venue
- PLOS ONE
- Publisher
- Public Library of Science (PLoS)
- Published
- 2016-06-08
- Volume
- 11
- Issue
- 6
- Pages
- e0153289
- ISSN
- 1932-6203 (ISSN-L)
- PMC
- PMC4898755
- OpenAlex
- W2415587673
- Cited by
- 210
- References
- 94
- Citations by year
- 2026: 22 · 2025: 24 · 2024: 29 · 2023: 22 · 2022: 26 · 2021: 31 · 2020: 26 · 2019: 14 · 2018: 10 · 2017: 5 · 2016: 1
- FWCI
- 6.05
- Type
- journal article
- Language
- en
- Open access
- gold
- doi.org
- Licence
- Locations
- PLoS ONE (publishedVersion, cc-by)
- Europe PMC (PubMed Central) (publishedVersion, cc-by)
- PubMed Central (publishedVersion, cc-by)
- PubMed (publishedVersion)
- OSTI OAI (U.S. Department of Energy Office of Scientific and Technical Information) (submittedVersion)
- DOAJ (DOAJ: Directory of Open Access Journals) (submittedVersion)
- Figshare (submittedVersion, cc-by)
- Funders
- Defense Threat Reduction Agency (FA8650-10-2-6062 subaward #2381 (Henry M. Jackson Foundation))
- Sandia National Laboratories, National Nuclear Security Administration (LDRD 151348)
- Topics
- Life Sciences › Immunology and Microbiology › Immunology › Immune Response and Inflammation
- Life Sciences › Immunology and Microbiology › Immunology › interferon and immune responses
- Life Sciences › Biochemistry, Genetics and Molecular Biology › Molecular Biology › Gene Regulatory Network Analysis
- Keywords
- inducible nitric oxide synthase, iNOS expression, macrophages, lipopolysaccharide stimulation, interferon-gamma, TNF-α, nitric oxide production, IRF1, cytokine priming, intracellular pathogens, reactive nitrogen species, systems biology models, pro-inflammatory response
- MeSH terms
- Humans, Interferon-gamma, Lipopolysaccharides, Macrophages, Nitric Oxide, Tumor Necrosis Factor-alpha, Gene Expression Regulation, Enzymologic, Models, Immunological, Nitric Oxide Synthase Type II
About these checks
Registry, retraction, Cites and statistics results are computed, not judged, with one exception: a printed reference that no index lists is read once by a model before it counts as a citation error. Claims are extracted by a model and kept only when their quote appears verbatim in the text; each cited source is then checked, with a model’s help, for whether it says what the claim relies on. Those verdicts can be wrong — read the claim’s quote and the cited source before relying on one.
Statistics and arithmetic are recomputed, not judged.
Confidence bands are shown only for fields calibrated on our annotated test set. None is calibrated yet, so no band is shown.
What counts as a claim ›How we measure confidence ›How we check this ›
Are you an author, or do you see a problem with this page? Request a review
