Cited by 11

The DOI matches its Crossref record; 1 of the 1 references it cites were found in a registry or an index.

Estimating Exceptionally Rare Germline and Somatic Mutation Frequencies via Next Generation Sequencing

Eboreime, Jordan, Choi, Soo-Kung, Yoon, Song-Ro, Arnheim, Norman, Calabrese, Peter·2016·PLOS ONE

Overview

The claims and statistics of this paper haven’t been checked yet.

Run the check — free, no account needed. It reads the open-access text and checks the sources it cites.

A few free checks a day · papers already verified open instantly · results are public

Integrity signals

Registry

Crossref · 10.1371/journal.pone.0158340

Cites

1 of 1 references verified0 citation errors · 0 not checkable

Statistics

Figures

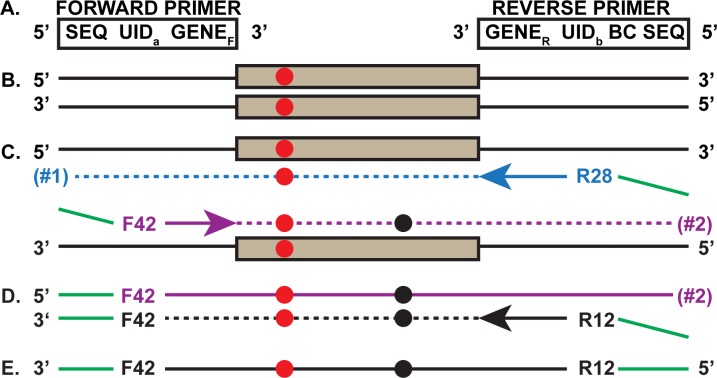
Fig 1 First PCR Round of the SSS strategy. a. Two primers (forward and reverse) are used for the first two SSS PCR cycles (all primers are listed in S1 Fig). Each primer (5’ to 3’) contains a Sequencing primer region (SEQ), a Unique Identifier (UID) and the forward (GENEF) or reverse (GENER) versions of the gene specific DNA sequences. Only the reverse primer contains a barcode for multiplex analysis (BC). b. Duplex genomic DNA fragment carrying a gene target that experienced an in vivo germline mutation (red circle). c. The two new daughter strands of the first denaturation, primer hybridization and primer extension. The F42 and R28 represent one of the many UIDs on the forward and reverse primers, respectively. The blue arrow indicates the direction of the reverse primer extension that includes the specific target region (blue dashes) and extends through the target as does the purple forward primer on the other strand (purple dashes). The green overhang at the extreme 5’ ends will anneal to the primers used in the second PCR round. Two different extension products are created (#1 and #2). Notice that extension product #2, with the already existing in vivo mutation is (for convenience only) also shown to experience a new in vitro mutation (black circle). In the subsequent steps, for simplicity, we only follow one of the two extension products (#2). d. The second cycle with the same primer mix, invariably involves a primer (black) with a different UID (R12) and copies DNA strand #2 (black dashes). Subsequent single strand-specific exonuclease digestion removes all the initial PCR primers, trims the 3’ DNA overhangs from the second cycle primer extension products and any remaining single-stranded genomic DNA. e. Importantly, F42-R12 is tagged by different UIDs at each end and is then subjected to the second round of PCR (see Fig 2).
Fig 1 First PCR Round of the SSS strategy. a. Two primers (forward and reverse) are used for the first two SSS PCR cycles (all primers are listed in S1 Fig). Each primer (5’ to 3’) contains a Sequencing primer region (SEQ), a Unique Identifier (UID) and the forward (GENEF) or reverse (GENER) versions of the gene specific DNA sequences. Only the reverse primer contains a barcode for multiplex analysis (BC). b. Duplex genomic DNA fragment carrying a gene target that experienced an in vivo germline mutation (red circle). c. The two new daughter strands of the first denaturation, primer hybridization and primer extension. The F42 and R28 represent one of the many UIDs on the forward and reverse primers, respectively. The blue arrow indicates the direction of the reverse primer extension that includes the specific target region (blue dashes) and extends through the target as does the purple forward primer on the other strand (purple dashes). The green overhang at the extreme 5’ ends will anneal to the primers used in the second PCR round. Two different extension products are created (#1 and #2). Notice that extension product #2, with the already existing in vivo mutation is (for convenience only) also shown to experience a new in vitro mutation (black circle). In the subsequent steps, for simplicity, we only follow one of the two extension products (#2). d. The second cycle with the same primer mix, invariably involves a primer (black) with a different UID (R12) and copies DNA strand #2 (black dashes). Subsequent single strand-specific exonuclease digestion removes all the initial PCR primers, trims the 3’ DNA overhangs from the second cycle primer extension products and any remaining single-stranded genomic DNA. e. Importantly, F42-R12 is tagged by different UIDs at each end and is then subjected to the second round of PCR (see Fig 2).CC BY · PubMed Central
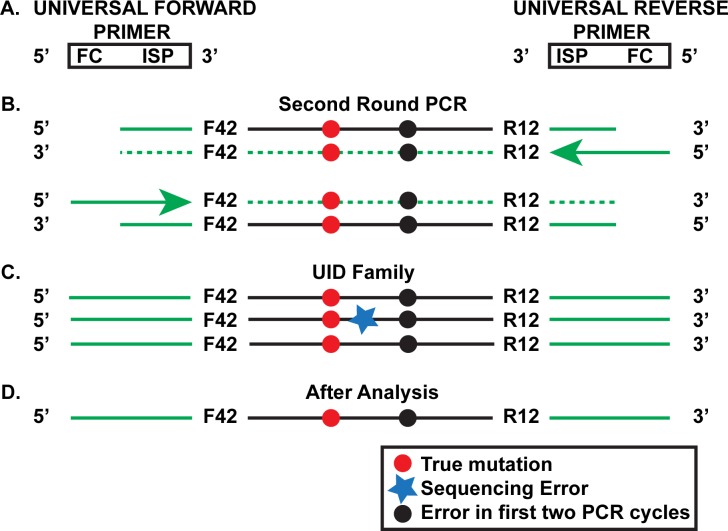
Fig 2 Second Round of the SSS Strategy. a. Universal forward and reverse primers are used to amplify the product made in the first round of PCR (see Fig 1E). The primers contain the Illumina Sequencing primer (ISP), which is partially complementary to the Sequencing primer region of the primers used in the first two PCR cycles (Fig 1A). The universal primers also contain the complement of the Flow cell grafting sequence (FC). b. Products of the first few cycles of the second round using the template shown in Fig 1E. c. Further amplification for 28–30 additional cycles leads to the creation of UID families of which the one shown is representative. The original genomic mutation and the mutation that arose during the first two SSS PCR cycles are both present in this particular family. Notice that one of the family members has accumulated an additional in vitro mutation (black star) due to events during the second PCR round or the final sequencing step. d. Analysis of the UID family is able to eliminate the latter error from consideration.
Fig 2 Second Round of the SSS Strategy. a. Universal forward and reverse primers are used to amplify the product made in the first round of PCR (see Fig 1E). The primers contain the Illumina Sequencing primer (ISP), which is partially complementary to the Sequencing primer region of the primers used in the first two PCR cycles (Fig 1A). The universal primers also contain the complement of the Flow cell grafting sequence (FC). b. Products of the first few cycles of the second round using the template shown in Fig 1E. c. Further amplification for 28–30 additional cycles leads to the creation of UID families of which the one shown is representative. The original genomic mutation and the mutation that arose during the first two SSS PCR cycles are both present in this particular family. Notice that one of the family members has accumulated an additional in vitro mutation (black star) due to events during the second PCR round or the final sequencing step. d. Analysis of the UID family is able to eliminate the latter error from consideration.CC BY · PubMed Central
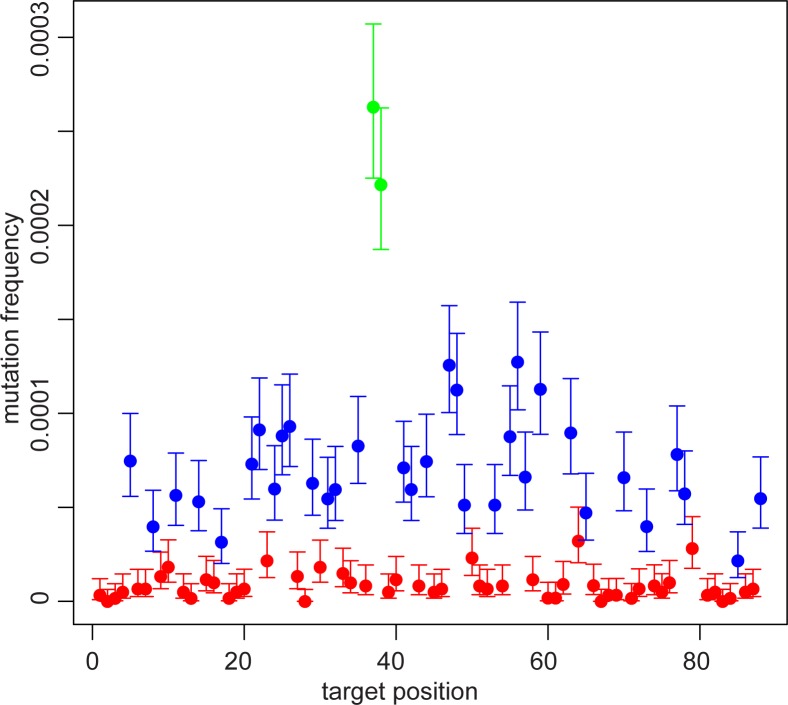
Fig 3 PTPN11 mutation frequencies color-coded by reference base. Each dot represents the average of 9 different libraries from three testis pieces. Red indicates an A or T base, blue indicates a C or G (non-CpG) base, and green indicates a CpG. The mutation frequency is the sum of all mutations at that site, so, e.g., if a site is a C, the mutation frequency is the sum of the C>A, C>G, and C>T frequencies at that site. The 95% confidence interval for each position is also shown. The data on one base pair (at position 80; c.922) has not been included since it has a much greater mutation frequency; for an explanation, see below.
Fig 3 PTPN11 mutation frequencies color-coded by reference base. Each dot represents the average of 9 different libraries from three testis pieces. Red indicates an A or T base, blue indicates a C or G (non-CpG) base, and green indicates a CpG. The mutation frequency is the sum of all mutations at that site, so, e.g., if a site is a C, the mutation frequency is the sum of the C>A, C>G, and C>T frequencies at that site. The 95% confidence interval for each position is also shown. The data on one base pair (at position 80; c.922) has not been included since it has a much greater mutation frequency; for an explanation, see below.CC BY · PubMed Central
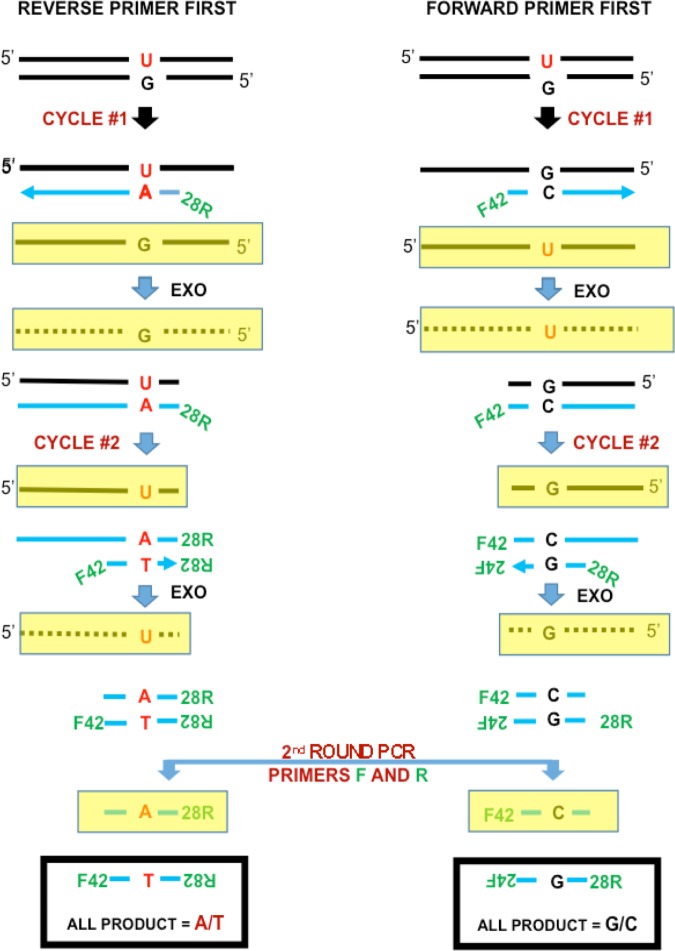
Fig 4 Separate method and pre-existing mismatches. The Separate method separately amplifies the coding and non-coding strands. The aliquot on the left-hand side only amplifies the top strand, while the aliquot on the right-hand side only amplifies the bottom strand. The yellow rectangles indicate strands that are not primer extension products and are removed by exonucleases. For the original molecule shown with a pre-existing U:G mismatch, the Separate method detects a C>T mutation on the left-hand side and no mutation on the right-hand side.
Fig 4 Separate method and pre-existing mismatches. The Separate method separately amplifies the coding and non-coding strands. The aliquot on the left-hand side only amplifies the top strand, while the aliquot on the right-hand side only amplifies the bottom strand. The yellow rectangles indicate strands that are not primer extension products and are removed by exonucleases. For the original molecule shown with a pre-existing U:G mismatch, the Separate method detects a C>T mutation on the left-hand side and no mutation on the right-hand side.CC BY · PubMed Central
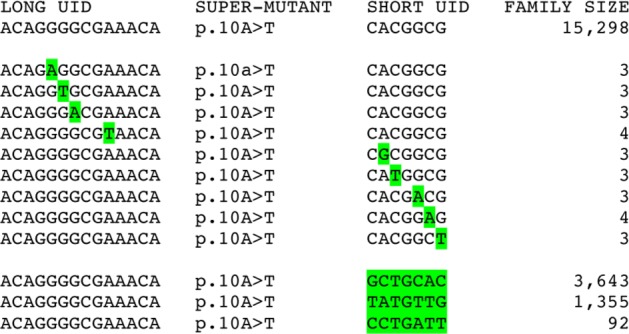
Fig 5 Spurious super-mutants due to very large UID families. One very large UID family on the top row is erroneously counted as twelve additional families. The next nine rows show families with UID sequences that differ at one site from the family in the top row, most likely due to a mistake during PCR amplification. The bottom three rows show families with the same long UID sequence but a different short UID sequence from the family in the top row, most likely due to PCR jumping. All of these families contain the same A>T/T>A super-mutant at the read position 10 bases from the end of the UID (p.10A>T) erroneously increasing its frequency.
Fig 5 Spurious super-mutants due to very large UID families. One very large UID family on the top row is erroneously counted as twelve additional families. The next nine rows show families with UID sequences that differ at one site from the family in the top row, most likely due to a mistake during PCR amplification. The bottom three rows show families with the same long UID sequence but a different short UID sequence from the family in the top row, most likely due to PCR jumping. All of these families contain the same A>T/T>A super-mutant at the read position 10 bases from the end of the UID (p.10A>T) erroneously increasing its frequency.CC BY · PubMed Central

Verification

Claims the paper makes

The claims and statistics of this paper haven’t been checked yet.

Run the check — free, no account needed. It reads the open-access text and checks the sources it cites.

A few free checks a day · papers already verified open instantly · results are public

Claims other papers make about this one

Each is checked against this paper’s own text: does it say what the citing paper says it does?

Self-check

Percentages, sums and reported differences re-computed from the paper’s own numbers.

The self-check needs the paper’s full text.

Citations

Cites

Research works printed but not linked: 25

  1. I Kinde, 2011, Detection and quantification of rare mutations with massively parallel sequencing, Proc Natl Acad Sci U S A, 108, 9530, 10.1073/pnas.1105422108 · DOI · Paper page
  2. L Segurel, 2014, Determinants of mutation rate variation in the human germline, Annu Rev Genomics Hum Genet, 15, 47, 10.1146/annurev-genom-031714-125740 · DOI · Paper page
  3. D Laehnemann, 2016, Denoising DNA deep sequencing data—high-throughput sequencing errors and their correction, Briefings in Bioinformatics, 17, 154, 10.1093/bib/bbv029 · DOI
  4. H Chen-Harris, 2013, Ultra-deep mutant spectrum profiling: improving sequencing accuracy using overlapping read pairs, BMC Genomics, 14, 96, 10.1186/1471-2164-14-96 · DOI
  5. Q Liu, 2000, Pyrophosphorolysis-activated polymerization (PAP): application to allele-specific amplification, Biotechniques, 29, 1072, 10.2144/00295rr03 · DOI
  6. J Qin, 2007, The molecular anatomy of spontaneous germline mutations in human testes, PLoS Biol, 5, e224, 10.1371/journal.pbio.0050224 · DOI
  7. SR Yoon, 2013, Age-dependent germline mosaicism of the most common noonan syndrome mutation shows the signature of germline selection, Am J Hum Genet, 92, 917, 10.1016/j.ajhg.2013.05.001 · DOI
  8. DI Lou, 2013, High-throughput DNA sequencing errors are reduced by orders of magnitude using circle sequencing, Proc Natl Acad Sci U S A, 110, 19872, 10.1073/pnas.1319590110 · DOI
  9. M Slatkin, 1991, Pairwise comparisons of mitochondrial DNA sequences in stable and exponentially growing populations, Genetics, 129, 555, 10.1093/genetics/129.2.555 · DOI
  10. MW Schmitt, 2012, Detection of ultra-rare mutations by next-generation sequencing, Proc Natl Acad Sci U S A, 109, 14508, 10.1073/pnas.1208715109 · DOI · Paper page
  11. JB Hiatt, 2013, Single molecule molecular inversion probes for targeted, high-accuracy detection of low-frequency variation, Genome Res, 23, 843, 10.1101/gr.147686.112 · DOI
  12. VI Bruskov, 2002, Heat-induced formation of reactive oxygen species and 8-oxoguanine, a biomarker of damage to DNA, Nucleic Acids Research, 30, 1354, 10.1093/nar/30.6.1354 · DOI
  13. M Costello, 2013, Discovery and characterization of artifactual mutations in deep coverage targeted capture sequencing data due to oxidative DNA damage during sample preparation, Nucleic Acids Res, 41, e67, 10.1093/nar/gks1443 · DOI
  14. EH Turner, 2009, Massively parallel exon capture and library-free resequencing across 16 genomes, Nat Methods, 6, 315, 10.1038/nmeth.f.248 · DOI
  15. E Giannoulatou, 2013, Contributions of intrinsic mutation rate and selfish selection to levels of de novo HRAS mutations in the paternal germline, Proc Natl Acad Sci U S A, 110, 20152, 10.1073/pnas.1311381110 · DOI
  16. MW Schmitt, 2015, Sequencing small genomic targets with high efficiency and extreme accuracy, Nat Methods, 12, 423, 10.1038/nmeth.3351 · DOI
  17. SK Choi, 2012, Positive selection for new disease mutations in the human germline: evidence from the heritable cancer syndrome multiple endocrine neoplasia type 2B, PLoS Genet, 8, e1002420, 10.1371/journal.pgen.1002420 · DOI
  18. IM Campbell, 2014, Parental somatic mosaicism is underrecognized and influences recurrence risk of genomic disorders, Am J Hum Genet, 95, 173, 10.1016/j.ajhg.2014.07.003 · DOI
  19. C Bettegowda, 2014, Detection of circulating tumor DNA in early- and late-stage human malignancies, Sci Transl Med, 6, 224ra24, 10.1126/scitranslmed.3007094 · DOI · Paper page
  20. SJ Dawson, 2013, Analysis of circulating tumor DNA to monitor metastatic breast cancer, N Engl J Med, 368, 1199, 10.1056/NEJMoa1213261 · DOI · Paper page
  21. DA Haber, 2014, Blood-based analyses of cancer: circulating tumor cells and circulating tumor DNA, Cancer Discov, 4, 650, 10.1158/2159-8290.CD-13-1014 · DOI
  22. I Kinde, 2013, TERT promoter mutations occur early in urothelial neoplasia and are biomarkers of early disease and disease recurrence in urine, Cancer Res, 73, 7162, 10.1158/0008-5472.CAN-13-2498 · DOI · Paper page
  23. LQ Al-Mawsawi, 2014, High-throughput profiling of point mutations across the HIV-1 genome, Retrovirology, 11, 124, 10.1186/s12977-014-0124-6 · DOI
  24. CB Jabara, 2011, Accurate sampling and deep sequencing of the HIV-1 protease gene using a Primer ID, Proceedings of the National Academy of Sciences, 108, 20166, 10.1073/pnas.1110064108 · DOI
  25. Y Zhengwei, 1998, Stereological evaluation of human spermatogenesis after suppression by testosterone treatment: heterogeneous pattern of spermatogenic impairment, J Clin Endocrinol Metab, 83, 1284

Cited by

Sorted by citations

See all 11

Metadata

Authors
Eboreime, J., Choi, S.-K., Yoon, S.-R., Arnheim, N., & Calabrese, P.
Venue
PLOS ONE
Published
2016-06-24
Volume
11
Issue
6
Pages
e0158340
ISSN
1932-6203
Cited by
11
References
1
Language
en
Funders
National Institute of General Medical Sciences (RO1 GM-36745)

About these checks

Registry, retraction, Cites and statistics results are computed, not judged, with one exception: a printed reference that no index lists is read once by a model before it counts as a citation error. Claims are extracted by a model and kept only when their quote appears verbatim in the text; each cited source is then checked, with a model’s help, for whether it says what the claim relies on. Those verdicts can be wrong — read the claim’s quote and the cited source before relying on one.

Statistics and arithmetic are recomputed, not judged.

Confidence bands are shown only for fields calibrated on our annotated test set. None is calibrated yet, so no band is shown.

What counts as a claim ›How we measure confidence ›How we check this ›

Are you an author, or do you see a problem with this page? Request a review