Cited by 18

The DOI matches its Crossref record; 2 of the 2 references it cites were found in a registry or an index.

The apoptotic effect of 1’S-1’-Acetoxychavicol Acetate (ACA) enhanced by inhibition of non-canonical autophagy in human non-small cell lung cancer cells

Sok, Sophia P. M., Arshad, Norhafiza M., Azmi, Mohamad Nurul, Awang, Khalijah, Ozpolat, Bulent, Hasima Nagoor, Noor·2017·PLOS ONE

Overview

The claims and statistics of this paper haven’t been checked yet.

Run the check — free, no account needed. It reads the open-access text and checks the sources it cites.

A few free checks a day · papers already verified open instantly · results are public

Integrity signals

Registry

Crossref · 10.1371/journal.pone.0171329

Cites

2 of 2 references verified0 citation errors · 0 not checkable

Statistics

Figures

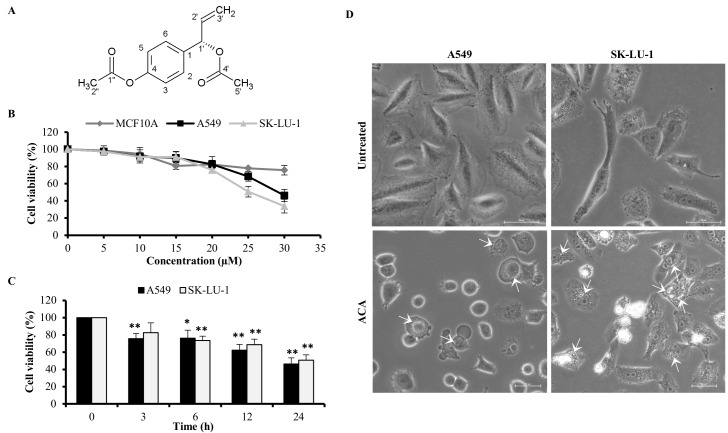
Fig 1 ACA inhibited cell viability of A549 and SK-LU-1 cell lines. (A) Chemical structure of 1’S-1’-acetoxychavicol acetate (ACA). (B) The cell viability of MCF 10A, A549 and SK-LU-1 cells lines after exposure to ACA (0–30 μM) for 24 h was assessed using MTT assay. Data represented as mean percentage of cell viability ± SD for three independent experiments. (C) The cell viability of A549 and SK-LU-1 cells lines after exposure to IC50 of ACA (25 μM for SK-LU-1 and 30 μM for A549 cells) on respective cell lines for 0–24 h was assessed using MTT assay. Data represented as mean percentage of cell viability ± SD for three independent experiments. * p < 0.05 and ** p < 0.01 statistically different in comparison to 0 h (D) Representative photomicrograph (200 × magnification) of A549 and SK-LU-1 cell lines upon ACA treatment. Arrow indicates the cytoplasmic vacuole.
Fig 1 ACA inhibited cell viability of A549 and SK-LU-1 cell lines. (A) Chemical structure of 1’S-1’-acetoxychavicol acetate (ACA). (B) The cell viability of MCF 10A, A549 and SK-LU-1 cells lines after exposure to ACA (0–30 μM) for 24 h was assessed using MTT assay. Data represented as mean percentage of cell viability ± SD for three independent experiments. (C) The cell viability of A549 and SK-LU-1 cells lines after exposure to IC50 of ACA (25 μM for SK-LU-1 and 30 μM for A549 cells) on respective cell lines for 0–24 h was assessed using MTT assay. Data represented as mean percentage of cell viability ± SD for three independent experiments. * p < 0.05 and ** p < 0.01 statistically different in comparison to 0 h (D) Representative photomicrograph (200 × magnification) of A549 and SK-LU-1 cell lines upon ACA treatment. Arrow indicates the cytoplasmic vacuole.CC0 · PubMed Central
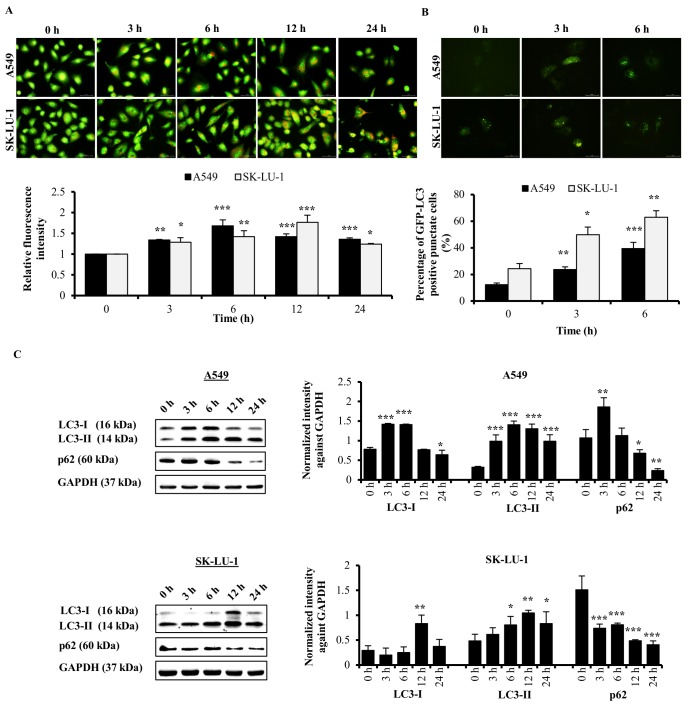
Fig 2 Autophagy effect of ACA on A549 and SK-LU-1 cell lines. (A) Representative fluorescence photomicrograph (400 × magnification) illustrating the acidic vesicular organelles in A549 and SK-LU-1 cell lines after treated with ACA for 0, 3, 6, 12, and 24 h. Data were presented as relative fluorescence intensity in comparison to untreated cells ± SD. * p < 0.05, ** p < 0.01, and *** p < 0.001 statistically different in comparison to untreated. (B) Representative fluorescence photomicrograph (400 × magnification) illustrating the GFP-LC3-II punctate formation in A549 and SK-LU-1 cell lines upon exposure to ACA. Data were represented as mean percentage of cells with GFP-LC3-II punctate ± SD of three independent experiments. * p < 0.05, ** p < 0.01, and *** p < 0.001 statistically different in comparison to untreated. (C) Protein expression of LC3-I/II and p62 after ACA treatment in A549 and SK-LU-1 cell lines. Data were represented as mean normalized intensity ± SD of three independent experiments. * p < 0.05, ** p < 0.01, and *** p < 0.001 statistically different in comparison to untreated.
Fig 2 Autophagy effect of ACA on A549 and SK-LU-1 cell lines. (A) Representative fluorescence photomicrograph (400 × magnification) illustrating the acidic vesicular organelles in A549 and SK-LU-1 cell lines after treated with ACA for 0, 3, 6, 12, and 24 h. Data were presented as relative fluorescence intensity in comparison to untreated cells ± SD. * p < 0.05, ** p < 0.01, and *** p < 0.001 statistically different in comparison to untreated. (B) Representative fluorescence photomicrograph (400 × magnification) illustrating the GFP-LC3-II punctate formation in A549 and SK-LU-1 cell lines upon exposure to ACA. Data were represented as mean percentage of cells with GFP-LC3-II punctate ± SD of three independent experiments. * p < 0.05, ** p < 0.01, and *** p < 0.001 statistically different in comparison to untreated. (C) Protein expression of LC3-I/II and p62 after ACA treatment in A549 and SK-LU-1 cell lines. Data were represented as mean normalized intensity ± SD of three independent experiments. * p < 0.05, ** p < 0.01, and *** p < 0.001 statistically different in comparison to untreated.CC0 · PubMed Central
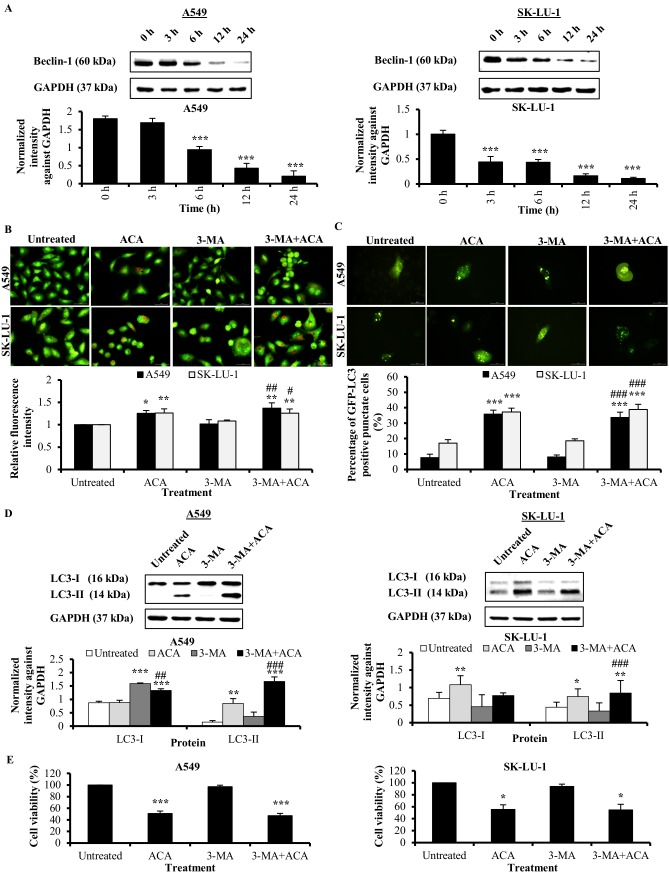
Fig 3 ACA-induced autophagy is independent of Beclin-1/PI3K complex in A549 and SK-LU-1 cell lines. (A) Protein expression of Beclin-1 after ACA treatment in A549 and SK-LU-1 cell lines. Data were represented as mean normalized intensity against GAPDH ± SD. *** p < 0.001 statistically different in comparison to untreated. (B) Representative fluorescence photomicrograph (400 × magnification) illustrating the acidic vesicular organelles in A549 and SK-LU-1 cell lines after treatment with ACA in presence or absence of 3-MA. Data were presented as relative fluorescence intensity in comparison to untreated cells ± SD of three independent experiments * p < 0.05 and ** p < 0.01 statistically different in comparison to untreated. # p < 0.05 and ## p < 0.01 statistically different in comparison to 3-MA. (C) Representative fluorescence photomicrograph (400 × magnification) illustrating the GFP-LC3-II punctate formation in A549 and SK-LU-1 cell lines upon exposure to co-treatment of 3-MA and ACA. Data were represented as mean percentage of cells with GFP-LC3-II punctate ± SD of three independent experiments. *** p < 0.001 statistically different in comparison to untreated. ### p < 0.001 statistically different in comparison to 3-MA. (D) Effect of 3-MA on LC3-I/LC3-II protein expression after pre-treatment of 3-MA prior to ACA treatment in A549 and SK-LU-1 cell lines. Data were represented as normalized intensity ± SD of three independent experiments. * p < 0.05, ** p < 0.01 and *** p < 0.001 statistically different in comparison to untreated. ## p < 0.01 and ### p < 0.001 statistically different in comparison to 3-MA. (E) Effect of 3-MA on the cell viability of ACA-treated A549 and SK-LU-1 cell lines. Data represented as mean percentage of cell viability ± SD for three independent experiments. * p < 0.05 and *** p < 0.001 statistically different in comparison to untreated.
Fig 3 ACA-induced autophagy is independent of Beclin-1/PI3K complex in A549 and SK-LU-1 cell lines. (A) Protein expression of Beclin-1 after ACA treatment in A549 and SK-LU-1 cell lines. Data were represented as mean normalized intensity against GAPDH ± SD. *** p < 0.001 statistically different in comparison to untreated. (B) Representative fluorescence photomicrograph (400 × magnification) illustrating the acidic vesicular organelles in A549 and SK-LU-1 cell lines after treatment with ACA in presence or absence of 3-MA. Data were presented as relative fluorescence intensity in comparison to untreated cells ± SD of three independent experiments * p < 0.05 and ** p < 0.01 statistically different in comparison to untreated. # p < 0.05 and ## p < 0.01 statistically different in comparison to 3-MA. (C) Representative fluorescence photomicrograph (400 × magnification) illustrating the GFP-LC3-II punctate formation in A549 and SK-LU-1 cell lines upon exposure to co-treatment of 3-MA and ACA. Data were represented as mean percentage of cells with GFP-LC3-II punctate ± SD of three independent experiments. *** p < 0.001 statistically different in comparison to untreated. ### p < 0.001 statistically different in comparison to 3-MA. (D) Effect of 3-MA on LC3-I/LC3-II protein expression after pre-treatment of 3-MA prior to ACA treatment in A549 and SK-LU-1 cell lines. Data were represented as normalized intensity ± SD of three independent experiments. * p < 0.05, ** p < 0.01 and *** p < 0.001 statistically different in comparison to untreated. ## p < 0.01 and ### p < 0.001 statistically different in comparison to 3-MA. (E) Effect of 3-MA on the cell viability of ACA-treated A549 and SK-LU-1 cell lines. Data represented as mean percentage of cell viability ± SD for three independent experiments. * p < 0.05 and *** p < 0.001 statistically different in comparison to untreated.CC0 · PubMed Central
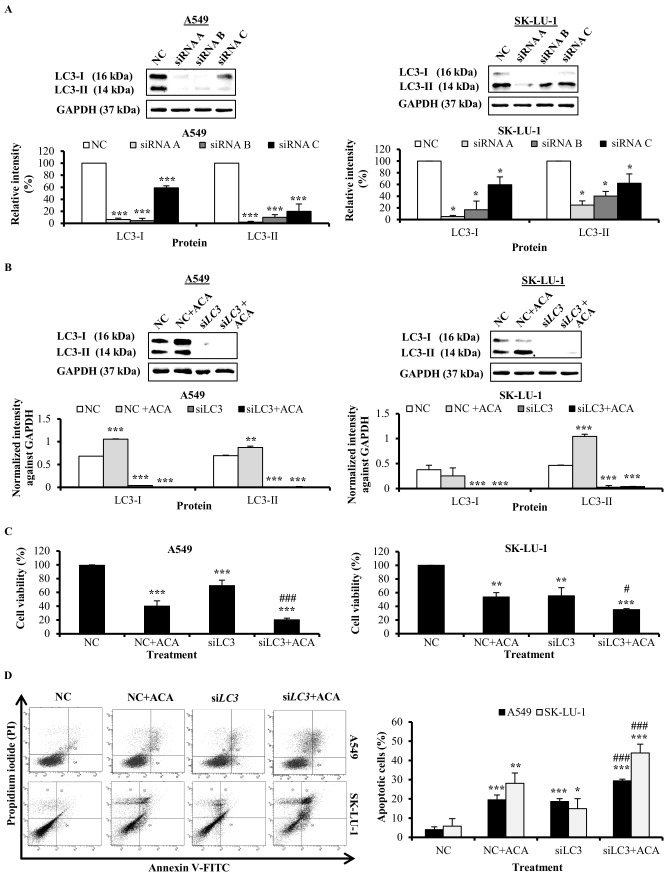
Fig 4 Knockdown of LC3 enhanced ACA-induced cytotoxicity through apoptosis. (A) Knockdown efficiency of the three unique 27 mer siRNA duplexes targeting LC3 in A549 and SK-LU-1. Data were represented as mean percentage of relative intensity ± SD of three independent experiments. * p < 0.05 and *** p < 0.001 statistically different in comparison to negative control (NC). (B) Effect of siLC3 on ACA-induced LC3-I/LC3-II protein expression in A549 and SK-LU-1 cell lines. Data were represented as normalized intensity ± SD of three independent experiments. *** p < 0.001 statistically different in comparison to negative control (NC). (C) Effect of siLC3 on the cell viability of ACA-treated A549 and SK-LU-1 cell lines. Data represented as mean percentage of cell viability ± SD for three independent experiments. ** p < 0.01 and *** p < 0.001 statistically different in comparison to negative control (NC). # p < 0.05 and ### p < 0.001 statistically different in comparison to NC + ACA. (D) Effect of siLC3 on ACA-induced apoptotic cells in A549 and SK-LU-1 cell lines. Representative annexin V-FITC/PI scatter plots of 1 × 10⁴ cells after 24 h of treatment. Data represented as mean percentage of apoptotic cells ± SD for three independent experiments. * p < 0.05, ** p < 0.01 and *** p < 0.001 statistically different in comparison to negative control (NC). ### p < 0.001 statistically different in comparison to NC + ACA.
Fig 4 Knockdown of LC3 enhanced ACA-induced cytotoxicity through apoptosis. (A) Knockdown efficiency of the three unique 27 mer siRNA duplexes targeting LC3 in A549 and SK-LU-1. Data were represented as mean percentage of relative intensity ± SD of three independent experiments. * p < 0.05 and *** p < 0.001 statistically different in comparison to negative control (NC). (B) Effect of siLC3 on ACA-induced LC3-I/LC3-II protein expression in A549 and SK-LU-1 cell lines. Data were represented as normalized intensity ± SD of three independent experiments. *** p < 0.001 statistically different in comparison to negative control (NC). (C) Effect of siLC3 on the cell viability of ACA-treated A549 and SK-LU-1 cell lines. Data represented as mean percentage of cell viability ± SD for three independent experiments. ** p < 0.01 and *** p < 0.001 statistically different in comparison to negative control (NC). # p < 0.05 and ### p < 0.001 statistically different in comparison to NC + ACA. (D) Effect of siLC3 on ACA-induced apoptotic cells in A549 and SK-LU-1 cell lines. Representative annexin V-FITC/PI scatter plots of 1 × 10⁴ cells after 24 h of treatment. Data represented as mean percentage of apoptotic cells ± SD for three independent experiments. * p < 0.05, ** p < 0.01 and *** p < 0.001 statistically different in comparison to negative control (NC). ### p < 0.001 statistically different in comparison to NC + ACA.CC0 · PubMed Central
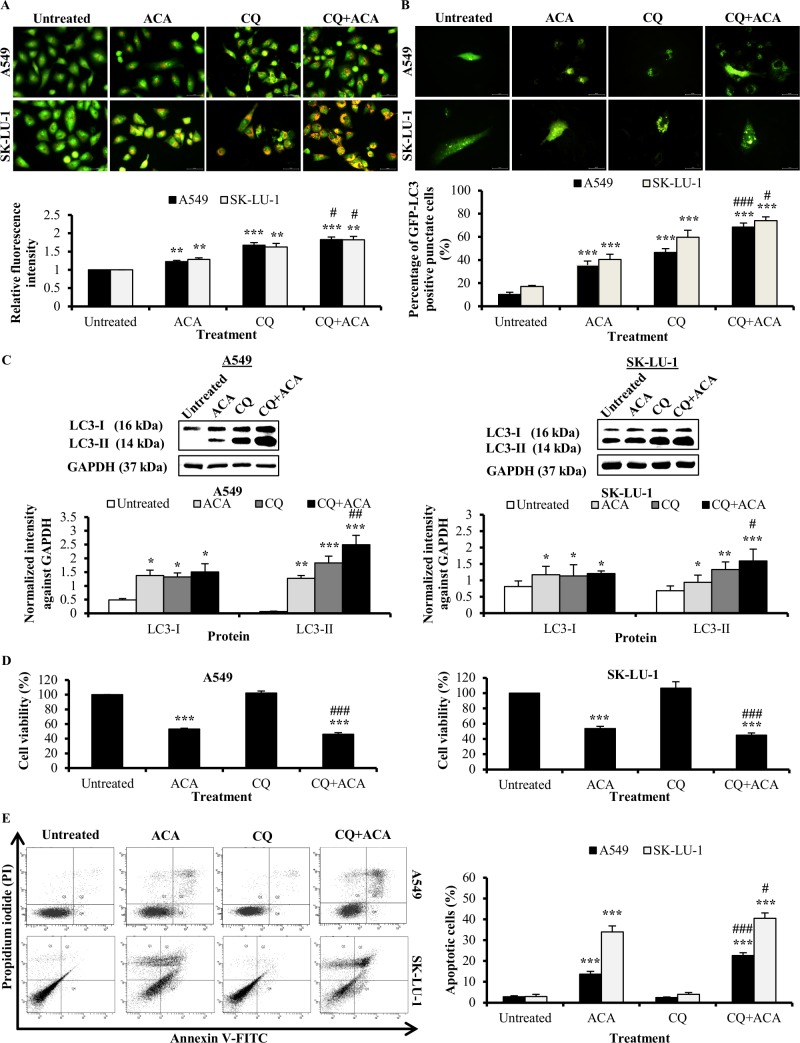
Fig 5 Autophagy inhibitor chloroquine enhanced ACA-induced cytotoxicity through apoptosis. (A) Representative fluorescence photomicrograph (400 × magnification) illustrating the acidic vesicular organelles in A549 and SK-LU-1 cell lines after treatment with ACA in presence or absence of CQ. Data were presented as relative fluorescence intensity in comparison to untreated cells ± SD of three independent experiments. ** p < 0.01 and *** p < 0.001 statistically different in comparison to untreated. # p < 0.05 statistically different in comparison to CQ. (B) Representative fluorescence photomicrograph (400 × magnification) illustrating the GFP-LC3-II punctate formation in A549 and SK-LU-1 cell lines upon exposure to co-treatment of CQ and ACA. Data were represented as mean percentage of cells with GFP-LC3-II punctate ± SD of three independent experiments. *** p < 0.001 statistically different in comparison to untreated. # p < 0.05 and ### p < 0.001 statistically different in comparison to CQ. (C) Effect of CQ on LC3-I/LC3-II protein expression after pre-treated with CQ prior ACA treatment in A549 and SK-LU-1 cell lines. Data were represented as normalized intensity ± SD of three independent experiments. * p < 0.05, ** p < 0.01 and *** p < 0.001 statistically different in comparison to untreated. # p < 0.05 and ## p < 0.01 statistically different in comparison to CQ. (D) Effect of CQ on the cell viability of ACA-treated A549 and SK-LU-1 cell lines. Data represented as mean percentage of cell viability ± SD for three independent experiments. *** p < 0.001 statistically different in comparison to untreated. ### p < 0.001 statistically different in comparison to ACA. (E) Effect of CQ on ACA-induced apoptotic cells in A549 and SK-LU-1 cell lines. Representative annexin V-FITC/PI scatter plots of 1 × 10⁴ cells after 24 h of treatment. Data represented as mean percentage of apoptotic cells ± SD for three independent experiments. *** p < 0.001 statistically different in comparison to untreated. # p < 0.05 and ### p < 0.001 statistically different in comparison to ACA.
Fig 5 Autophagy inhibitor chloroquine enhanced ACA-induced cytotoxicity through apoptosis. (A) Representative fluorescence photomicrograph (400 × magnification) illustrating the acidic vesicular organelles in A549 and SK-LU-1 cell lines after treatment with ACA in presence or absence of CQ. Data were presented as relative fluorescence intensity in comparison to untreated cells ± SD of three independent experiments. ** p < 0.01 and *** p < 0.001 statistically different in comparison to untreated. # p < 0.05 statistically different in comparison to CQ. (B) Representative fluorescence photomicrograph (400 × magnification) illustrating the GFP-LC3-II punctate formation in A549 and SK-LU-1 cell lines upon exposure to co-treatment of CQ and ACA. Data were represented as mean percentage of cells with GFP-LC3-II punctate ± SD of three independent experiments. *** p < 0.001 statistically different in comparison to untreated. # p < 0.05 and ### p < 0.001 statistically different in comparison to CQ. (C) Effect of CQ on LC3-I/LC3-II protein expression after pre-treated with CQ prior ACA treatment in A549 and SK-LU-1 cell lines. Data were represented as normalized intensity ± SD of three independent experiments. * p < 0.05, ** p < 0.01 and *** p < 0.001 statistically different in comparison to untreated. # p < 0.05 and ## p < 0.01 statistically different in comparison to CQ. (D) Effect of CQ on the cell viability of ACA-treated A549 and SK-LU-1 cell lines. Data represented as mean percentage of cell viability ± SD for three independent experiments. *** p < 0.001 statistically different in comparison to untreated. ### p < 0.001 statistically different in comparison to ACA. (E) Effect of CQ on ACA-induced apoptotic cells in A549 and SK-LU-1 cell lines. Representative annexin V-FITC/PI scatter plots of 1 × 10⁴ cells after 24 h of treatment. Data represented as mean percentage of apoptotic cells ± SD for three independent experiments. *** p < 0.001 statistically different in comparison to untreated. # p < 0.05 and ### p < 0.001 statistically different in comparison to ACA.CC0 · PubMed Central

Verification

Claims the paper makes

The claims and statistics of this paper haven’t been checked yet.

Run the check — free, no account needed. It reads the open-access text and checks the sources it cites.

A few free checks a day · papers already verified open instantly · results are public

Claims other papers make about this one

Each is checked against this paper’s own text: does it say what the citing paper says it does?

Self-check

Percentages, sums and reported differences re-computed from the paper’s own numbers.

The self-check needs the paper’s full text.

Citations

Cites

Show all 2 references

Research works printed but not linked: 34

  1. J Ferlay, 2015, Cancer incidence and mortality worldwide: Sources, methods and major patterns in GLOBOCAN 2012, International Journal of Cancer, 136, E359, 10.1002/ijc.29210 · DOI · Paper page
  2. JR Molina, 2008, Non-small cell lung cancer: epidemiology, risk factors, treatment, and survivorship, Mayo Clinic proceedings, 83, 584, 10.1016/S0025-6196(11)60735-0 · DOI
  3. EC de Bruin, 2008, Apoptosis and non-apoptotic deaths in cancer development and treatment response, Cancer Treatment Reviews, 34, 737, 10.1016/j.ctrv.2008.07.001 · DOI
  4. X Sui, 2013, Autophagy and chemotherapy resistance: a promising therapeutic target for cancer treatment, Cell death & disease, 4, e838, 10.1038/cddis.2013.350 · DOI
  5. MS Ricci, 2006, Chemotherapeutic approaches for targeting cell death pathways, The oncologist, 11, 342, 10.1634/theoncologist.11-4-342 · DOI
  6. N Dupont, 2013, Non-canonical Autophagy: Facts and Prospects, Curr Pathobiol Rep, 1, 263, 10.1007/s40139-013-0030-y · DOI
  7. N Hasima, 2014, Regulation of autophagy by polyphenolic compounds as a potential therapeutic strategy for cancer, Cell death & disease, 5, e1509, 10.1038/cddis.2014.467 · DOI
  8. M Wu, 2015, Guttiferone K induces autophagy and sensitizes cancer cells to nutrient stress-induced cell death, Phytomedicine: international journal of phytotherapy and phytopharmacology, 22, 902, 10.1016/j.phymed.2015.06.008 · DOI
  9. W-L Chen, 2016, Silvestrol induces early autophagy and apoptosis in human melanoma cells, BMC Cancer, 16, 1
  10. NM Arshad, 2015, Recombinant human alpha fetoprotein synergistically potentiates the anti-cancer effects of 1’-S-1’-acetoxychavicol acetate when used as a complex against human tumours harbouring AFP-receptors, Oncotarget, 6, 16151, 10.18632/oncotarget.3951 · DOI
  11. K Awang, 2010, The Apoptotic Effect of 1 ' S-1 '-Acetoxychavicol Acetate from Alpinia Conchigera on Human Cancer Cells, Molecules, 15, 8048, 10.3390/molecules15118048 · DOI
  12. LLA In, 2012, 1 '-Acetoxychavicol acetate inhibits growth of human oral carcinoma xenograft in mice and potentiates cisplatin effect via proinflammatory microenvironment alterations, Bmc Complementary and Alternative Medicine, 12, 179, 10.1186/1472-6882-12-179 · DOI
  13. NH Phuah, 2013, Alterations of MicroRNA Expression Patterns in Human Cervical Carcinoma Cells (Ca Ski) toward 1 ' S-1 '-Acetoxychavicol Acetate and Cisplatin, Reproductive Sciences, 20, 567, 10.1177/1933719112459220 · DOI
  14. S Paglin, 2001, A novel response of cancer cells to radiation involves autophagy and formation of acidic vesicles, Cancer Res, 61
  15. B Ozpolat, 2015, Targeting autophagy in cancer management—strategies and developments, Cancer management and research, 7, 291, 10.2147/CMAR.S34859 · DOI
  16. BQ Liu, 2013, BAG3-dependent noncanonical autophagy induced by proteasome inhibition in HepG2 cells, Autophagy, 9, 905, 10.4161/auto.24292 · DOI
  17. DM Smith, 2010, Arsenic trioxide induces a beclin-1-independent autophagic pathway via modulation of SnoN/SkiL expression in ovarian carcinoma cells, Cell Death and Differentiation, 17, 1867, 10.1038/cdd.2010.53 · DOI
  18. VO Kaminskyy, 2012, Suppression of basal autophagy reduces lung cancer cell proliferation and enhances caspase-dependent and -independent apoptosis by stimulating ROS formation, Autophagy, 8, 1032, 10.4161/auto.20123 · DOI
  19. MJ Hsieh, 2014, A combination of pterostilbene with autophagy inhibitors exerts efficient apoptotic characteristics in both chemosensitive and chemoresistant lung cancer cells, Toxicological sciences: an official journal of the Society of Toxicology, 137, 65, 10.1093/toxsci/kft238 · DOI
  20. YJ Lee, 2011, Involvement of ROS in Curcumin-induced Autophagic Cell Death, The Korean journal of physiology & pharmacology: official journal of the Korean Physiological Society and the Korean Society of Pharmacology, 15, 1, 10.4196/kjpp.2011.15.1.1 · DOI
  21. JY Kim, 2012, Curcumin-induced autophagy contributes to the decreased survival of oral cancer cells, Archives of oral biology, 57, 1018, 10.1016/j.archoralbio.2012.04.005 · DOI
  22. H Miki, 2012, Resveratrol induces apoptosis via ROS-triggered autophagy in human colon cancer cells, International journal of oncology, 40, 1020, 10.3892/ijo.2012.1325 · DOI
  23. R Kato, 2014, The synergistic effect of 1 '-acetoxychavicol acetate and sodium butyrate on the death of human hepatocellular carcinoma cells, Chemico-Biological Interactions, 212, 1, 10.1016/j.cbi.2014.01.010 · DOI
  24. K Ito, 2004, Induction of apoptosis in human myeloid leukemic cells by 1 '-acetoxychavicol acetate through a mitochondrial- and Fas-mediated dual mechanism, Clinical Cancer Research, 10, 2120, 10.1158/1078-0432.CCR-1142-03 · DOI
  25. P Gao, 2010, The Bcl-2 homology domain 3 mimetic gossypol induces both Beclin 1-dependent and Beclin 1-independent cytoprotective autophagy in cancer cells, The Journal of biological chemistry, 285, 25570, 10.1074/jbc.M110.118125 · DOI
  26. F Scarlatti, 2008, Role of non-canonical Beclin 1-independent autophagy in cell death induced by resveratrol in human breast cancer cells, Cell Death and Differentiation, 15, 1318, 10.1038/cdd.2008.51 · DOI · Paper page
  27. C Liu, 2012, Autophagy-independent enhancing effects of Beclin 1 on cytotoxicity of ovarian cancer cells mediated by proteasome inhibitors, Bmc Cancer, 12
  28. DM Smith, 2010, Arsenic trioxide induces a beclin-1-independent autophagic pathway via modulation of SnoN/SkiL expression in ovarian carcinoma cells, Cell Death Differ, 17, 1867, 10.1038/cdd.2010.53 · DOI
  29. T Copetti, 2009, p65/RelA binds and activates the beclin 1 promoter, Autophagy, 5, 858, 10.4161/auto.8822 · DOI
  30. Y Zou, 2013, The Autophagy Inhibitor Chloroquine Overcomes the Innate Resistance of Wild-Type EGFR Non-Small-Cell Lung Cancer Cells to Erlotinib, Journal of Thoracic Oncology, 8, 693, 10.1097/JTO.0b013e31828c7210 · DOI
  31. MC Tang, 2015, Chloroquine enhances gefitinib cytotoxicity in gefitinib-resistant nonsmall cell lung cancer cells, PLoS One, 10, e0119135, 10.1371/journal.pone.0119135 · DOI
  32. G Wang, 2016, Studying the Effect of Downregulating Autophagy-Related Gene LC3 on TLR3 Apoptotic Pathway Mediated by dsRNA in Hepatocellular Carcinoma Cells, J Korean Cancer Assoc
  33. P Jiang, 2014, Autophagy and human diseases, Cell research, 24, 69, 10.1038/cr.2013.161 · DOI
  34. SB Goldberg, 2012, A phase I study of erlotinib and hydroxychloroquine in advanced non-small-cell lung cancer, Journal of thoracic oncology: official publication of the International Association for the Study of Lung Cancer, 7, 1602, 10.1097/JTO.0b013e318262de4a · DOI

Cited by

Sorted by citations

See all 18

Metadata

Authors
Sok, S. P. M., Arshad, N. M., Azmi, M. N., Awang, K., Ozpolat, B., & Hasima Nagoor, N.
Venue
PLOS ONE
Published
2017-02-03
Volume
12
Issue
2
Pages
e0171329
ISSN
1932-6203
Cited by
18
References
2
Language
en
Funders
  • Science Technology and Innovation (MOSTI) and University of Malaya through Science Fund (SF014-2-13)
  • RU Operation Grant (RU005C-2014)

About these checks

Registry, retraction, Cites and statistics results are computed, not judged, with one exception: a printed reference that no index lists is read once by a model before it counts as a citation error. Claims are extracted by a model and kept only when their quote appears verbatim in the text; each cited source is then checked, with a model’s help, for whether it says what the claim relies on. Those verdicts can be wrong — read the claim’s quote and the cited source before relying on one.

Statistics and arithmetic are recomputed, not judged.

Confidence bands are shown only for fields calibrated on our annotated test set. None is calibrated yet, so no band is shown.

What counts as a claim ›How we measure confidence ›How we check this ›

Are you an author, or do you see a problem with this page? Request a review

How to cite

Cite CoChat for the checks on this page, and the paper for its own findings.

This page
CoChat. (2026). Citation check: The apoptotic effect of 1’S-1’-Acetoxychavicol Acetate (ACA) enhanced by inhibition of non-canonical autophagy in human non-small cell lung cancer cells. https://app.cochat.ai/papers/10.1371/journal.pone.0171329
The paper
Sok, S. P. M., Arshad, N. M., Azmi, M. N., Awang, K., Ozpolat, B., & Hasima Nagoor, N. (2017). The apoptotic effect of 1’S-1’-Acetoxychavicol Acetate (ACA) enhanced by inhibition of non-canonical autophagy in human non-small cell lung cancer cells. PLOS ONE. https://doi.org/10.1371/journal.pone.0171329