Cited by 119

The DOI matches its Crossref record; 1 of the 1 references it cites were found in a registry or an index.

Use of capillary Western immunoassay (Wes) for quantification of dystrophin levels in skeletal muscle of healthy controls and individuals with Becker and Duchenne muscular dystrophy

Beekman, Chantal, Janson, Anneke A., Baghat, Aabed, van Deutekom, Judith C., Datson, Nicole A.·2018·PLOS ONE

Overview

The claims and statistics of this paper haven’t been checked yet.

Run the check — free, no account needed. It reads the open-access text and checks the sources it cites.

A few free checks a day · papers already verified open instantly · results are public

Integrity signals

Registry

Crossref · 10.1371/journal.pone.0195850

Cites

1 of 1 references verified0 citation errors · 0 not checkable

Statistics

Figures

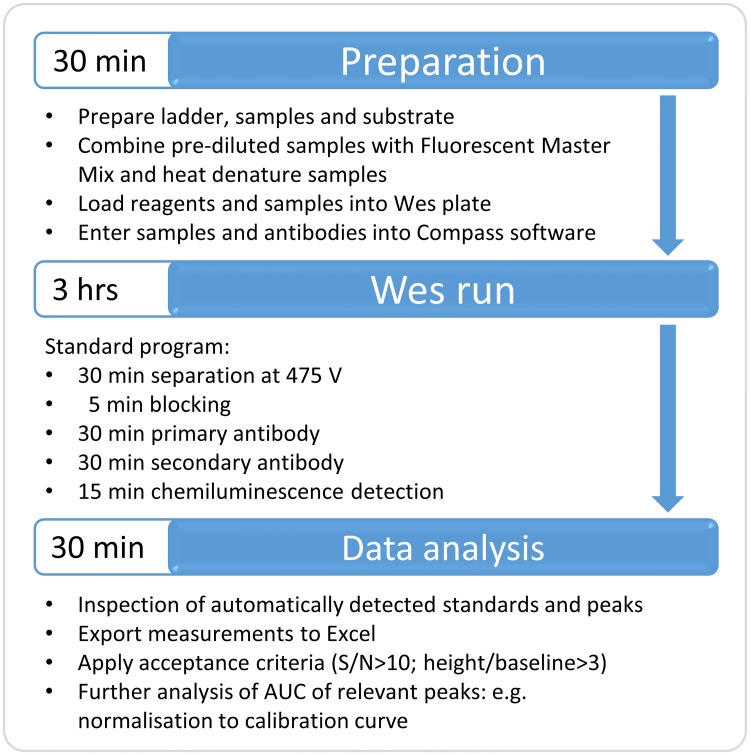
Fig 1 Workflow of Wes procedure. The required steps and time to complete a Wes run and analysis are indicated.
Fig 1 Workflow of Wes procedure. The required steps and time to complete a Wes run and analysis are indicated.CC BY · PubMed Central
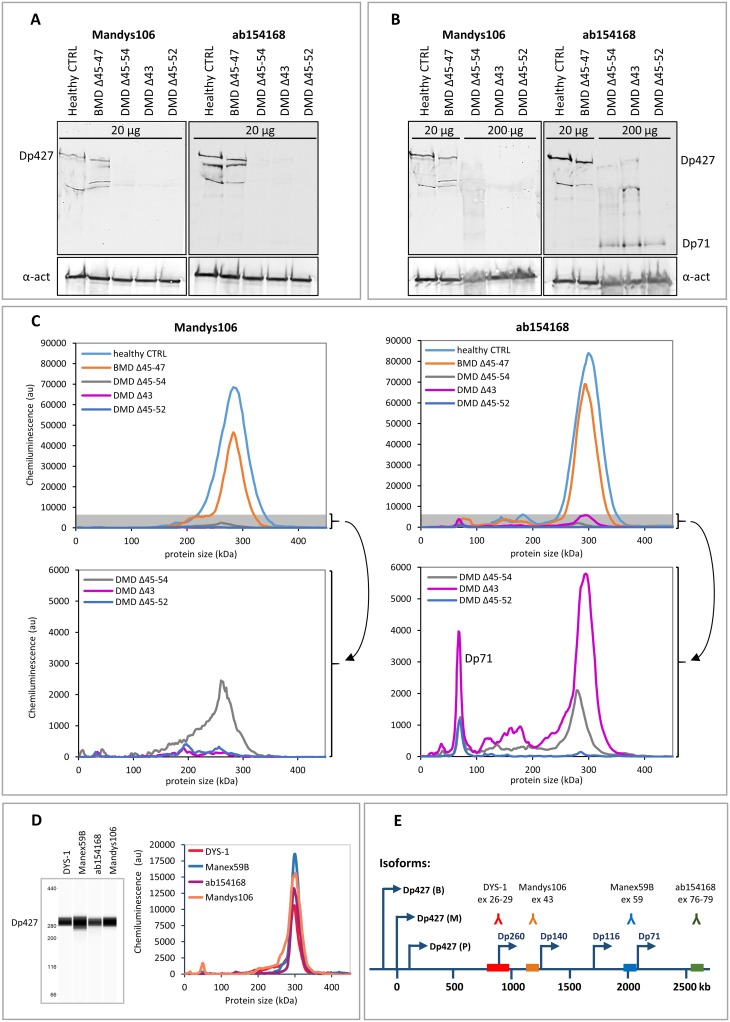
Fig 2 Comparison of dystrophin detection by Western blot and Wes in skeletal muscle samples from a healthy control, a BMD patient and 3 DMD patients. Western blot analysis of a healthy control, a BMD and 3 DMD samples. Expected molecular weights: BMD del45-47: 410 kDa, DMD del45-54: 367 kDa, DMD del43: 422 kDa, DMD del45-52: 381 kDa. A) A dystrophin signal is visible of the expected size (427 kDa) in the healthy control and BMD samples when loading 20 μg per lane, but not for the DMD samples. B) Loading of 10x more material (200 μg per lane) results in a weak dystrophin signal for 2 out of the 3 DMD samples using ab154168 and no signal using Mandys106. The lower panel shows the α-actinin signal. Note that the middle DMD sample has a deletion of exon 43 (epitope for Mandys106), so it is not expected to produce a signal. The additional bands of lower molecular weight are either degradation products and/or dystrophin isoforms. C) Wes analysis of the same samples: At 1 μg total protein (5 μl of a 200 μg/ml dilution) clear signals are detected at 300 kDa for all but the lowest DMD sample using ab154168. The bottom graphs show the DMD data again, only with adjusted y-axes, to zoom in on the grey shaded areas of the upper graphs. D) Virtual blot and electropherogram representation of a typical full length dystrophin signal in a healthy control sample detected by Wes. The dystrophin signal is detected using 4 different antibodies: Dys-1 (1/25 antibody, loaded 0.04 μg protein), Manex59B (1/100 antibody, loaded 0.15 μg protein), ab154168 (1/1000 antibody, loaded 0.13 μg protein) and Mandys106 (1/50 antibody, loaded 0.13 μg protein). E) An overview of the dystrophin antibody epitopes recognised by the different antibodies and the exons coding for the epitopes. The arrows indicate the promotors of the different dystrophin isoforms (Dp427: brain (B), muscle (M) and Purkinje (P); Dp260, Dp140, Dp116 and Dp71).
Fig 2 Comparison of dystrophin detection by Western blot and Wes in skeletal muscle samples from a healthy control, a BMD patient and 3 DMD patients. Western blot analysis of a healthy control, a BMD and 3 DMD samples. Expected molecular weights: BMD del45-47: 410 kDa, DMD del45-54: 367 kDa, DMD del43: 422 kDa, DMD del45-52: 381 kDa. A) A dystrophin signal is visible of the expected size (427 kDa) in the healthy control and BMD samples when loading 20 μg per lane, but not for the DMD samples. B) Loading of 10x more material (200 μg per lane) results in a weak dystrophin signal for 2 out of the 3 DMD samples using ab154168 and no signal using Mandys106. The lower panel shows the α-actinin signal. Note that the middle DMD sample has a deletion of exon 43 (epitope for Mandys106), so it is not expected to produce a signal. The additional bands of lower molecular weight are either degradation products and/or dystrophin isoforms. C) Wes analysis of the same samples: At 1 μg total protein (5 μl of a 200 μg/ml dilution) clear signals are detected at 300 kDa for all but the lowest DMD sample using ab154168. The bottom graphs show the DMD data again, only with adjusted y-axes, to zoom in on the grey shaded areas of the upper graphs. D) Virtual blot and electropherogram representation of a typical full length dystrophin signal in a healthy control sample detected by Wes. The dystrophin signal is detected using 4 different antibodies: Dys-1 (1/25 antibody, loaded 0.04 μg protein), Manex59B (1/100 antibody, loaded 0.15 μg protein), ab154168 (1/1000 antibody, loaded 0.13 μg protein) and Mandys106 (1/50 antibody, loaded 0.13 μg protein). E) An overview of the dystrophin antibody epitopes recognised by the different antibodies and the exons coding for the epitopes. The arrows indicate the promotors of the different dystrophin isoforms (Dp427: brain (B), muscle (M) and Purkinje (P); Dp260, Dp140, Dp116 and Dp71).CC BY · PubMed Central
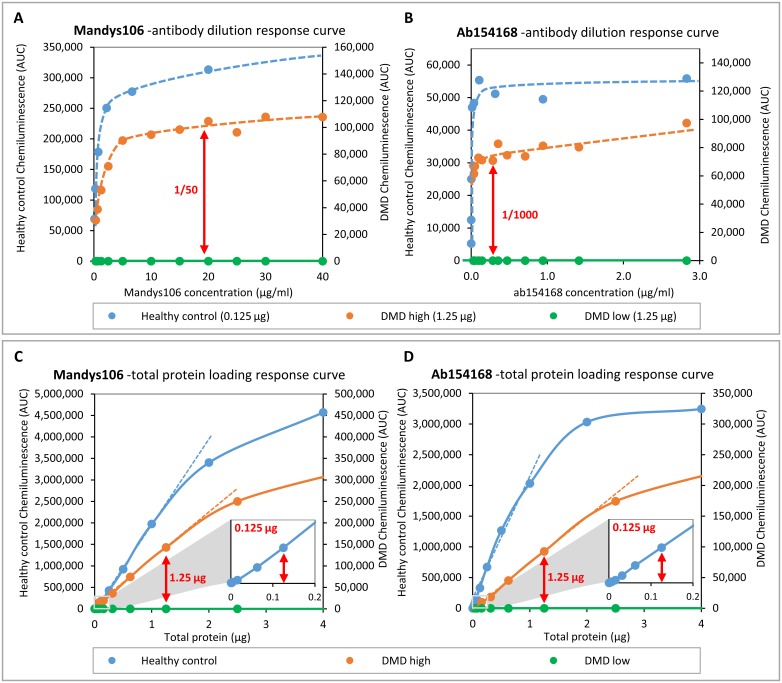
Fig 3 Optimization of antibody dilution for Mandys106 and ab154168 and determining linearity of quantification. Skeletal muscle samples from a healthy control and a DMD patient with high trace dystrophin and a DMD patient with low or complete absence of dystrophin were used for optimisation and to determine the linear range of quantification. A and B) Dystrophin detected in healthy control (25 μg/ml) and DMD (250 μg/ml) samples using different antibody dilutions. C and D) Dystrophin detected in different amounts of healthy muscle lysate, using the antibody concentrations established in -Aand B (Mandys106: 1/50; ab154168: 1/1000). The small squares at the bottom right of graphs C and D represent a zoomed-in section of the low protein concentration range, to show signal linearity between 0 and 0.2 μg total protein. The arrows indicate the dilutions/concentrations selected for further experiments.
Fig 3 Optimization of antibody dilution for Mandys106 and ab154168 and determining linearity of quantification. Skeletal muscle samples from a healthy control and a DMD patient with high trace dystrophin and a DMD patient with low or complete absence of dystrophin were used for optimisation and to determine the linear range of quantification. A and B) Dystrophin detected in healthy control (25 μg/ml) and DMD (250 μg/ml) samples using different antibody dilutions. C and D) Dystrophin detected in different amounts of healthy muscle lysate, using the antibody concentrations established in -Aand B (Mandys106: 1/50; ab154168: 1/1000). The small squares at the bottom right of graphs C and D represent a zoomed-in section of the low protein concentration range, to show signal linearity between 0 and 0.2 μg total protein. The arrows indicate the dilutions/concentrations selected for further experiments.CC BY · PubMed Central
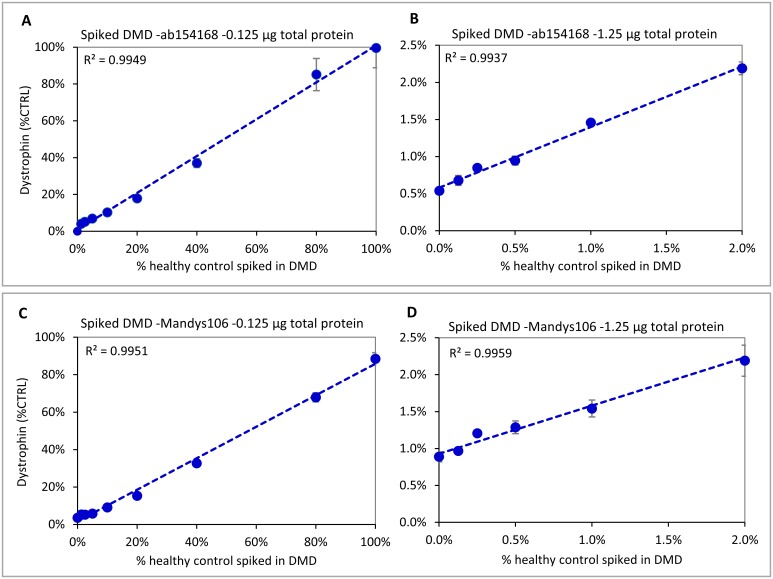
Fig 4 Dynamic ranges for ab154168 and Mandys106 using different amounts of healthy control sample spiked into a DMD sample. Both antibodies show good linearity from ~5%-100% of healthy control when loading 0.125 μg (A and C). When loading 1.25 μg (B and D), ab154168 shows good linearity down to 0.125% of healthy control, while for Mandys106 samples with dystrophin levels ≤0.5% of control become hard to distinguish, due to the higher aspecific background signal. Experiments were performed in triplicate.
Fig 4 Dynamic ranges for ab154168 and Mandys106 using different amounts of healthy control sample spiked into a DMD sample. Both antibodies show good linearity from ~5%-100% of healthy control when loading 0.125 μg (A and C). When loading 1.25 μg (B and D), ab154168 shows good linearity down to 0.125% of healthy control, while for Mandys106 samples with dystrophin levels ≤0.5% of control become hard to distinguish, due to the higher aspecific background signal. Experiments were performed in triplicate.CC BY · PubMed Central
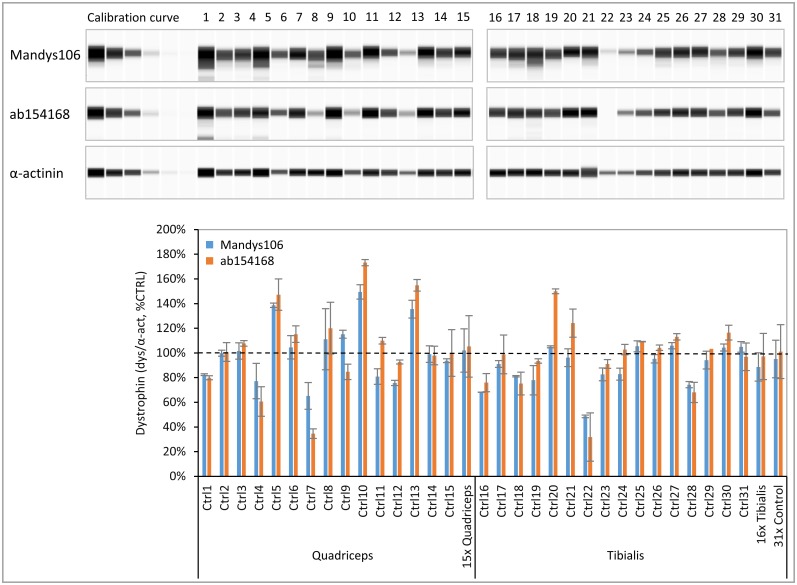
Fig 5 Dystrophin levels in skeletal muscle samples derived from healthy controls. A panel of 31 healthy human tibialis and quadriceps muscle samples was analysed for dystrophin using ab154168 and Mandys106 and normalized to α-actinin (n = 2). Protein loading was 0.125 μg. A) Virtual blot view of Wes result (lanes compiled from 2 runs) showing the dystrophin levels obtained with antibodies Mandys106 and ab154168 (top panels) and the α-actinin signal (lower panel). B) Dystrophin levels (divided by α-actinin) expressed as a percentage of the control (% CTRL). In addition to the individual sample values, the average dystrophin levels of all 15 quadriceps samples, the 16 tibialis samples and all 31 samples are displayed. The dashed line represents 100% of CTRL.
Fig 5 Dystrophin levels in skeletal muscle samples derived from healthy controls. A panel of 31 healthy human tibialis and quadriceps muscle samples was analysed for dystrophin using ab154168 and Mandys106 and normalized to α-actinin (n = 2). Protein loading was 0.125 μg. A) Virtual blot view of Wes result (lanes compiled from 2 runs) showing the dystrophin levels obtained with antibodies Mandys106 and ab154168 (top panels) and the α-actinin signal (lower panel). B) Dystrophin levels (divided by α-actinin) expressed as a percentage of the control (% CTRL). In addition to the individual sample values, the average dystrophin levels of all 15 quadriceps samples, the 16 tibialis samples and all 31 samples are displayed. The dashed line represents 100% of CTRL.CC BY · PubMed Central
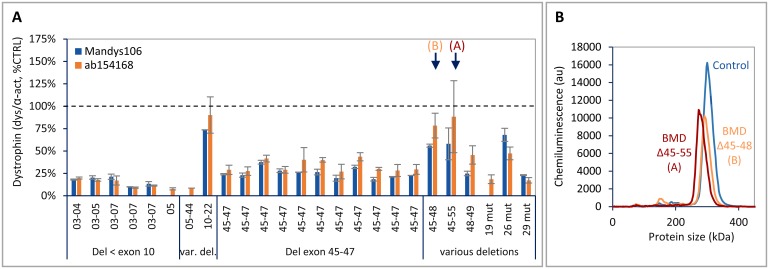
Fig 6 Dystrophin levels in skeletal muscle samples derived from BMD patients. Panel of 25 tibialis samples from BMD patients, analysed for dystrophin using ab154168 and Mandys106 and normalized to α-actinin (n = 2). Protein loading was 0.125 μg. A) Dystrophin levels (divided by α-actinin) expressed as a percentage of healthy control (% CTRL). The 2 BMD samples indicated by an arrow are depicted in B. B) Electropherogram showing the molecular weight shift of the peaks for mutant dystrophin with different sizes derived from the 2 BMD samples (A and B) indicated by an arrow in A, compared to a control sample with full-length dystrophin. BMD A (del 45–55: calculated MW = 358 kDa, expected apparent MW on Wes is 279 kDa; BMD B (del 45–48): calculated MW = 401 kDa, expected apparent MW on Wes is 294 kDa.
Fig 6 Dystrophin levels in skeletal muscle samples derived from BMD patients. Panel of 25 tibialis samples from BMD patients, analysed for dystrophin using ab154168 and Mandys106 and normalized to α-actinin (n = 2). Protein loading was 0.125 μg. A) Dystrophin levels (divided by α-actinin) expressed as a percentage of healthy control (% CTRL). The 2 BMD samples indicated by an arrow are depicted in B. B) Electropherogram showing the molecular weight shift of the peaks for mutant dystrophin with different sizes derived from the 2 BMD samples (A and B) indicated by an arrow in A, compared to a control sample with full-length dystrophin. BMD A (del 45–55: calculated MW = 358 kDa, expected apparent MW on Wes is 279 kDa; BMD B (del 45–48): calculated MW = 401 kDa, expected apparent MW on Wes is 294 kDa.CC BY · PubMed Central
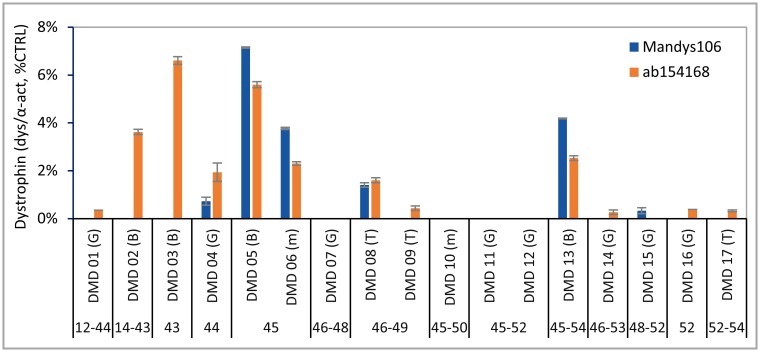
Fig 7 Dystrophin levels in skeletal muscle samples derived from DMD patients. Panel of 17 gastrocnemius, biceps and tibialis muscle samples from DMD patients, analysed for dystrophin using ab154168 and Mandys106 and normalized to α-actinin (n = 2). Protein loading was 1.25 μg. Muscle types are indicated between brackets: G = gastrocnemius; B = biceps; T = tibialis and M = miscellaneous.
Fig 7 Dystrophin levels in skeletal muscle samples derived from DMD patients. Panel of 17 gastrocnemius, biceps and tibialis muscle samples from DMD patients, analysed for dystrophin using ab154168 and Mandys106 and normalized to α-actinin (n = 2). Protein loading was 1.25 μg. Muscle types are indicated between brackets: G = gastrocnemius; B = biceps; T = tibialis and M = miscellaneous.CC BY · PubMed Central
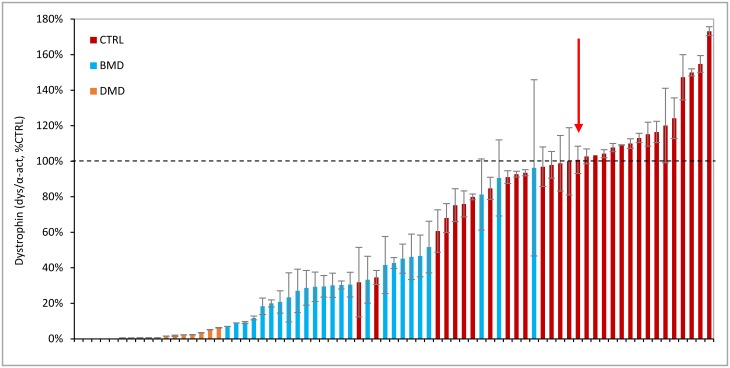
Fig 8 Summary of dystrophin levels in all healthy control, BMD and DMD samples analysed by Wes. Dystrophin levels obtained in all 31 healthy controls, 25 BMD and 17 DMD skeletal muscle samples using ab154168. The samples are normalized to α-actinin, expressed as a percentage of the standard control (% CTRL) and ranked from low to high dystrophin levels. DMD samples in orange, BMD in blue and healthy controls in red. The dashed line represents 100% CTRL; the red arrow shows the median of the healthy control samples, with a value of 101%.
Fig 8 Summary of dystrophin levels in all healthy control, BMD and DMD samples analysed by Wes. Dystrophin levels obtained in all 31 healthy controls, 25 BMD and 17 DMD skeletal muscle samples using ab154168. The samples are normalized to α-actinin, expressed as a percentage of the standard control (% CTRL) and ranked from low to high dystrophin levels. DMD samples in orange, BMD in blue and healthy controls in red. The dashed line represents 100% CTRL; the red arrow shows the median of the healthy control samples, with a value of 101%.CC BY · PubMed Central

Verification

Claims the paper makes

The claims and statistics of this paper haven’t been checked yet.

Run the check — free, no account needed. It reads the open-access text and checks the sources it cites.

A few free checks a day · papers already verified open instantly · results are public

Claims other papers make about this one

Each is checked against this paper’s own text: does it say what the citing paper says it does?

Self-check

Percentages, sums and reported differences re-computed from the paper’s own numbers.

The self-check needs the paper’s full text.

Citations

Cites

Show all 1 references

Research works printed but not linked: 28

  1. S Ryder, 2017, The burden, epidemiology, costs and treatment for Duchenne muscular dystrophy: an evidence review, Orphanet J Rare Dis, 12, 79, 10.1186/s13023-017-0631-3 · DOI
  2. F Muntoni, 2003, Dystrophin and mutations: one gene, several proteins, multiple phenotypes, Lancet Neurol, 2, 731, 10.1016/S1474-4422(03)00585-4 · DOI
  3. S Abbs, 2010, Best practice guidelines on molecular diagnostics in Duchenne/Becker muscular dystrophies, Neuromuscul Disord, 20, 422, 10.1016/j.nmd.2010.04.005 · DOI
  4. D Allen, 2016, Absence of dystrophin disrupts skeletal muscle signaling: Roles of Ca2+, reactive oxygen spcies, and nitric oxide in the development of muscular dystrophy, Physiol Rev, 96, 253, 10.1152/physrev.00007.2015 · DOI
  5. K Lapidos, 2004, The dystrophin glycoprotein complex: signaling strength and integrity for the sarcolemma, Circ Res, 94, 1023, 10.1161/01.RES.0000126574.61061.25 · DOI
  6. M Koenig, 1989, The molecular basis for Duchenne versus Becker muscular dystrophy: correlation of severity with type of deletion, Am J Hum Genet, 45, 498
  7. A Monaco, 1988, An explanation for the phenotypic differences between patients bearing partial deletions of the DMD locus, Genomics, 2, 90, 10.1016/0888-7543(88)90113-9 · DOI
  8. C Comi, 1994, Clinical variability in Becker muscular dystrophy. Genetic, biochemical and immunohistochemical correlates, Brain, 117, 1, 10.1093/brain/117.1.1-a · DOI
  9. A Beggs, 1991, Exploring the molecular basis for variability among patients with Becker muscular dystrophy: dystrophin gene and protein studies, Am J Hum Genet, 49, 54
  10. R Kaspar, 2009, Analysis of dystrophin deletion mutationspredicts age of cardiomyopathy onset in becker muscular dystrophy, Circ Cardiovasc Genet, 2, 544, 10.1161/CIRCGENETICS.109.867242 · DOI
  11. J van den Bergen, 2014, Dystrophin levels and clinical severity in Becker muscular dystrophy patients, J Neurol Neurosurg Psychiatry, 85, 747, 10.1136/jnnp-2013-306350 · DOI
  12. M Miyatake, 1989, Possible systemic smooth muscle layer dysfunction due to a deficiency of dystrophin in Duchenne muscular dystrophy, J Neurol Sci, 93, 11, 10.1016/0022-510X(89)90157-3 · DOI
  13. M Ho-Kim, 1992, Quantitative analysis of dystrophin in fast- and slow-twitch mammalian skeletal muscle, FEBS Lett, 304, 187, 10.1016/0014-5793(92)80615-N · DOI
  14. K Anthony, 2014, Dystrophin quantification; Biological and translational research implications, Neurology, 83, 2062, 10.1212/WNL.0000000000001025 · DOI
  15. C Beekman, 2014, A sensitive, reproducible and objective immunofluorescence analysis method of dystrophin in individual fibers in samples from patients with duchenne muscular dystrophy, PLoS One, 9, 1, 10.1371/journal.pone.0107494 · DOI
  16. L Taylor, 2012, Quantification of dystrophin immunofluorescence in dystrophinopathy muscle specimens, Neuropathol Appl Neurobiol, 38, 591, 10.1111/j.1365-2990.2012.01250.x · DOI
  17. S Cirak, 2011, Exon skipping and dystrophin restoration in patients with Duchenne muscular dystrophy after systemic phosphorodiamidate morpholino oligomer treatment: an open-label, phase 2, dose-escalation study, The Lancet, 378, 595, 10.1016/S0140-6736(11)60756-3 · DOI
  18. M Hulsker, 2016, Accurate Dystrophin Quantification in Mouse Tissue; Identification of New and Evaluation of Existing Methods, J Neuromuscul Dis, 3, 77, 10.3233/JND-150126 · DOI
  19. K Brown, 2012, Accurate Quantitation of Dystrophin Protein in Human Skeletal Muscle Using Mass Spectrometry, J Bioanal Biomed, Supplement 7, 001
  20. J McCourt, 2015, In vitro stability of therapeutically relevant, internally truncated dystrophins, Skelet Muscle, 5, 10.1186/s13395-015-0040-z · DOI
  21. U Nguyen, The Simple Western™: a gel-free, blot-free, hands-free Western blotting reinvention, Nat Methods, 8, 2011
  22. J Chen, 2013, Absolute quantitation of endogenous proteins with precision and accuracy using a capillary Western system, Anal Biochem, 442, 97, 10.1016/j.ab.2013.07.022 · DOI
  23. T Byers, 1991, The Subcellular Distribution of Dystrophin in Mouse Skeletal, Cardiac, and Smooth Muscle, J Cell Biol, 115, 411, 10.1083/jcb.115.2.411 · DOI
  24. M Gautel, 2011, The sarcomeric cytoskeleton: who picks up the strain?, Curr Opin Cell Biol, 23, 39, 10.1016/j.ceb.2010.12.001 · DOI
  25. S Carr, 2017, Mass spectrometry-based protein analysis to unravel the tissue pathophysiology in Duchenne muscular dystrophy, Proteomics Clin Appl
  26. C Doriguzzi, 1997, Systematic use of dystrophin testing in muscle biopsies: results in 201 cases, Eur J Clin Invest, 27, 352, 10.1046/j.1365-2362.1997.1090650.x · DOI
  27. V Arechavala-Gomeza, 2010, Revertant fibres and dystrophin traces in Duchenne muscular dystrophy: implication for clinical trials, Neuromuscul Disord, 20, 295, 10.1016/j.nmd.2010.03.007 · DOI
  28. K Anthony, 2011, Dystrophin quantification and clinical correlations in Becker muscular dystrophy: implications for clinical trials, Brain, 134, 3544, 10.1093/brain/awr291 · DOI

Cited by

Sorted by citations

Metadata

Authors
Beekman, C., Janson, A. A., Baghat, A., van Deutekom, J. C., & Datson, N. A.
Venue
PLOS ONE
Published
2018-04-11
Volume
13
Issue
4
Pages
e0195850
ISSN
1932-6203
Cited by
119
References
1
Language
en

About these checks

Registry, retraction, Cites and statistics results are computed, not judged, with one exception: a printed reference that no index lists is read once by a model before it counts as a citation error. Claims are extracted by a model and kept only when their quote appears verbatim in the text; each cited source is then checked, with a model’s help, for whether it says what the claim relies on. Those verdicts can be wrong — read the claim’s quote and the cited source before relying on one.

Statistics and arithmetic are recomputed, not judged.

Confidence bands are shown only for fields calibrated on our annotated test set. None is calibrated yet, so no band is shown.

What counts as a claim ›How we measure confidence ›How we check this ›

Are you an author, or do you see a problem with this page? Request a review