

The DOI matches its Crossref record; 25 of the 25 references it cites were found in a registry or an index.
An augmented reality sign-reading assistant for users with reduced vision
Open accessAbstract
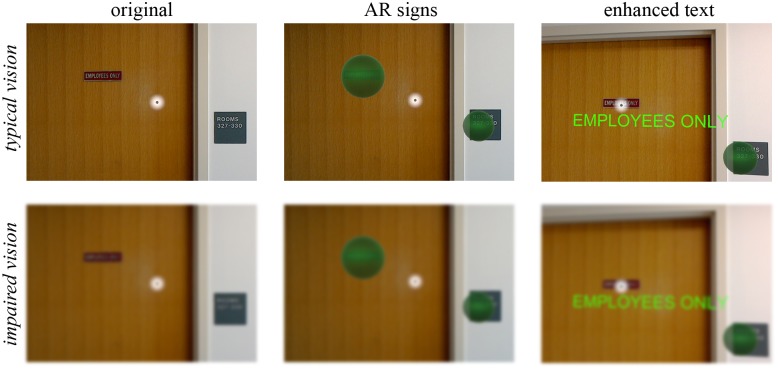
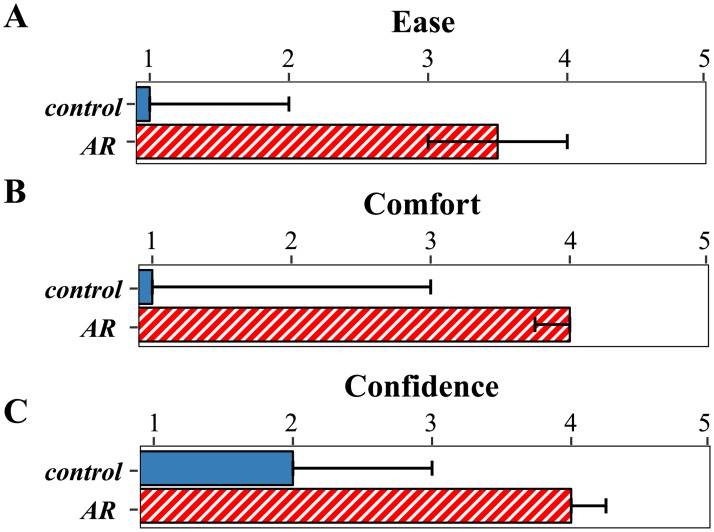
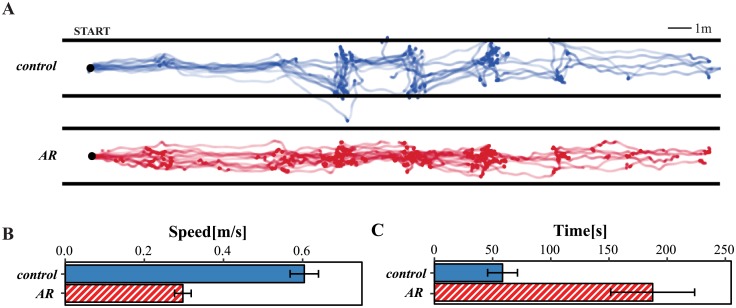
People typically rely heavily on visual information when finding their way to unfamiliar locations. For individuals with reduced vision, there are a variety of navigational tools available to assist with this task if needed. However, for wayfinding in unfamiliar indoor environments the applicability of existing tools is limited. One potential approach to assist with this task is to enhance visual information about the location and content of existing signage in the environment. With this aim, we developed a prototype software application, which runs on a consumer head-mounted augmented reality (AR) device, to assist visually impaired users with sign-reading. The sign-reading assistant identifies real-world text (e.g., signs and room numbers) on command, highlights the text location, converts it to high contrast AR lettering, and optionally reads the content aloud via text-to-speech. We assessed the usability of this application in a behavioral experiment. Participants with simulated visual impairment were asked to locate a particular office within a hallway, either with or without AR assistance (referred to as the AR group and control group, respectively). Subjective assessments indicated that participants in the AR group found the application helpful for this task, and an analysis of walking paths indicated that these participants took more direct routes compared to the control group. However, participants in the AR group also walked more slowly and took more time to complete the task than the control group. The results point to several specific future goals for usability and system performance in AR-based assistive tools.
Overview
The claims and statistics of this paper haven’t been checked yet.
Run the check — free, no account needed. It reads the open-access text and checks the sources it cites.
Integrity signals
Registry
Cites
Statistics
Figures
Verification
Claims the paper makes
The claims and statistics of this paper haven’t been checked yet.
Run the check — free, no account needed. It reads the open-access text and checks the sources it cites.
Claims other papers make about this one
Each is checked against this paper’s own text: does it say what the citing paper says it does?
The cited source says what the claim attributes to it.
In the citing paper
“It has been used for assistance during shopping [35], the climbing of stairs [33], and sign reading [11].”
From Pressing a Button You Cannot See: Evaluating Visual Designs to Assist Persons with Low Vision through Augmented Reality (2021) · cites this paper as [11]
Self-check
Percentages, sums and reported differences re-computed from the paper’s own numbers.
The self-check needs the paper’s full text.
Citations
Cites
What determines our navigational abilities?
Wolbers, T., & Hegarty, M. (2010) · Trends in Cognitive Sciences · doi:10.1016/j.tics.2010.01.001 · Cited by 889
Visual Impairment and Blindness in Adults in the United States
Varma, R., Vajaranant, T. S., Burkemper, B. S., Wu, S., Torres, M., Hsu, C., Choudhury, F., & McKean‐Cowdin, R. (2016) · JAMA Ophthalmology · doi:10.1001/jamaophthalmol.2016.1284 · Cited by 473
Human spatial navigation: cognitive maps, sexual dimorphism, and neural substrates
Maguire, E. A., Burgess, N., & O'Keefe, J. M. (1999) · Current Opinion in Neurobiology · doi:10.1016/s0959-4388(99)80023-3 · Cited by 342
An Augmented‐Reality Edge Enhancement Application for Google Glass
Hwang, A. D., & Peli, E. (2014) · Optometry and Vision Science · doi:10.1097/opx.0000000000000326 · Cited by 119
Fallah, N., Apostolopoulos, I., Bekris, K. E., & Folmer, E. (2012) · CHI Conference on Human Factors in Computing Systems · doi:10.1145/2207676.2207735 · Cited by 116
CueSee: exploring visual cues for people with low vision to facilitate a visual search task
Zhao, Y., Szpiro, S., Knighten, J., & Azenkot, S. (2016) · Proceedings of the 2016 ACM International Joint Conference on Pervasive and Ubiquitous Computing · doi:10.1145/2971648.2971730 · Cited by 111
Tian, Y., Yang, X., Yi, C., & Arditi, A. R. (2012) · Machine Vision and Applications · doi:10.1007/s00138-012-0431-7 · Cited by 105
Self-citationKim, J., Bessho, M., Kobayashi, S., Koshizuka, N., & Sakamura, K. (2016) · ACM Symposium on Applied Computing · doi:10.1145/2851613.2851716 · Cited by 100
Understanding Low Vision People's Visual Perception on Commercial Augmented Reality Glasses
Zhao, Y., Hu, M., Hashash, S., & Azenkot, S. (2017) · CHI Conference on Human Factors in Computing Systems · doi:10.1145/3025453.3025949 · Cited by 100
Head-Mounted Display Technology for Low-Vision Rehabilitation and Vision Enhancement
Ehrlich, J. R., Ojeda, L., Wicker, D., Day, S., Howson, A., Lakshminarayanan, V., & Moroi, S. E. (2017) · American Journal of Ophthalmology · doi:10.1016/j.ajo.2016.12.021 · Cited by 98
Indoor Navigation by People with Visual Impairment Using a Digital Sign System
Legge, G. E., Beckmann, P. J., Tjan, B. S., Havey, G., Kramer, K., Rolkosky, D., Gage, R., Chen, M., Puchakayala, S., & Rangarajan, A. (2013) · PLoS ONE · doi:10.1371/journal.pone.0076783 · Cited by 90
Clinical performance of electronic, head‐mounted, low‐vision devices
Culham, L. E., Chabra, A., & Rubin, G. S. (2004) · Ophthalmic and Physiological Optics · doi:10.1111/j.1475-1313.2004.00193.x · Cited by 83
Augmented-View for Restricted Visual Field: Multiple Device Implementations
Vargas-Martı́n, F., & Peli, E. (2002) · Optometry and Vision Science · doi:10.1097/00006324-200211000-00009 · Cited by 83
ISANA: Wearable Context-Aware Indoor Assistive Navigation with Obstacle Avoidance for the Blind
Li, B., Muñoz, J. P., Rong, X., Xiao, J., Tian, Y., & Arditi, A. R. (2016) · Lecture notes in computer science · doi:10.1007/978-3-319-48881-3_31 · Cited by 77
Optical Characterization of Bangerter Foils
Pérez, G. M., Archer, S. M., & Artal, P. (2010) · Investigative Ophthalmology & Visual Science · doi:10.1167/iovs.09-3726 · Cited by 76
Achieving Practical and Accurate Indoor Navigation for People with Visual Impairments
Ahmetovic, D., Murata, M., Gleason, C., Brady, E. L., Takagi, H., Kitani, K., & Asakawa, C. (2017) · International Web for All Conference (W4A) · doi:10.1145/3058555.3058560 · Cited by 66
Manduchi, R., & Coughlan, J. M. (2014) · CHI Conference on Human Factors in Computing Systems · doi:10.1145/2556288.2557328 · Cited by 43
Indoor navigational aid using active RFID and QR-code for sighted and blind people
Alghamdi, S. A., van Schyndel, R., & Alahmadi, A. H. (2013) · International Conference on Intelligent Sensors, Sensor Networks and Information Processing · doi:10.1109/issnip.2013.6529756 · Cited by 39
Easy Return: An App for Indoor Backtracking Assistance
Flores, G., & Manduchi, R. (2018) · CHI Conference on Human Factors in Computing Systems · doi:10.1145/3173574.3173591 · Cited by 34
Seeing Steps and Ramps with Simulated Low Acuity: Impact of Texture and Locomotion
Bochsler, T. M., Legge, G. E., Kallie, C. S., & Gage, R. (2012) · Optometry and Vision Science · doi:10.1097/opx.0b013e318264f2bd · Cited by 33
Roentgen, U. R., Gelderblom, G. J., & de Witte, L. (2011) · Journal of Visual Impairment & Blindness · doi:10.1177/0145482x1110501008 · Cited by 18
Zhang, D., Lee, D.-J., & Taylor, B. (2013) · Machine Vision and Applications · doi:10.1007/s00138-013-0575-0 · Cited by 17
Identification and Detection of Simple 3D Objects with Severely Blurred Vision
Kallie, C. S., Legge, G. E., & Yu, D. (2012) · Investigative Ophthalmology & Visual Science · doi:10.1167/iovs.12-10013 · Cited by 13
Smartphone based guidance system for visually impaired person
Asad, M. U., & Ikram, W. (2012) · International Conference on Image Processing Theory, Tools and Applications (IPTA) · doi:10.1109/ipta.2012.6469553 · Cited by 11
Legge, G. E. (2014) · Optometry and Vision Science · doi:10.1097/opx.0000000000000310 · Cited by 7
Cited by
Metaverse and Virtual Health Care in Ophthalmology: Opportunities and Challenges
Tan, T. F., Li, Y., Lim, J. S., Gunasekeran, D. V., Teo, Z. L., Ng, W. Y., & Ting, D. S. W. (2022) · Asia-Pacific Journal of Ophthalmology · doi:10.1097/apo.0000000000000537 · Cited by 224
Designing AR Visualizations to Facilitate Stair Navigation for People with Low Vision
Zhao, Y., Kupferstein, E., Castro, B., Feiner, S., & Azenkot, S. (2019) · ACM Symposium on User Interface Software and Technology (UIST) · doi:10.1145/3332165.3347906 · Cited by 108
Augmented reality for pedestrian evacuation research: Promises and limitations
Lovreglio, R., & Kinateder, M. T. (2020) · Safety Science · doi:10.1016/j.ssci.2020.104750 · Cited by 97
Self-citationThe Effectiveness of Visual and Audio Wayfinding Guidance on Smartglasses for People with Low Vision
Zhao, Y., Kupferstein, E., Rojnirun, H., Findlater, L., & Azenkot, S. (2020) · CHI Conference on Human Factors in Computing Systems · doi:10.1145/3313831.3376516 · Cited by 93
Virtual Reality and Augmented Reality in Ophthalmology: A Contemporary Prospective
Iskander, M., Ogunsola, T., Ramachandran, R., McGowan, R., & Al‐Aswad, L. A. (2021) · Asia-Pacific Journal of Ophthalmology · doi:10.1097/apo.0000000000000409 · Cited by 70
Metadata
- Authors
- Huang, J., Kinateder, M., Dunn, M. J., Jarosz, W., Yang, X.-D., & Cooper, E. A.
- Affiliations
- Dartmouth College (US)
- Cardiff University (GB)
- Corresponding author
- Huang, Jonathan
- Venue
- PLOS ONE
- Publisher
- Public Library of Science (PLoS)
- Published
- 2019-01-16
- Volume
- 14
- Issue
- 1
- Pages
- e0210630
- ISSN
- 1932-6203 (ISSN-L)
- PMC
- PMC6334915
- OpenAlex
- W2909795082
- Cited by
- 75
- References
- 25
- Citations by year
- 2026: 6 · 2025: 12 · 2024: 9 · 2023: 8 · 2022: 9 · 2021: 16 · 2020: 11 · 2019: 4
- FWCI
- 4.47
- Type
- journal article
- Language
- en
- Open access
- gold
- doi.org
- Licence
- Locations
- PLoS ONE (publishedVersion, cc-by)
- Europe PMC (PubMed Central) (publishedVersion, cc-by)
- PubMed Central (publishedVersion, cc-by)
- PubMed (publishedVersion)
- ORCA Online Research @Cardiff (Cardiff University) (acceptedVersion)
- NPARC (submittedVersion)
- DOAJ (DOAJ: Directory of Open Access Journals) (submittedVersion, cc-by-sa)
- eScholarship (California Digital Library) (submittedVersion)
- Funders
- Microsoft
- Oculus
- Topics
- Physical Sciences › Computer Science › Computer Vision and Pattern Recognition › Augmented Reality Applications
- Health Sciences › Health Professions › Occupational Therapy › Assistive Technology in Communication and Mobility
- Life Sciences › Neuroscience › Cognitive Neuroscience › Tactile and Sensory Interactions
- Keywords
- augmented reality, decreased vision, visual impairment, wayfinding, indoor navigation, head-mounted displays, text detection, text-to-speech, assistive technology, usability, route efficiency
- MeSH terms
- Virtual Reality, Female, Humans, Male, User-Computer Interface, Persons with Visual Disabilities, Visually Impaired Persons, Young Adult
About these checks
Registry, retraction, Cites and statistics results are computed, not judged, with one exception: a printed reference that no index lists is read once by a model before it counts as a citation error. Claims are extracted by a model and kept only when their quote appears verbatim in the text; each cited source is then checked, with a model’s help, for whether it says what the claim relies on. Those verdicts can be wrong — read the claim’s quote and the cited source before relying on one.
Statistics and arithmetic are recomputed, not judged.
Confidence bands are shown only for fields calibrated on our annotated test set. None is calibrated yet, so no band is shown.
What counts as a claim ›How we measure confidence ›How we check this ›
Are you an author, or do you see a problem with this page? Request a review
Data sources
Bibliographic data: Semantic Scholar, OpenAlex, Crossref.
Contains information from the Semantic Scholar Academic Graph Datasets, made available under the ODC Attribution License (ODC-BY 1.0).
Semantic Scholar’s data is described in: Kinney, R., et al. (2023). The Semantic Scholar Open Data Platform. arXiv:2301.10140.
