

The DOI matches its Crossref record; 43 of the 44 references it cites were found in a registry or an index.
An accurate, precise, and affordable light emitting diode spectrophotometer for drinking water and other testing with limited resources
Open accessAbstract
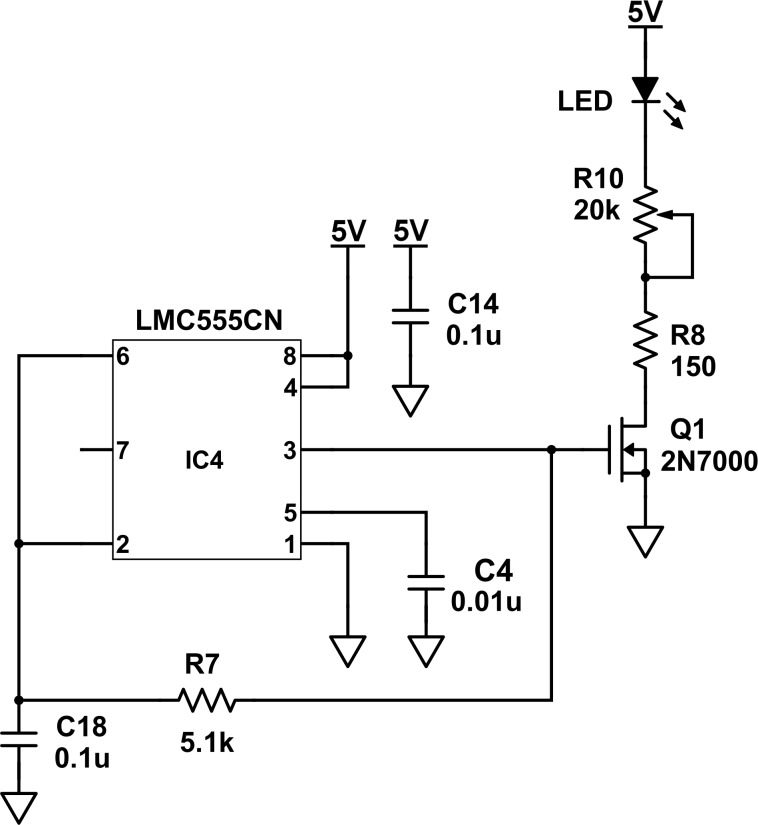
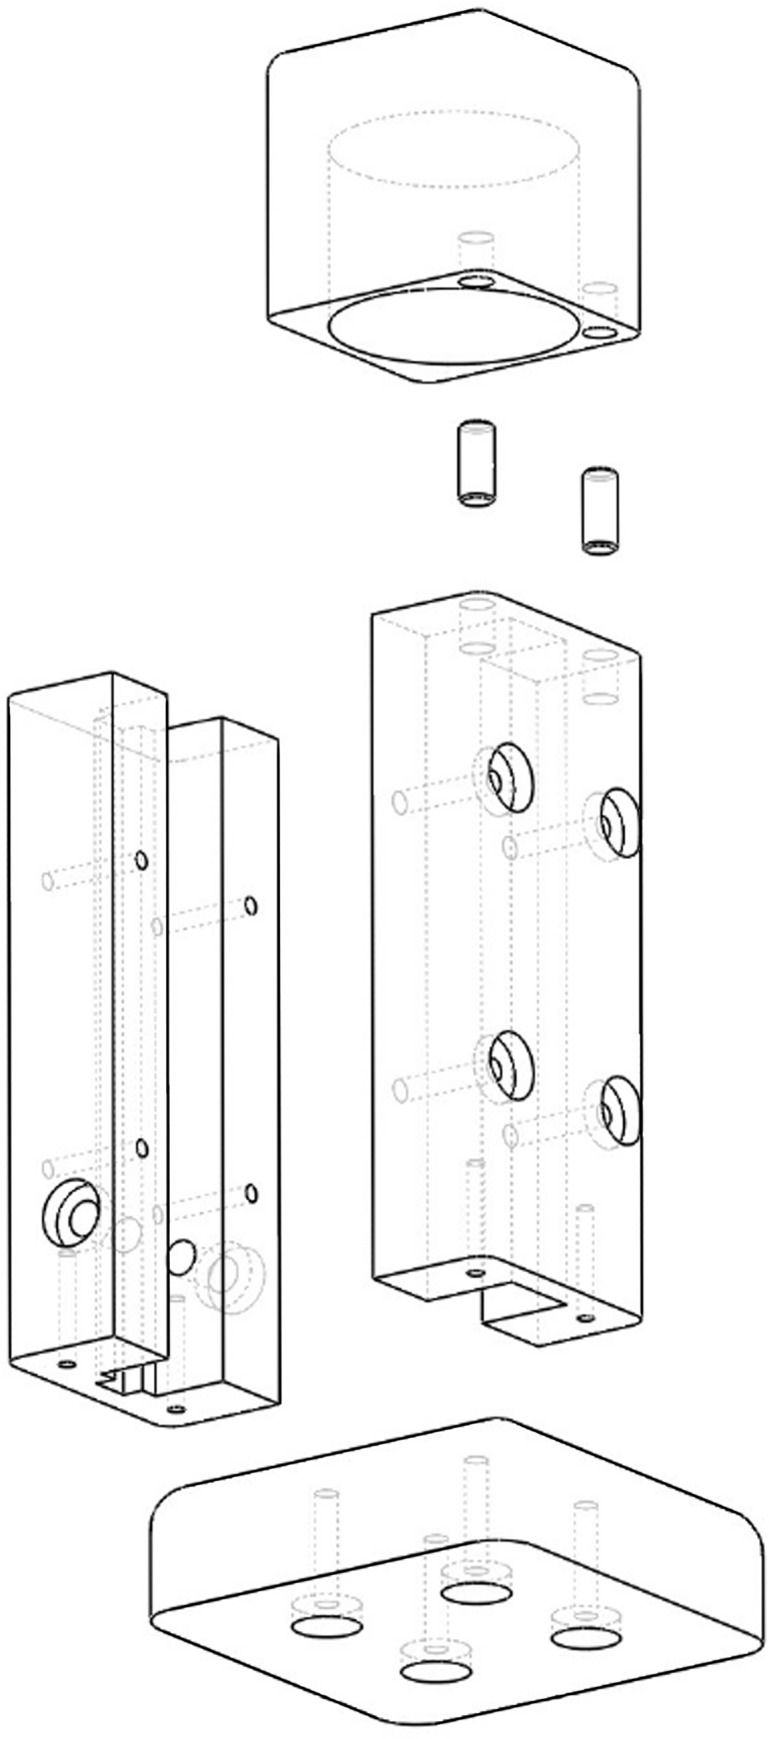
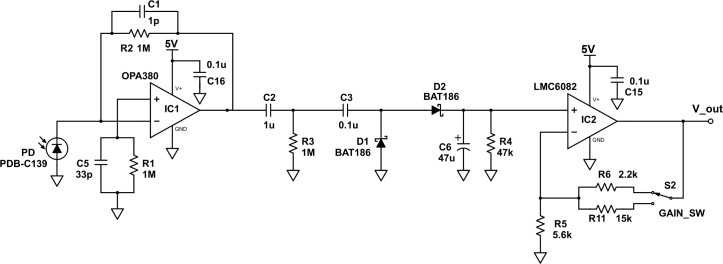
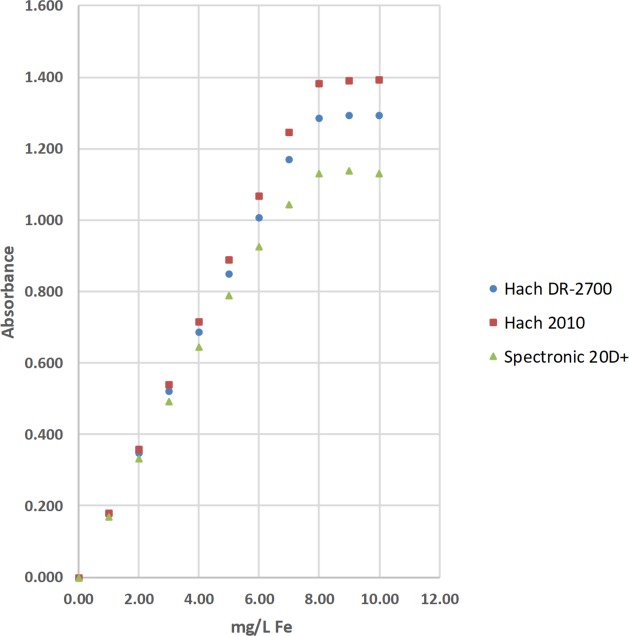
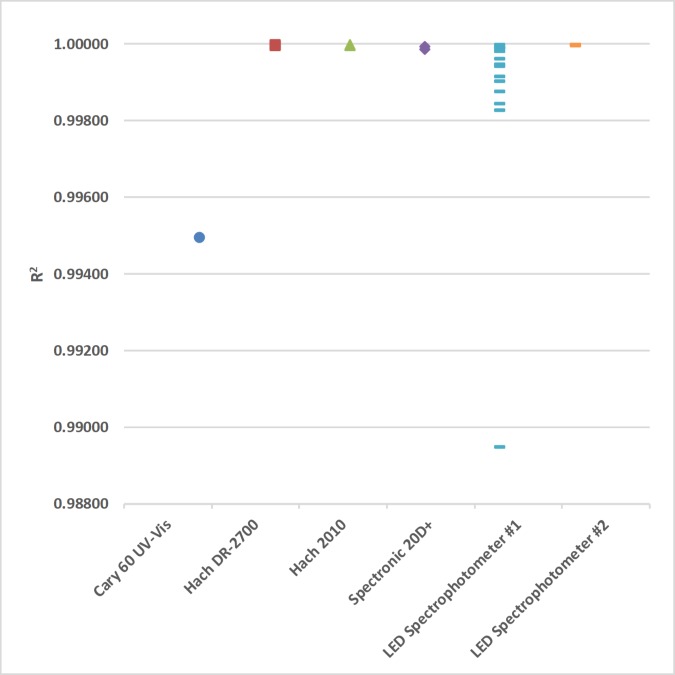
Spectrophotometers are commonly used to measure the concentrations of a wide variety of analytes in drinking water and other matrixes; however, many laboratories with limited resources cannot afford to buy these very useful instruments. To meet this need, an accurate, precise, and affordable light emitting diode (LED) spectrophotometer was designed and built using best engineering practices and modern circuit design. The cost and performance of this LED spectrophotometer was compared against 4 common commercial spectrophotometers. More specifically, the performance of these spectrophotometers was evaluated from the upper limits of linear range, upper limits of operational range, calibration sensitivities, R2 values, precisions of standards, estimated limits of detection, and percent calibration check standard recoveries for the determinations of iron (Fe), manganese (Mn), and fluoride (F-) in drinking water. This evaluation was done in the United States (U.S.) and India. Our LED spectrophotometer costs $63 United States Dollars (USD) for parts. The 4 commercial spectrophotometers ranged in cost from $2,424 to $7,644 USD. There are no practical differences in the upper limits of linear range, upper limits of operational range, R2 values, precisions of standards, and estimated limits of detection for our LED spectrophotometer and the 4 commercial spectrophotometers. For 2 of the 3 analytes, there is a practical difference in the calibration sensitivities our LED spectrophotometer and the 4 commercial spectrophotometers. More specifically, the calibration sensitivities for Mn and F- using our LED spectrophotometer were 65.2% and 67.0% of those using the 4 commercial spectrophotometers, respectively. In conclusion, this paper describes the design, use, and performance of an accurate, precise, and extremely affordable LED spectrophotometer for drinking water and other testing with limited resources.
Overview
The claims and statistics of this paper haven’t been checked yet.
Run the check — free, no account needed. It reads the open-access text and checks the sources it cites.
Integrity signals
Registry
Cites
Statistics
Figures
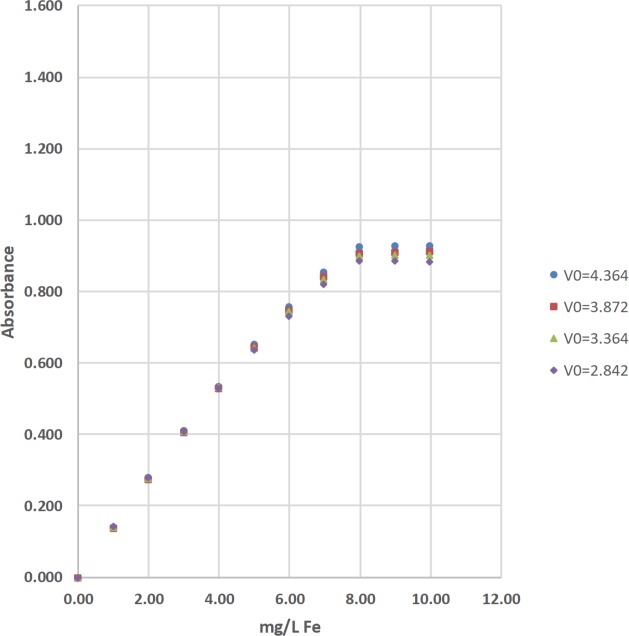
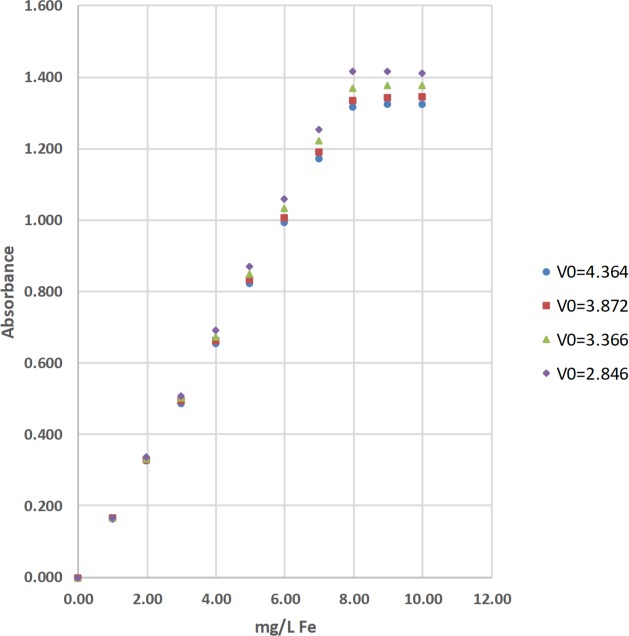
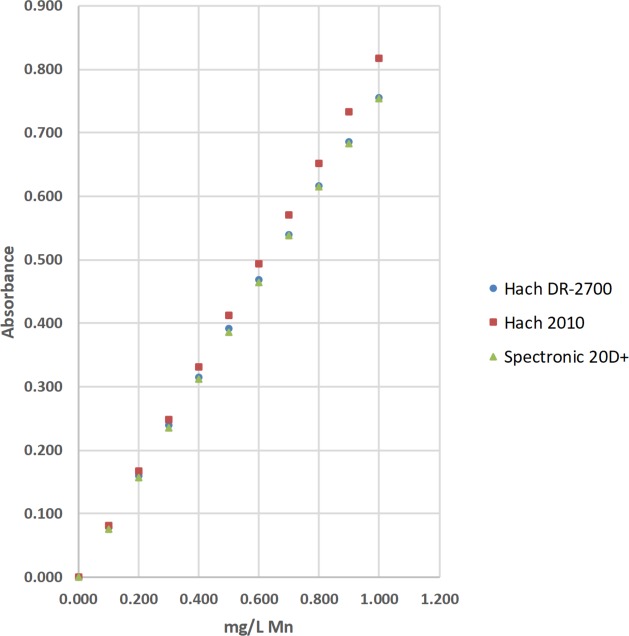
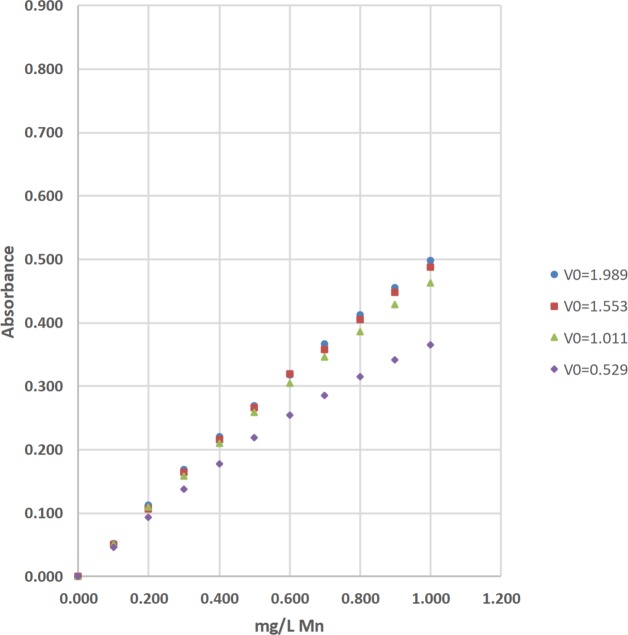
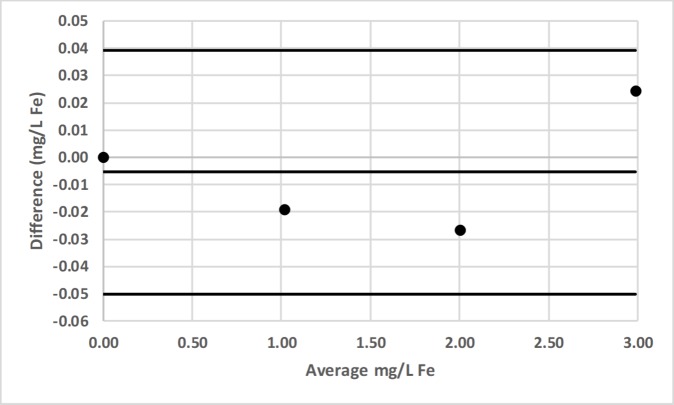
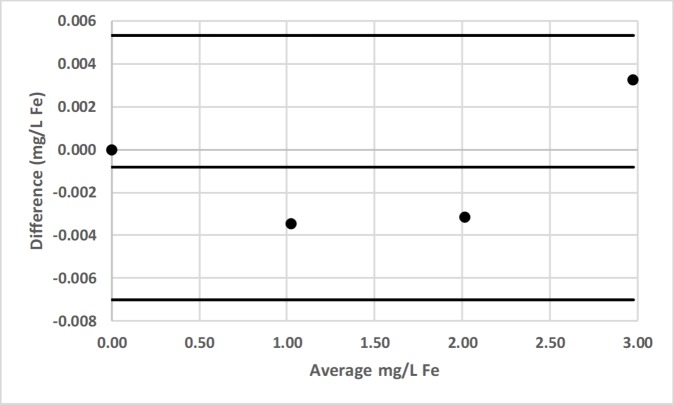
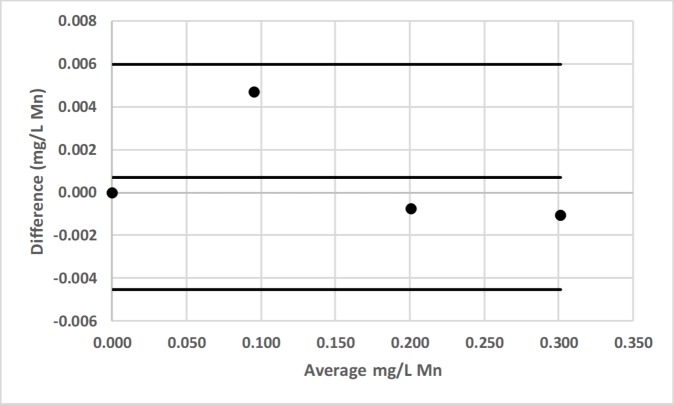
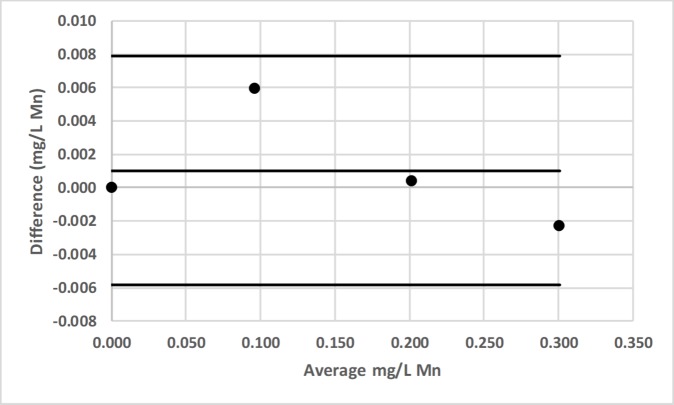
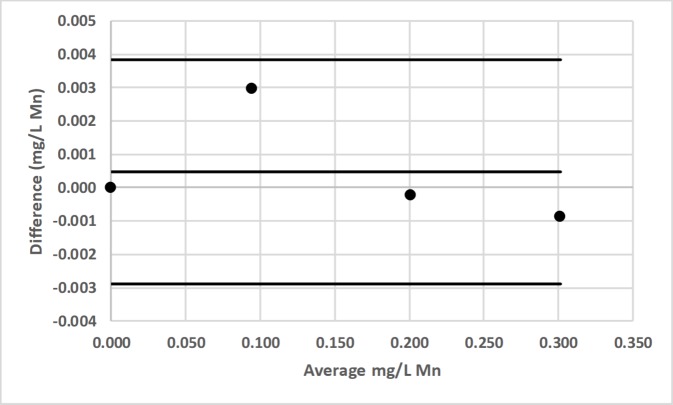
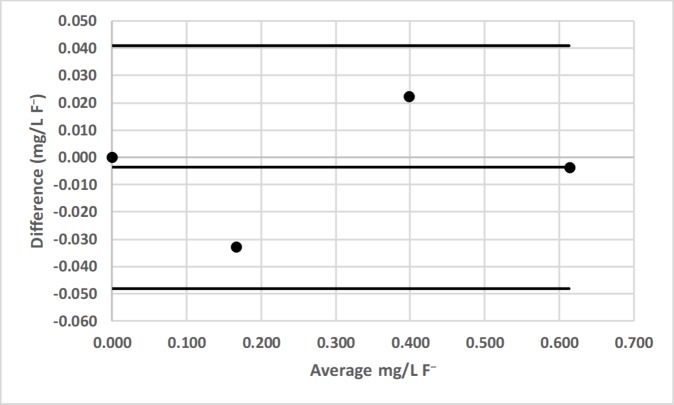
Verification
Claims the paper makes
The claims and statistics of this paper haven’t been checked yet.
Run the check — free, no account needed. It reads the open-access text and checks the sources it cites.
Claims other papers make about this one
Each is checked against this paper’s own text: does it say what the citing paper says it does?
The cited source doesn’t support the claim as written.
In the citing paper
“The absorbance value of a sample is inversely proportional to its concentration [31].”
From Cold Spray Process for Co-Deposition of Copper and Aluminum Particles (2023) · cites this paper as [31]
Checked by a reasoning model — may be wrong.
Experimental — accuracy not yet measured
Self-check
Percentages, sums and reported differences re-computed from the paper’s own numbers.
The self-check needs the paper’s full text.
Citations
Cites
Standard methods: For the examination of water and waste water
Water Environment Federation., Water Pollution Control Federation., American Water Works Association., & American Public Health Association. (1990) · Analytical Biochemistry · doi:10.1016/0003-2697(90)90598-4 · Cited by 72,107
Standard methods for the examination of water and wastewater
(2012) · Choice Reviews Online · doi:10.5860/choice.49-6910 · Cited by 14,303
Applied Linear Statistical Models
Ziegel, E. R., Neter, J., Wasserman, W., & Kutner, M. (1992) · Technometrics · doi:10.2307/1269588 · Cited by 9,906
UNITED STATES ENVIRONMENTAL PROTECTION AGENCY
Service, I., & Shirazi, M. A. (2005) · Proceedings of the Water Environment Federation · doi:10.2175/193864705783867675 · Cited by 6,679
Applied Linear Statistical Models.
Lorenz, F. O., Neter, J., Wasserman, W., & Kutner, M. (1986) · Journal of the American Statistical Association · doi:10.2307/2289108 · Cited by 5,566
Measurement in Medicine: The Analysis of Method Comparison Studies
Altman, D. G., & Bland, J. M. (1983) · The Statistician · doi:10.2307/2987937 · Cited by 4,300
Dhamu Kp Ramamoorthy, K. (2016) · Cited by 2,962
Quantitative Chemical Analysis
Harris, D. C. (1944) · Nature · doi:10.1038/154102c0 · Cited by 2,693
Compendium of chemical terminology
Gold, V. (1987) · Blackwell Scientific Publications eBooks · Cited by 2,535
Fundamentals of analytical chemistry
Skoog, D. A. (1963) · Cited by 2,234
Research works printed but not linked: 6
- Mestha LK, Hubble III FF, Love TL, Skinner G, Mihalyov KJ, Robbins DA, Diehl DM. Low Cost LED Based Spectrophotometer. In: Final Program and Proceedings of ICIS ‘06, International Congress of Imaging Science. Rochester, NY: Society for Imaging Science and Technology; 2006. pp. 95−98.
- S Davis, 2004, Electronic design, Power: LDO voltage regulators
- P Horowitz, 2015, The art of electronics, 16
- GD Christian, 1986, Analytical chemistry, 371
- World Health Organization (WHO), 2011, Guidelines for drinking-water quality, 472
- World Health Organization (WHO), 2017, Guidelines for drinking-water quality. Fourth edition incorporating the first addendum, 472
Cited by
Sorted by citations
Molecular Optical Analyzers Based on Smartphones for High School and Universities
Осколок, К. В., Моногарова, О. В., & Гармай, А. В. (2021) · Journal of Chemical Education · doi:10.1021/acs.jchemed.0c01089 · Cited by 21
Hagh, S. F., Amngostar, P., Chen, W., Sheridan, J., Williams, C. J., Morales‐Williams, A. M., Huston, D. R., & Xia, T. (2024) · IEEE Sensors Journal · doi:10.1109/jsen.2024.3403416 · Cited by 17
Lake, N. F., Martínez‐Carreras, N., Shaw, P. J., & Collins, A. L. (2021) · Journal of Soils and Sediments · doi:10.1007/s11368-021-03107-6 · Cited by 16
Vargas-Muñoz, M. A., Danchana, K., Cerdà, V., & Palacio, E. (2021) · Microchemical Journal · doi:10.1016/j.microc.2021.106774 · Cited by 11
Considerations for new manganese analytical techniques for drinking water quality management
Pei, Y., Prepas-Strobeck, N. S., Payne, S. J., & She, Z. (2022) · AWWA Water Science · doi:10.1002/aws2.1285 · Cited by 11
Metadata
- Authors
- Prairie, M. W., Frisbie, S. H., Rao, K. K., Saksri, A. H., Parbat, S., & Mitchell, E. J.
- Affiliations
- Norwich University (US)
- Indian Institute of Science Bangalore (IN)
- Corresponding author
- Frisbie, Seth H.
- Venue
- PLOS ONE
- Publisher
- Public Library of Science (PLoS)
- Published
- 2020-01-29
- Volume
- 15
- Issue
- 1
- Pages
- e0226761
- ISSN
- 1932-6203 (ISSN-L)
- PMC
- PMC6988917
- OpenAlex
- W3003391244
- Cited by
- 24
- References
- 44
- Citations by year
- 2026: 1 · 2025: 6 · 2024: 4 · 2023: 2 · 2022: 5 · 2021: 6
- FWCI
- 2.00
- Type
- journal article
- Language
- en
- Open access
- gold
- doi.org
- Licence
- Locations
- PLoS ONE (publishedVersion, cc-by)
- PubMed Central (publishedVersion, cc-by)
- PubMed (publishedVersion)
- NOT FOUND REPOSITORY (Indian Institute of Science Bangalore) (acceptedVersion)
- DOAJ (DOAJ: Directory of Open Access Journals) (submittedVersion, cc-by-sa)
- Figshare (submittedVersion, cc-by)
- Funders
- Ministry of Education, India
- Division of Human Resource Development
- Topics
- Physical Sciences › Environmental Science › Waste Management and Disposal › Water Quality Monitoring and Analysis
- Physical Sciences › Engineering › Biomedical Engineering › Biosensors and Analytical Detection
- Physical Sciences › Chemistry › Analytical Chemistry › Analytical Chemistry and Sensors
- Keywords
- low-cost instrumentation, drinking water analysis, iron determination, manganese determination, fluoride determination, calibration sensitivity, detection limit, low-resource laboratories
- MeSH terms
- Calibration, Fluorides, Humans, Iron, Light, Manganese, Spectrophotometry, Drinking Water
About these checks
Registry, retraction, Cites and statistics results are computed, not judged, with one exception: a printed reference that no index lists is read once by a model before it counts as a citation error. Claims are extracted by a model and kept only when their quote appears verbatim in the text; each cited source is then checked, with a model’s help, for whether it says what the claim relies on. Those verdicts can be wrong — read the claim’s quote and the cited source before relying on one.
Statistics and arithmetic are recomputed, not judged.
Confidence bands are shown only for fields calibrated on our annotated test set. None is calibrated yet, so no band is shown.
What counts as a claim ›How we measure confidence ›How we check this ›
Are you an author, or do you see a problem with this page? Request a review
How to cite
Cite CoChat for the checks on this page, and the paper for its own findings.
- This page
- CoChat. (2026). Citation check: An accurate, precise, and affordable light emitting diode spectrophotometer for drinking water and other testing with limited resources. https://app.cochat.ai/papers/10.1371/journal.pone.0226761
- The paper
- Prairie, M. W., Frisbie, S. H., Rao, K. K., Saksri, A. H., Parbat, S., & Mitchell, E. J. (2020). An accurate, precise, and affordable light emitting diode spectrophotometer for drinking water and other testing with limited resources. PLOS ONE. https://doi.org/10.1371/journal.pone.0226761
