

The DOI matches its Crossref record.
Characterization of the visceral and neuronal phenotype of 4L/PS-NA mice modeling Gaucher disease
Overview
The claims and statistics of this paper haven’t been checked yet.
Run the check — free, no account needed. It reads the open-access text and checks the sources it cites.
Integrity signals
Registry
Cites
Statistics
Figures
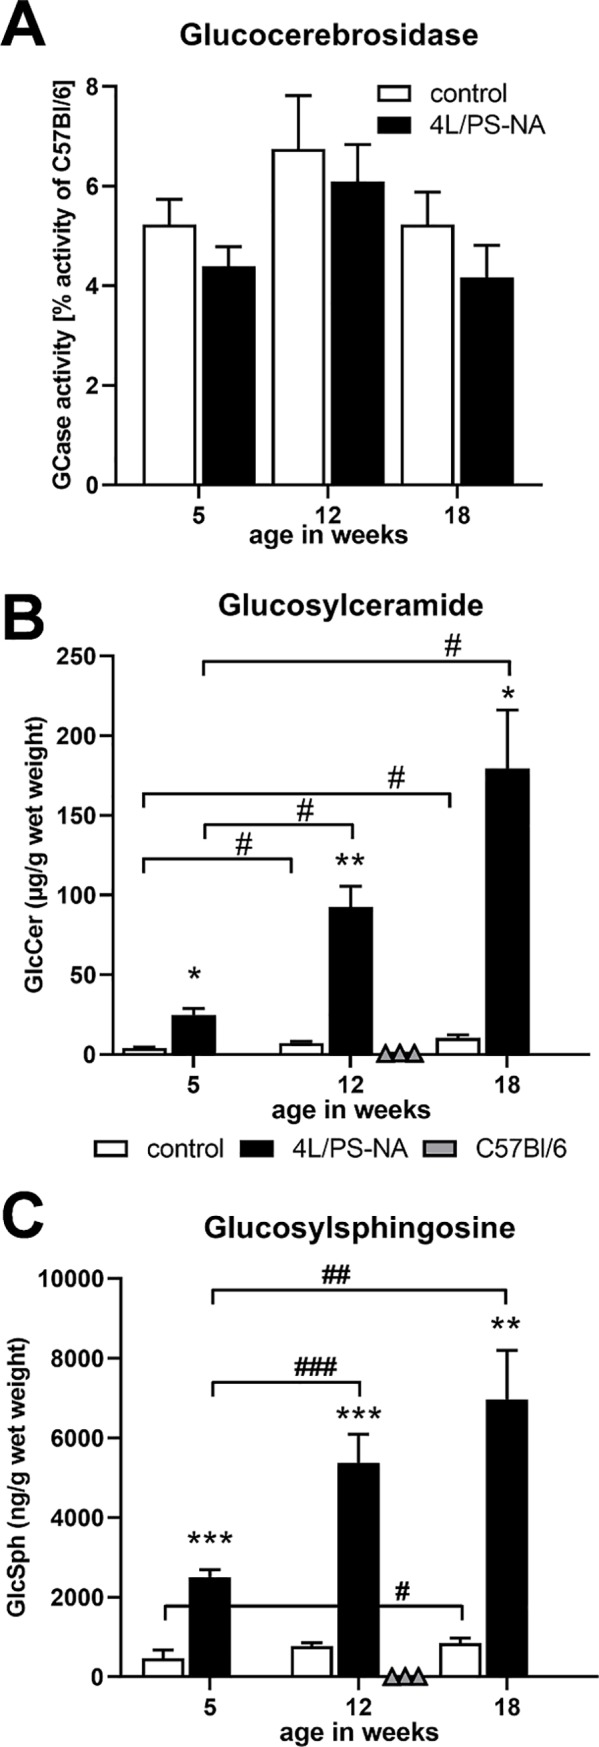
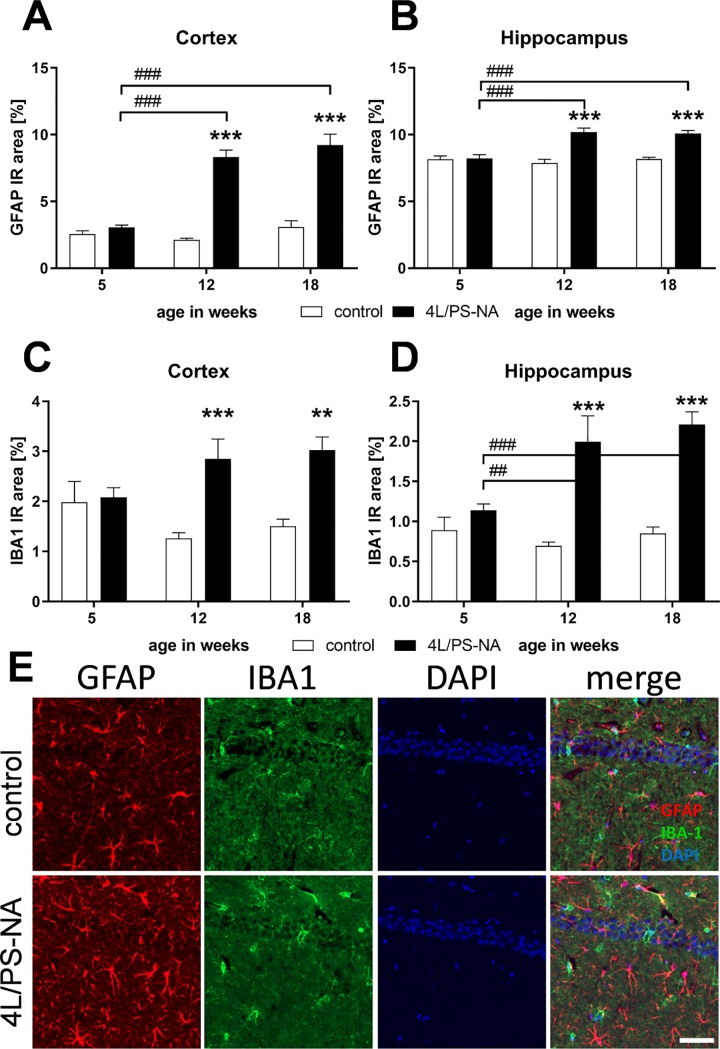
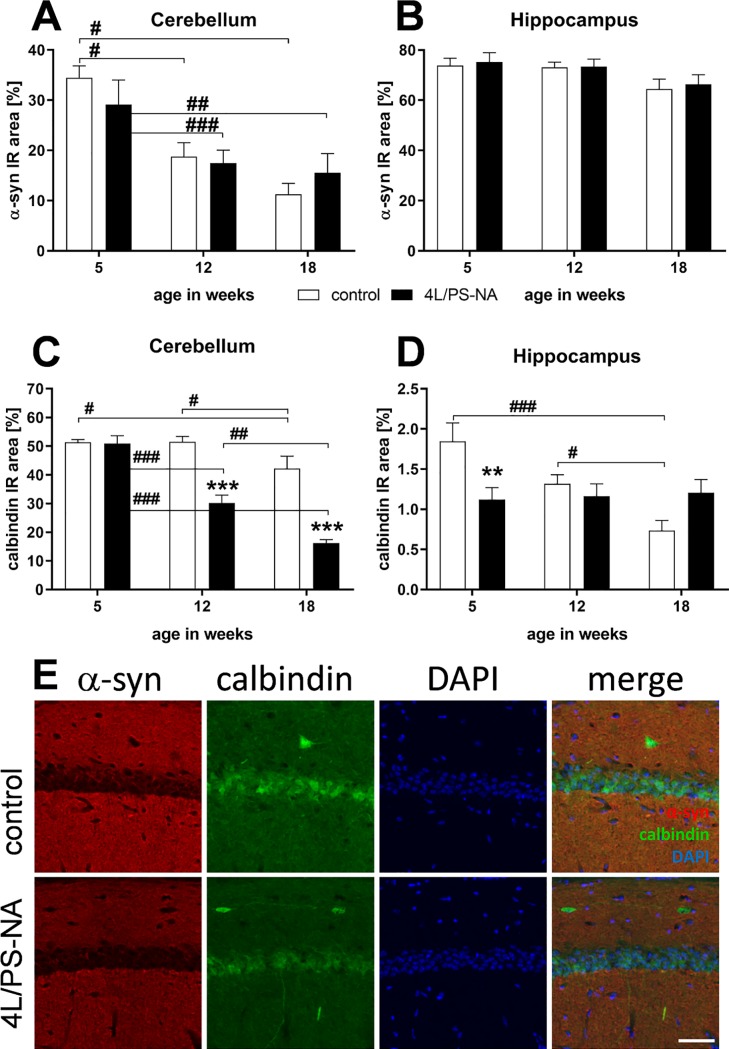
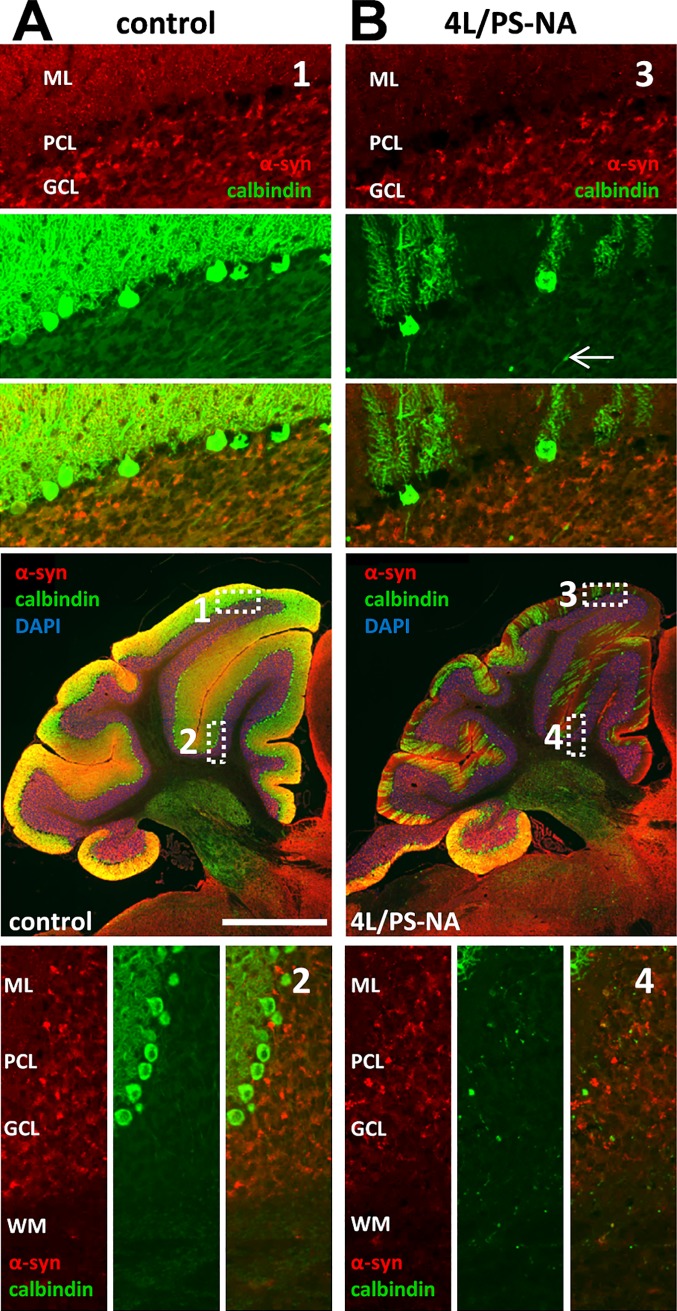
Verification
Claims the paper makes
The claims and statistics of this paper haven’t been checked yet.
Run the check — free, no account needed. It reads the open-access text and checks the sources it cites.
Claims other papers make about this one
Each is checked against this paper’s own text: does it say what the citing paper says it does?
In the citing paper
“The model contains three different genetic elements (43, 44); (i) a homozygous D409H mutation in the Gba1 gene (Gba1D409H) encoding a lysosomal enzyme glucocerebrosidase (GCase), (ii) a homozygous knock-out of Prosaposin (Psap), which is a known co-factor of GCase, and (iii) a Psap transgene (termed PS-NA), which renders overall PSAP protein quantity below 50%.”
From Treatment of a genetic brain disease by CNS-wide microglia replacement (2022) · cites this paper as [44]
In the citing paper
“This model combines mutant Gba1D409H and genetically reduced PSAP protein, which cause reduced GCase activity and GCase substrate accumulation and lead to pronounced CNS pathology (43, 44).”
From Treatment of a genetic brain disease by CNS-wide microglia replacement (2022) · cites this paper as [44]
Self-check
Percentages, sums and reported differences re-computed from the paper’s own numbers.
The self-check needs the paper’s full text.
Citations
Cites
No references could be resolved yet.
Research works printed but not linked: 48
- E Sidransky, 2009, Multicenter analysis of glucocerebrosidase mutations in Parkinson's disease, The New England journal of medicine, 361, 1651, 10.1056/NEJMoa0901281 · DOI · Paper page
- O Goker-Alpan, 2010, Glucocerebrosidase is present in alpha-synuclein inclusions in Lewy body disorders, Acta neuropathologica, 120, 641, 10.1007/s00401-010-0741-7 · DOI
- J Stirnemann, 2017, A Review of Gaucher Disease Pathophysiology, Clinical Presentation and Treatments, International journal of molecular sciences, 18, 10.3390/ijms18020441 · DOI
- K Weiss, 2015, The clinical management of Type 2 Gaucher disease, Molecular genetics and metabolism, 114, 110, 10.1016/j.ymgme.2014.11.008 · DOI
- Y Sun, 2002, Prosaposin: threshold rescue and analysis of the "neuritogenic" region in transgenic mice, Molecular genetics and metabolism, 76, 271, 10.1016/S1096-7192(02)00114-2 · DOI
- N Fujita, 1996, Targeted disruption of the mouse sphingolipid activator protein gene: a complex phenotype, including severe leukodystrophy and wide-spread storage of multiple sphingolipids, Human molecular genetics, 5, 711, 10.1093/hmg/5.6.711 · DOI
- VL Tybulewicz, 1992, Animal model of Gaucher's disease from targeted disruption of the mouse glucocerebrosidase gene, Nature, 357, 407, 10.1038/357407a0 · DOI
- E Sidransky, 1992, Gaucher disease in the neonate: a distinct Gaucher phenotype is analogous to a mouse model created by targeted disruption of the glucocerebrosidase gene, Pediatric research, 32, 494, 10.1203/00006450-199210000-00023 · DOI
- Y Liu, 1998, Mice with type 2 and 3 Gaucher disease point mutations generated by a single insertion mutagenesis procedure, Proceedings of the National Academy of Sciences of the United States of America, 95, 2503, 10.1073/pnas.95.5.2503 · DOI
- YH Xu, 2003, Viable mouse models of acid beta-glucosidase deficiency: the defect in Gaucher disease, The American journal of pathology, 163, 2093, 10.1016/S0002-9440(10)63566-3 · DOI · Paper page
- Y Sun, 2005, Gaucher disease mouse models: point mutations at the acid beta-glucosidase locus combined with low-level prosaposin expression lead to disease variants, Journal of lipid research, 46, 2102, 10.1194/jlr.M500202-JLR200 · DOI · Paper page
- A Rolfs, 2013, Glucosylsphingosine is a highly sensitive and specific biomarker for primary diagnostic and follow-up monitoring in Gaucher disease in a non-Jewish, Caucasian cohort of Gaucher disease patients, PloS one, 8, e79732, 10.1371/journal.pone.0079732 · DOI
- YH Xu, 2011, Accumulation and distribution of alpha-synuclein and ubiquitin in the CNS of Gaucher disease mouse models, Molecular genetics and metabolism, 102, 436, 10.1016/j.ymgme.2010.12.014 · DOI
- R Rabl, 2016, Quantitative evaluation of orofacial motor function in mice: The pasta gnawing test, a voluntary and stress-free behavior test, Journal of neuroscience methods, 274, 125, 10.1016/j.jneumeth.2016.10.006 · DOI
- R Rabl, 2017, Early start of progressive motor deficits in Line 61 alpha-synuclein transgenic mice, BMC neuroscience, 18, 22, 10.1186/s12868-017-0341-8 · DOI
- K Wong, 2004, Neuropathology provides clues to the pathophysiology of Gaucher disease, Molecular genetics and metabolism, 82, 192, 10.1016/j.ymgme.2004.04.011 · DOI
- MA Verity, 1977, Infantile Gaucher's disease: neuropathology, acid hydrolase activities and negative staining observations, Neuropadiatrie, 8, 89, 10.1055/s-0028-1091508 · DOI
- YH Xu, 2014, Multiple pathogenic proteins implicated in neuronopathic Gaucher disease mice, Human molecular genetics, 23, 3943, 10.1093/hmg/ddu105 · DOI
- JH Choi, 2011, Aggregation of alpha-synuclein in brain samples from subjects with glucocerebrosidase mutations, Molecular genetics and metabolism, 104, 185, 10.1016/j.ymgme.2011.06.008 · DOI
- JR Mazzulli, 2011, Gaucher disease glucocerebrosidase and alpha-synuclein form a bidirectional pathogenic loop in synucleinopathies, Cell, 146, 37, 10.1016/j.cell.2011.06.001 · DOI · Paper page
- M Abdelwahab, 2017, Previously unrecognized behavioral phenotype in Gaucher disease type 3, Neurology Genetics, 3, e158, 10.1212/NXG.0000000000000158 · DOI
- A Tylki-Szymanska, 2010, Neuronopathic Gaucher disease: demographic and clinical features of 131 patients enrolled in the International Collaborative Gaucher Group Neurological Outcomes Subregistry, Journal of inherited metabolic disease, 33, 339, 10.1007/s10545-009-9009-6 · DOI
- A Tajima, 2009, Clinical and genetic study of Japanese patients with type 3 Gaucher disease, Molecular genetics and metabolism, 97, 272, 10.1016/j.ymgme.2009.05.001 · DOI
- P Sorrentino, 2016, Impaired gait kinematics in type 1 Gaucher's Disease, Journal of Parkinson's disease, 6, 191, 10.3233/JPD-150660 · DOI
- M Abdelwahab, 2016, Long-term follow-up and sudden unexpected death in Gaucher disease type 3 in Egypt, Neurology Genetics, 2, e55, 10.1212/NXG.0000000000000055 · DOI
- J Charrow, 2000, The Gaucher registry: demographics and disease characteristics of 1698 patients with Gaucher disease, Archives of internal medicine, 160, 2835, 10.1001/archinte.160.18.2835 · DOI
- G Amir, 1999, Pulmonary pathology in Gaucher's disease, Hum Pathol, 30, 666, 10.1016/S0046-8177(99)90092-8 · DOI
- M Nishino, 2006, he thymus: a comprehensive review, TRadiographics: a review publication of the Radiological Society of North America, Inc, 26, 335, 10.1148/rg.262045213 · DOI
- Y Sun, 2010, Neuronopathic Gaucher disease in the mouse: viable combined selective saposin C deficiency and mutant glucocerebrosidase (V394L) mice with glucosylsphingosine and glucosylceramide accumulation and progressive neurological deficits, Human molecular genetics, 19, 1088, 10.1093/hmg/ddp580 · DOI
- R Hamler, 2017, Glucosylceramide and Glucosylsphingosine Quantitation by Liquid Chromatography-Tandem Mass Spectrometry to Enable In Vivo Preclinical Studies of Neuronopathic Gaucher Disease, Analytical chemistry, 89, 8288, 10.1021/acs.analchem.7b01442 · DOI
- EE Jones, 2017, Tissue Localization of Glycosphingolipid Accumulation in a Gaucher Disease Mouse Brain by LC-ESI-MS/MS and High-Resolution MALDI Imaging Mass Spectrometry, SLAS discovery: advancing life sciences R & D, 22, 1218, 10.1177/2472555217719372 · DOI
- M Fuller, 2015, Rapid, single-phase extraction of glucosylsphingosine from plasma: A universal screening and monitoring tool, Clinica chimica acta; international journal of clinical chemistry, 450, 6, 10.1016/j.cca.2015.07.026 · DOI
- V Murugesan, 2016, Glucosylsphingosine is a key biomarker of Gaucher disease, American journal of hematology, 91, 1082, 10.1002/ajh.24491 · DOI
- TA Burrow, 2015, CNS, lung, and lymph node involvement in Gaucher disease type 3 after 11 years of therapy: clinical, histopathologic, and biochemical findings, Molecular genetics and metabolism, 114, 233, 10.1016/j.ymgme.2014.08.011 · DOI
- EB Vitner, 2012, Contribution of brain inflammation to neuronal cell death in neuronopathic forms of Gaucher's disease, Brain: a journal of neurology, 135, 1724, 10.1093/brain/aws095 · DOI · Paper page
- T Farfel-Becker, 2011, Spatial and temporal correlation between neuron loss and neuroinflammation in a mouse model of neuronopathic Gaucher disease, Human molecular genetics, 20, 1375, 10.1093/hmg/ddr019 · DOI
- EI Ginns, 2014, Neuroinflammation and alpha-synuclein accumulation in response to glucocerebrosidase deficiency are accompanied by synaptic dysfunction, Molecular genetics and metabolism, 111, 152, 10.1016/j.ymgme.2013.12.003 · DOI
- C Ran, 2016, Strong association between glucocerebrosidase mutations and Parkinson's disease in Sweden, Neurobiology of aging, 45, 212 e5, 10.1016/j.neurobiolaging.2016.04.022 · DOI
- Y Li, 2015, Gaucher-Associated Parkinsonism, Cellular and molecular neurobiology, 35, 755, 10.1007/s10571-015-0176-8 · DOI
- L Vilageliu, 2017, Involvement of Gaucher Disease Mutations in Parkinson Disease, Curr Protein Pept Sci, 18, 758, 10.2174/1389203717666160311115956 · DOI
- G Maor, 2019, The effect of mutant GBA1 on accumulation and aggregation of alpha-synuclein, Human molecular genetics
- YV Taguchi, 2017, Glucosylsphingosine Promotes alpha-Synuclein Pathology in Mutant GBA-Associated Parkinson's Disease. The Journal of neuroscience: the official journal of the, Society for Neuroscience, 37, 9617
- V Cullen, 2011, Acid beta-glucosidase mutants linked to Gaucher disease, Parkinson disease, and Lewy body dementia alter alpha-synuclein processing, Annals of neurology, 69, 940, 10.1002/ana.22400 · DOI
- T Pampols, 1999, Neuronopathic juvenile glucosylceramidosis due to sap-C deficiency: clinical course, neuropathology and brain lipid composition in this Gaucher disease variant, Acta neuropathologica, 97, 91, 10.1007/s004010050960 · DOI
- N Conradi, 1991, Late-infantile Gaucher disease in a child with myoclonus and bulbar signs: neuropathological and neurochemical findings, Acta neuropathologica, 82, 152, 10.1007/BF00293959 · DOI
- A Yoneshige, 2010, A mutation in the saposin C domain of the sphingolipid activator protein (Prosaposin) gene causes neurodegenerative disease in mice, Journal of neuroscience research, 88, 2118, 10.1002/jnr.22371 · DOI
- Y Sun, 2010, Specific saposin C deficiency: CNS impairment and acid beta-glucosidase effects in the mouse, Human molecular genetics, 19, 634, 10.1093/hmg/ddp531 · DOI
- H Mizukami, 2002, Systemic inflammation in glucocerebrosidase-deficient mice with minimal glucosylceramide storage, The Journal of clinical investigation, 109, 1215, 10.1172/JCI0214530 · DOI
Cited by
Treatment of a genetic brain disease by CNS-wide microglia replacement
Shibuya, Y., Kumar, K. K., Mader, M. M.-D., Yoo, Y., Ayala, L. A., Zhou, M., Mohr, M. A., Neumayer, G., Kumar, I., Yamamoto, R., et al. (2022) · Science Translational Medicine · doi:10.1126/scitranslmed.abl9945 · Cited by 126
Self-citation
Metadata
- Authors
- Schiffer, V., Santiago-Mujika, E., Flunkert, S., Schmidt, S., Farcher, M., Loeffler, T., Schilcher, I., Posch, M., Neddens, J., Sun, Y., Kehr, J., & Hutter-Paier, B.
- ORCID
- Flunkert, Stefanie
- Venue
- PLOS ONE
- Publisher
- Public Library of Science (PLoS)
- Published
- 2020-01-13
- Volume
- 15
- Issue
- 1
- Pages
- e0227077
- ISSN
- 1932-6203
- PMC
- PMC6957154
- Cited by
- 11
- References
- 0
- Language
- en
About these checks
Registry, retraction, Cites and statistics results are computed, not judged, with one exception: a printed reference that no index lists is read once by a model before it counts as a citation error. Claims are extracted by a model and kept only when their quote appears verbatim in the text; each cited source is then checked, with a model’s help, for whether it says what the claim relies on. Those verdicts can be wrong — read the claim’s quote and the cited source before relying on one.
Statistics and arithmetic are recomputed, not judged.
Confidence bands are shown only for fields calibrated on our annotated test set. None is calibrated yet, so no band is shown.
What counts as a claim ›How we measure confidence ›How we check this ›
Are you an author, or do you see a problem with this page? Request a review
