

The DOI matches its Crossref record; 55 of the 55 references it cites were found in a registry or an index.
Combining explainable machine learning, demographic and multi-omic data to inform precision medicine strategies for inflammatory bowel disease
Open accessPublished version of a preprint
Abstract
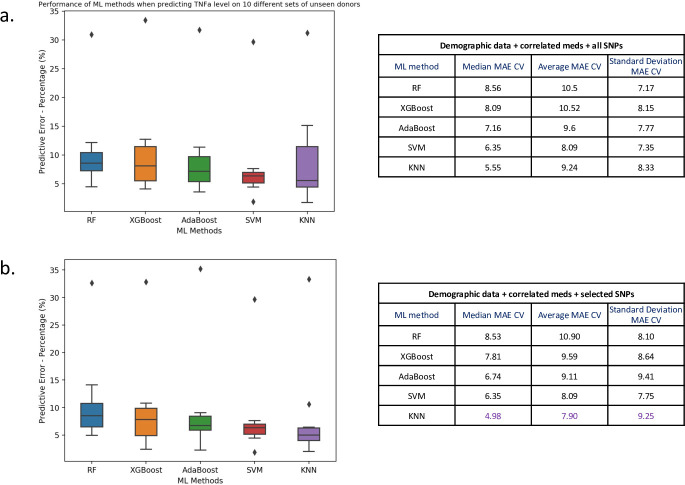
Inflammatory bowel diseases (IBDs), including ulcerative colitis and Crohn’s disease, affect several million individuals worldwide. These diseases are heterogeneous at the clinical, immunological and genetic levels and result from complex host and environmental interactions. Investigating drug efficacy for IBD can improve our understanding of why treatment response can vary between patients. We propose an explainable machine learning (ML) approach that combines bioinformatics and domain insight, to integrate multi-modal data and predict inter-patient variation in drug response. Using explanation of our models, we interpret the ML models’ predictions to infer unique combinations of important features associated with pharmacological responses obtained during preclinical testing of drug candidates in ex vivo patient-derived fresh tissues. Our inferred multi-modal features that are predictive of drug efficacy include multi-omic data (genomic and transcriptomic), demographic, medicinal and pharmacological data. Our aim is to understand variation in patient responses before a drug candidate moves forward to clinical trials. As a pharmacological measure of drug efficacy, we measured the reduction in the release of the inflammatory cytokine TNFα from the fresh IBD tissues in the presence/absence of test drugs. We initially explored the effects of a mitogen-activated protein kinase (MAPK) inhibitor; however, we later showed our approach can be applied to other targets, test drugs or mechanisms of interest. Our best model predicted TNFα levels from demographic, medicinal and genomic features with an error of only 4.98% on unseen patients. We incorporated transcriptomic data to validate insights from genomic features. Our results showed variations in drug effectiveness (measured by ex vivo assays) between patients that differed in gender, age or condition and linked new genetic polymorphisms to patient response variation to the anti-inflammatory treatment BIRB796 (Doramapimod). Our approach models IBD drug response while also identifying its most predictive features as part of a transparent ML precision medicine strategy.
Overview
The claims and statistics of this paper haven’t been checked yet.
Free: it reads the open-access text and checks the first 5 claims that cite a source we can check. Create a free account to check every claim.
Integrity signals
Registry
Cites
Statistics
Figures


Verification
Claims the paper makes
The claims and statistics of this paper haven’t been checked yet.
Free: it reads the open-access text and checks the first 5 claims that cite a source we can check. Create a free account to check every claim.
Claims other papers make about this one
Each is checked against this paper’s own text: does it say what the citing paper says it does?
In the citing paper
“AI's potential extends further, integrating diverse data types from IBD datasets, including clinical, endoscopic, histologic, and OMICs, enabling a multi-parametric analysis that can further enhance the quality of clinical trial outcomes towards precision medicine.78”
From Artificial intelligence and endo-histo-omics: new dimensions of precision endoscopy and histology in inflammatory bowel disease (2024) · cites this paper as [78]
Self-check
Percentages, sums and reported differences re-computed from the paper’s own numbers.
The self-check needs the paper’s full text.
Citations
Cites
Trimmomatic: a flexible trimmer for Illumina sequence data
Bolger, A. M., Lohse, M., & Usadel, B. (2014) · Bioinformatics · doi:10.1093/bioinformatics/btu170 · Cited by 65,548
The Sequence Alignment/Map format and SAMtools
Li, H., Handsaker, B., Wysoker, A., Fennell, T., Ruan, J., Homer, N., Marth, G., Abecasis, G., Durbin, R., & 1000 Genome Project Data Processing Subgroup (2009) · Bioinformatics · doi:10.1093/bioinformatics/btp352 · Cited by 62,041 · cited 1×
“10 [48] and duplicate removal was performed using MarkDuplicates v2.”
MethodCortes, C., & Vapnik, V. (1995) · Machine Learning · doi:10.1007/bf00994018 · Cited by 59,421 · cited 1×
“We evaluated the application of five state-of-art machine learning models; random forest (RF) [52], XGBoost [53], Support Vector Machines (SVM) [54], K-Nearest Neighbors (KNN) [55] and Adaboost [56].”
XGBoost: A Scalable Tree Boosting System
Chen, T., & Guestrin, C. (2016) · Proceedings of the 22nd ACM SIGKDD International Conference on Knowledge Discovery and Data Mining · doi:10.1145/2939672.2939785 · Cited by 54,569 · cited 3×
“We evaluated the application of five state-of-art machine learning models; random forest (RF) [52], XGBoost [53], Support Vector Machines (SVM) [54], K-Nearest Neighbors (KNN) [55] and Adaboost [56].”
MethodInfluentialRobinson, M. D., McCarthy, D. J., & Smyth, G. K. (2010) · Bioinformatics · doi:10.1093/bioinformatics/btp616 · Cited by 41,364 · cited 1×
“Gene expression levels were quantified using StringTie [50] and the raw expression counts per gene, were subsequently normalised across the 14 patients using EdgeR to generate TMM values [51].”
MethodA Unified Approach to Interpreting Model Predictions
Lundberg, S., & Lee, S.-I. (2017) · arXiv · doi:10.48550/arxiv.1705.07874 · Cited by 23,707
Gauriat, C.-M., Pencolé, Y., Ribot, P., & Brouillet, G. (2024) · HAL (Le Centre pour la Communication Scientifique Directe) · doi:10.4230/oasics.dx.2024.27 · Cited by 12,586
Transcript-level expression analysis of RNA-seq experiments with HISAT, StringTie and Ballgown
Pertea, M., Kim, D., Pertea, G. M., Leek, J. T., & Salzberg, S. L. (2016) · Nature Protocols · doi:10.1038/nprot.2016.095 · Cited by 6,845 · cited 1×
“Gene expression levels were quantified using StringTie [50] and the raw expression counts per gene, were subsequently normalised across the 14 patients using EdgeR to generate TMM values [51].”
MethodAn Introduction to Kernel and Nearest-Neighbor Nonparametric Regression
Altman, N. S. (1992) · The American Statistician · doi:10.1080/00031305.1992.10475879 · Cited by 5,708 · cited 1×
“We evaluated the application of five state-of-art machine learning models; random forest (RF) [52], XGBoost [53], Support Vector Machines (SVM) [54], K-Nearest Neighbors (KNN) [55] and Adaboost [56].”
MethodHo, T. K. (2002) · Proceedings of 3rd International Conference on Document Analysis and Recognition · doi:10.1109/icdar.1995.598994 · Cited by 5,054
Research works printed but not linked: 1
- S.M. Carlton, 2013, Encyclopedia of Pain
Cited by
Role of protein phosphorylation in cell signaling, disease, and the intervention therapy
Pang, K., Wang, W., Qin, J., Shi, Z., Hao, L., Ma, Y., Xu, H., Wu, Z., Pan, D., Chen, Z., et al. (2022) · MedComm · doi:10.1002/mco2.175 · Cited by 178
Sel, K., Hawkins-Daarud, A. J., Chaudhuri, A., Osman, D., Bahai, A. R. S., Paydarfar, D., Willcox, K. E., Chung, C., & Jafari, R. (2025) · npj Digital Medicine · doi:10.1038/s41746-025-01447-y · Cited by 179
Iacucci, M., Santacroce, G., Zammarchi, I., Maeda, Y., Del Amor, R., Meseguer, P., Kolawole, B. B., Chaudhari, U., Di Sabatino, A., Danese, S., et al. (2024) · The Lancet Gastroenterology & Hepatology · doi:10.1016/s2468-1253(24)00053-0 · Cited by 73
Omics and Multi-Omics in IBD: No Integration, No Breakthroughs
Fiocchi, C. (2023) · International Journal of Molecular Sciences · doi:10.3390/ijms241914912 · Cited by 67
Cannarozzi, A. L., Latiano, A., Massimino, L., Bossa, F., Giuliani, F., Riva, M., Ungaro, F., Guerra, M., Brina, A. L. D., Biscaglia, G., et al. (2024) · United European Gastroenterology Journal · doi:10.1002/ueg2.12655 · Cited by 65
Metadata
- Authors
- Gardiner, L.-J., Carrieri, A. P., Bingham, K., Macluskie, G., Bunton, D., McNeil, M., & Pyzer-Knapp, E. O.
- Affiliations
- Sci-Tech Daresbury (GB)
- ReproCELL (United Kingdom) (GB)
- Queen Elizabeth University Hospital (GB)
- Corresponding author
- Gardiner, Laura-Jayne
- Carrieri, Anna Paola
- Venue
- PLOS ONE
- Publisher
- Public Library of Science (PLoS)
- Published
- 2022-02-23
- Volume
- 17
- Issue
- 2
- Pages
- e0263248
- ISSN
- 1932-6203 (ISSN-L)
- PMC
- PMC8865677
- OpenAlex
- W4213237113
- Cited by
- 36
- References
- 53
- Citations by year
- 2026: 7 · 2025: 10 · 2024: 7 · 2023: 9 · 2022: 2
- FWCI
- 4.22
- Type
- journal article
- Language
- en
- Open access
- gold
- doi.org
- Licence
- Locations
- PLoS ONE (publishedVersion, cc-by)
- medRxiv (acceptedVersion, cc-by-nd)
- PubMed Central (publishedVersion, cc-by)
- PubMed (publishedVersion)
- DOAJ (DOAJ: Directory of Open Access Journals) (submittedVersion, cc-by-sa)
- Science and Technology Facilities Council (submittedVersion, cc-by)
- Funders
- UK Research and Innovation (Hartree National Centre for Digital Innovation)
- Scottish Funding Council (Precision Medicine Scotland Innovation Centre (PMS-IC))
- Topics
- Health Sciences › Medicine › Gastroenterology › Inflammatory Bowel Disease
- Life Sciences › Pharmacology, Toxicology and Pharmaceutics › Drug Discovery › Computational Drug Discovery Methods
- Life Sciences › Biochemistry, Genetics and Molecular Biology › Genetics › Genetic Associations and Epidemiology
- Keywords
- inflammatory bowel disease, Crohn's disease, ulcerative colitis, precision medicine, explainable machine learning, drug response prediction, interpatient variability, multi-omics integration, MAPK inhibitors, genetic polymorphism, transcriptomics, demographic predictors, precision dosing
- MeSH terms
- Machine Learning, Adolescent, Adult, Aged, Anti-Inflammatory Agents, Non-Steroidal, Colitis, Ulcerative, Crohn Disease, Drug Evaluation, Preclinical, Female, Humans, Male, Middle Aged, Naphthalenes, Phenylurea Compounds, Prednisolone, Pyrazoles, Tumor Necrosis Factor-alpha, Signal Transduction, Mesalamine, Genomics, Young Adult, Precision Medicine, Transcriptome
About these checks
Registry, retraction, Cites and statistics results are computed, not judged, with one exception: a printed reference that no index lists is read once by a model before it counts as a citation error. Claims are extracted by a model and kept only when their quote appears verbatim in the text; each cited source is then checked, with a model’s help, for whether it says what the claim relies on. Those verdicts can be wrong — read the claim’s quote and the cited source before relying on one.
Statistics and arithmetic are recomputed, not judged.
Confidence bands are shown only for fields calibrated on our annotated test set. None is calibrated yet, so no band is shown.
What counts as a claim ›How we measure confidence ›How we check this ›
Are you an author, or do you see a problem with this page? Request a review
How to cite
Cite CoChat for the checks on this page, and the paper for its own findings.
- This page
- CoChat. (2026). Citation check: Combining explainable machine learning, demographic and multi-omic data to inform precision medicine strategies for inflammatory bowel disease. https://app.cochat.ai/papers/10.1371/journal.pone.0263248
- The paper
- Gardiner, L.-J., Carrieri, A. P., Bingham, K., Macluskie, G., Bunton, D., McNeil, M., & Pyzer-Knapp, E. O. (2022). Combining explainable machine learning, demographic and multi-omic data to inform precision medicine strategies for inflammatory bowel disease. PLOS ONE. https://doi.org/10.1371/journal.pone.0263248
Data sources
Bibliographic data: Semantic Scholar, OpenAlex, Crossref.
Contains information from the Semantic Scholar Academic Graph Datasets, made available under the ODC Attribution License (ODC-BY 1.0).
Semantic Scholar’s data is described in: Kinney, R., et al. (2023). The Semantic Scholar Open Data Platform. arXiv:2301.10140.
