

Estimating microbial population data from optical density
Open accessPublished version of a preprint
The DOI matches its Crossref record; 18 of the 19 references it cites were found in a registry or an index; 7 of the 16 sources its claims cite were checked for support.
Abstract
The spectrophotometer has been used for decades to measure the density of bacterial populations as the turbidity expressed as optical density–OD. However, the OD alone is an unreliable metric and is only proportionately accurate to cell titers to about an OD of 0.1. The relationship between OD and cell titer depends on the configuration of the spectrophotometer, the length of the light path through the culture, the size of the bacterial cells, and the cell culture density.
Overview
CoChat Summary
## TL;DR
This paper shows that optical density (OD) alone is not a reliable proxy for microbial population density beyond about OD 0.1, and that converting OD to cells/mL requires calibration specific to the instrument, plate format, and species. Using four bacterial genera on 96- and 384-well plates, the authors find species- and plate-specific calibration curves and argue that cells/mL is the better metric for comparing experiments across labs and instruments.
## Key findings
- OD is only proportionately accurate to cell titers to about OD 0.1; above that, OD underestimates true population density as cells/mL increases.
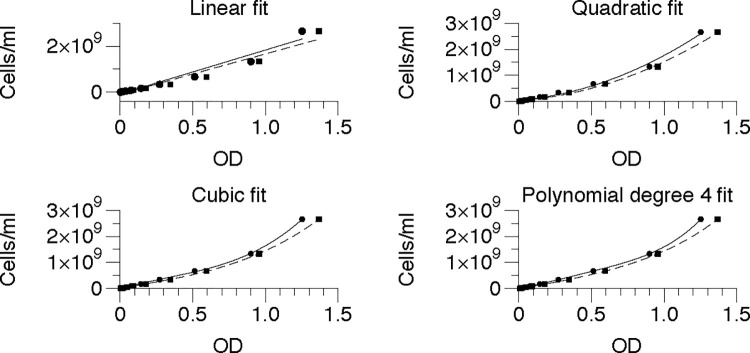
- Calibration curves differed by organism and plate size; the paper reports that the best fit for all four genera was a polynomial of degree 4, and that linear fit was clearly inappropriate, with R² = 0.95 for both 96- and 384-well plates in the E. coli example.
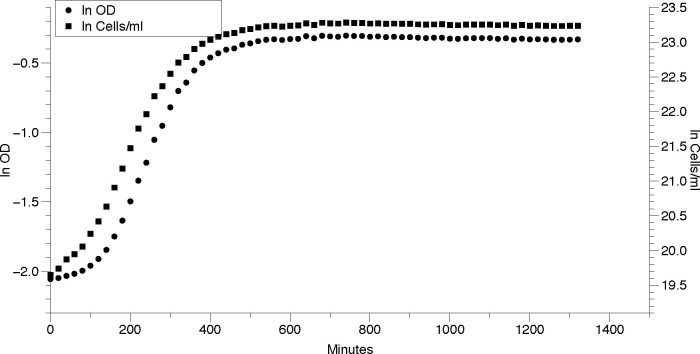
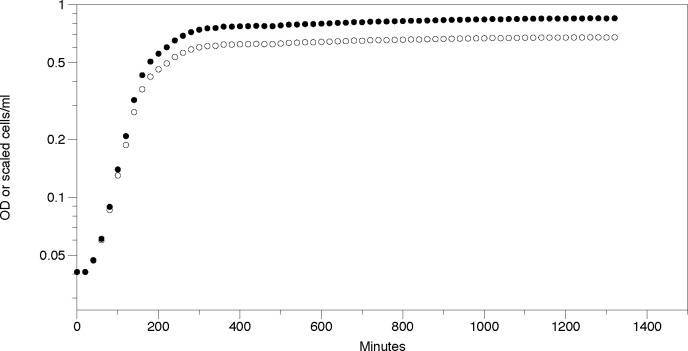
- For *S. epidermidis* in one growth-curve example, growth rates were similar using OD versus cells/mL: μ = 0.01459 ± 0.000412 min⁻¹ from OD and μ = 0.01354 ± 0.000285 min⁻¹ from cells/mL.
- For *E. coli* CFT073 and *S. epidermidis*, growth-rate estimates based on cells/mL were significantly different from those based on OD, and the authors trust the cells/mL-based estimates more.
- The paper gives an example of how OD can mask large differences in actual density: at similar OD values in 96-well plates, 0.622 corresponded to 8.2 × 10⁸ cells/mL for *E. coli* CFT073, while 0.610 corresponded to 1.25 × 10¹⁰ cells/mL for *S. epidermidis*.
## Methods
- Calibration experiments used four bacterial genera/species: *Escherichia coli* DH5α, *E. coli* CFT073, *Pseudomonas putida* ATCC 12633, *Staphylococcus epidermidis* ATCC 12228, and *Bacillus megaterium* ATCC 14581; cultures were measured in both 96-well and 384-well plates using a Biotek Epoch 2 plate reader.
- Overnight cultures were grown in LB, concentrated, diluted, plated with blanks, and OD600 was measured every 5 minutes for 30 minutes for calibration; colony counts were used to relate corrected OD to viable cells.
- The authors fit and compared linear, quadratic, cubic, and 4th-degree polynomial models, using R² and RMSE to choose the best calibration; growth-curve data were then analyzed with GrowthRates v5.1.
## Limitations
- The paper states that the provided calibration equations are for the Biotek Epoch 2 and “should not be used for instruments other than” that reader.
- The authors explicitly note that calibration must be done separately for each spectrophotometer model, species, and plate size, so the reported equations are not universally transferable.
- The text makes evident that the calibration and growth analyses are limited to the organisms and plate formats tested here (said by the paper’s use of four genera and 96-/384-well plates only).
Model-written summary. Check it against the paper before relying on it.
Integrity signals
Registry
Cites
Statistics
Figures
Verification
Claims the paper makes
4 Valid · 3 Not valid · 2 Not checked · 28 Own results and interpretations
The cited sources support only part of this claim — read each source’s verdict below.
In the paper
“This difference is important to consider when performing experiments that depend on the number of cellular divisions or cells present, such as cellular communication [12, 13] and antibiotic susceptibility [14–17] and biofilms [18].”
§ Estimating microbial population data from optical density > Discussion
What the sources say
- Not checked — no full text of the sourcecites [12] BL Bassler, 2002, Small talk. Cell-to-cell communication in bacteria, Cell source
- Not checked — no full text of the sourcecites [13] GP Salmond, 1995, The bacterial ’enigma’: cracking the code of cell-cell communication, Mol Microbiol source
- Supportedcites [14] JM Andrews, 2001, Determination of minimum inhibitory concentrations, J Antimicrob Chemother source
This citation is attached to antibiotic susceptibility, not the examples of cellular communication or biofilms. Section 5, “Preparation of inoculum,” specifies a target number of cells for MIC testing; Section 5.3 says suspensions matched to the same turbidity standard can contain 10⁷–10⁸ cfu/ml depending on the genus. That supports considering cell density when performing antibiotic susceptibility tests. (LLM, conf=0.90)
- Partly supportedcites [15] T Bollenbach, 2009, Nonoptimal microbial response to antibiotics underlies suppressive drug interactions, Cell sourceExperimental — accuracy not yet measured
The Results section, “Protein-DNA ratio is skewed under DNA stress” (page unavailable), reports that DNA-synthesis inhibitors alter cell division and cell size. The Experimental Procedures describe measuring cell counts and antibiotic susceptibility, but the paper does not establish that cultures at similar OD have different cell densities or that this difference affects susceptibility experiments. This citation falls within the antibiotic-susceptibility group, not the citations for communication or biofilms. (LLM, conf=0.78)
- Not checked — no full text of the sourcecites [16] P Mira, 2017, Statistical Package for Growth Rates Made Easy, Molecular biology and evolution source
- Could not verifycites [17] A Seigal, 2017, Does Antibiotic Resistance Evolve in Hospitals?, Bull Math Biol. sourceExperimental — accuracy not yet measured
Section 2 (p. 5) describes antibiotic susceptibility testing of patient isolates, and Section 6 (p. 12) analyzes resistance trends. Neither addresses whether differences in cell density at similar optical density, or differences in cell number or divisions, matter for susceptibility experiments. Searches for optical density and cell-number effects found no supporting passage. (LLM, conf=0.76)
- Not checked — no full text of the sourcecites [18] AE Kirby, 2012, The relative contributions of physical structure and cell density to the antibiotic susceptibility of bacteria in biofilms, Antimicrob Agents Chemother source
plain- Asserted: passes — The authors put it forward as true.
- Checkable: passes — It can be checked against evidence.
- Load-bearing: passes — The paper’s conclusions depend on it.
- Based: passes — The paper gives a reason why it holds.
Every source the paper cites for this claim was checked and supports it.
In the paper
“However, the same considerations of calibration apply to microtiter plate readers as to spectrophotometers [7].”
§ Estimating microbial population data from optical density > Introduction
What the sources say
- Supportedcites [7] K Stevenson, 2016, General calibration of microbial growth in microplate readers, Sci Rep source
The Discussion says that both spectrophotometers and microplate readers need cross-calibration for their OD readings to be compared, and that cell size and refractive index must also be considered when calibrating OD against cell number. The paper notes additional challenges at the higher culture densities common in plate readers, but supports the claim that calibration considerations apply to both instruments. (LLM, conf=0.91)
plain- Asserted: passes — The authors put it forward as true.
- Checkable: passes — It can be checked against evidence.
- Load-bearing: passes — The paper’s conclusions depend on it.
- Based: passes — The paper gives a reason why it holds.
- Supported
A result the paper reports from its own data — it cites no other source for it, so there is none to check. The quote shows it is in the paper.
In the paper
“In each case the polynomial of degree 4 was the best fit.”
§ Estimating microbial population data from optical density > Results > Calibration curves
plainstates an association- Asserted: passes — The authors put it forward as true.
- Checkable: passes — It can be checked against evidence.
- Load-bearing: passes — The paper’s conclusions depend on it.
- Based: passes — The paper gives a reason why it holds.
A result the paper reports from its own data — it cites no other source for it, so there is none to check. The quote shows it is in the paper.
In the paper
“Fig 2 shows a plot of one well for S. epidermidis strain and highlights that the curves based on OD and cells/mL are almost identical.”
§ Estimating microbial population data from optical density > Results > Application of calibration curve to real growth curve data
plainSingle case- Asserted: passes — The authors put it forward as true.
- Checkable: passes — It can be checked against evidence.
- Load-bearing: unclear — It is unclear whether the paper’s conclusions depend on it.
- Based: passes — The paper gives a reason why it holds.
- Rests on 2 assumptions not shown here.
A result the paper reports from its own data — it cites no other source for it, so there is none to check. The quote shows it is in the paper.
In the paper
“The growth rates estimated from OD and from cells/mL are not the same.”
- Also stated in: § Discussion · plain
“Growth rates estimated from OD and cells/mL are not identical (Table 3), but we trust the rates estimated from cells/mL more than those estimated from OD.”
§ Estimating microbial population data from optical density > Results > Application of calibration curve to real growth curve data
plain- Asserted: passes — The authors put it forward as true.
- Checkable: passes — It can be checked against evidence.
- Load-bearing: passes — The paper’s conclusions depend on it.
- Based: passes — The paper gives a reason why it holds.
- Rests on 3 assumptions not shown here.
- Also stated in: § Discussion · plain
16 more claims
Create a free account to see all 37 claims and every source verdict.
- Probably not a substantial claim. 6
- It may state two separate claims as one. 12
Claims other papers make about this one
Each is checked against this paper’s own text: does it say what the citing paper says it does?
The cited source says what the claim attributes to it.
In the citing paper
“its use and accuracy have recently been questioned (Mira et al. 2022).”
From Quantification of phototrophically grown Galdieria sulphuraria and other microalgae using diphenylamine (2025) · cites this paper as Mira et al. 2022
Citations
Cites
Determination of minimum inhibitory concentrations
Andrews, J. M. (2001) · Journal of Antimicrobial Chemotherapy · doi:10.1093/jac/48.suppl_1.5 · Cited by 4,129
Swinehart, D. F. (1962) · Journal of Chemical Education · doi:10.1021/ed039p333 · Cited by 1,969
Welch, R. A., Burland, V., Plunkett, G., Redford, P., Roesch, P., Rasko, D., Buckles, E. L., Liou, S.-R., Boutin, A., Hackett, J., et al. (2002) · Proceedings of the National Academy of Sciences · doi:10.1073/pnas.252529799 · Cited by 1,531
Bassler, B. L. (2002) · Cell · doi:10.1016/s0092-8674(02)00749-3 · Cited by 745
Hall, B. G., Acar, H., Nandipati, A., & Barlow, M. (2014) · Molecular Biology and Evolution · doi:10.1093/molbev/mst187 · Cited by 507
Self-citationGeneral calibration of microbial growth in microplate readers
Stevenson, K., McVey, A. F., Clark, I. B. N., Swain, P. S., & Pilizota, T. (2016) · Scientific Reports · doi:10.1038/srep38828 · Cited by 407
Zhang, Y., Ren, S., Li, H., Wang, Y., Fu, G., Yang, J., Qin, Z., Miao, Y., Wang, W., Chen, R., et al. (2003) · Molecular Microbiology · doi:10.1046/j.1365-2958.2003.03671.x · Cited by 388
The bacterial ’enigma’: cracking the code of cell-cell communication
Salmond, G. P. C., Bycroft, B. W., Stewart, G. S. A. B., & Williams, P. (1995) · Molecular Microbiology · doi:10.1111/j.1365-2958.1995.tb02424.x · Cited by 387
Some calculations on the turbidity of mitochondria and bacteria
Koch, A. L. (1961) · Biochimica et Biophysica Acta · doi:10.1016/0006-3002(61)90599-6 · Cited by 256
Turbidity measurements of bacterial cultures in some available commercial instruments
Koch, A. L. (1970) · Analytical Biochemistry · doi:10.1016/0003-2697(70)90174-0 · Cited by 244
Cited by
Emergence of community behaviors in the gut microbiota upon drug treatment
García‐Santamarina, S., Kuhn, M., Devendran, S., Maier, L., Driessen, M., Mateus, A., Mastrorilli, E., Brochado, A. R., Savitski, M. M., Patil, K. R., et al. (2024) · Cell · doi:10.1016/j.cell.2024.08.037 · Cited by 70
Apparent diameter and cell density of yeast strains with different ploidy
福田, 展. (2023) · Scientific Reports · doi:10.1038/s41598-023-28800-z · Cited by 48
Synthesis of chitosan nanoparticles (CSNP): effect of CH-CH-TPP ratio on size and stability of NPs
Bouillons-Gamboa, R. E. D., De, G., Vega‐Baudrit, J. R., Duarte, L. C. R., Lopretti, M. I., Urquíza, M. R., Zúñiga-Umaña, J. M., Barreiro, M. F., & Vázquez, P. (2024) · Frontiers in Chemistry · doi:10.3389/fchem.2024.1469271 · Cited by 53
Glen, K. A., & Lamont, I. L. (2024) · Journal of Antimicrobial Chemotherapy · doi:10.1093/jac/dkae203 · Cited by 40
Haunreiter, V. D., Tarnutzer, A., Bär, J., von Matt, M., Hertegonne, S., Andreoni, F., Vulin, C., Künzi, L., Menzi, C., Kiefer, P., et al. (2023) · Microbiology Spectrum · doi:10.1128/spectrum.02788-23 · Cited by 35
Metadata
- Authors
- Mira, P., Yeh, P., & Hall, B. G.
- Affiliations
- University of California, Los Angeles (US)
- Santa Fe Institute (US)
- Corresponding author
- Mira, Portia
- Venue
- PLOS ONE
- Publisher
- Public Library of Science (PLoS)
- Published
- 2022-10-13
- Volume
- 17
- Issue
- 10
- Pages
- e0276040
- ISSN
- 1932-6203 (ISSN-L)
- PMC
- PMC9562214
- OpenAlex
- W4305040984
- Cited by
- 175
- References
- 19
- Citations by year
- 2026: 51 · 2025: 65 · 2024: 42 · 2023: 15 · 2022: 2
- FWCI
- 18.85
- Type
- journal article
- Language
- en
- Open access
- gold
- doi.org
- Licence
- Locations
- PLoS ONE (publishedVersion, cc-by)
- bioRxiv (Cold Spring Harbor Laboratory) (acceptedVersion)
- PubMed Central (publishedVersion, cc-by)
- PubMed (publishedVersion)
- eScholarship (California Digital Library) (submittedVersion)
- DOAJ (DOAJ: Directory of Open Access Journals) (submittedVersion)
- Funders
- Ruth L. Kirschstein National Research Service Award (AI007323)
- National Center for Advancing Translational Sciences (UL1TR001881)
- Topics
- Life Sciences › Biochemistry, Genetics and Molecular Biology › Genetics › Bacterial Genetics and Biotechnology
- Health Sciences › Medicine › Microbiology (medical) › Bacterial Identification and Susceptibility Testing
- Life Sciences › Biochemistry, Genetics and Molecular Biology › Molecular Biology › bioluminescence and chemiluminescence research
- Keywords
- optical density, bacterial density, spectrophotometer calibration, cell size, microplates, 384-well plate, 96-well plate, growth curves, interlaboratory comparability
- MeSH terms
- Bacteria, Spectrophotometry
About these checks
Registry, retraction, Cites and statistics results are computed, not judged, with one exception: a printed reference that no index lists is read once by a model before it counts as a citation error. Claims are extracted by a model and kept only when their quote appears verbatim in the text; each cited source is then checked, with a model’s help, for whether it says what the claim relies on. Those verdicts can be wrong — read the claim’s quote and the cited source before relying on one.
The claim verdicts this report counts are experimental: their accuracy is not yet measured.
A language model drew the claims from the paper on 2026-10-11, under version 3 of the claim definition (model deepseek-v4.1-flash, prompt extract-v3).
A second model labelled each claim on 2026-10-11 (model jev-1.13-20260917, definition revision gold-guideline-v0.2).
Cited sources are checked with a language model’s help (gpt-6-sol).
Statistics and arithmetic are recomputed, not judged.
Confidence bands are shown only for fields calibrated on our annotated test set. None is calibrated yet, so no band is shown.
What counts as a claim ›How we measure confidence ›How we check this ›
Are you an author, or do you see a problem with this page? Request a review
How to cite
Cite CoChat for the checks on this page, and the paper for its own findings.
- This page
- CoChat. (2026). Citation check: Estimating microbial population data from optical density. https://app.cochat.ai/papers/10.1371/journal.pone.0276040
- The paper
- Mira, P., Yeh, P., & Hall, B. G. (2022). Estimating microbial population data from optical density. PLOS ONE. https://doi.org/10.1371/journal.pone.0276040
Data sources
Bibliographic data: Semantic Scholar, OpenAlex, Crossref.
Contains information from the Semantic Scholar Academic Graph Datasets, made available under the ODC Attribution License (ODC-BY 1.0).
Semantic Scholar’s data is described in: Kinney, R., et al. (2023). The Semantic Scholar Open Data Platform. arXiv:2301.10140.
