

Enhancing network stability in VANETs using nature inspired algorithm for intelligent transportation system
Open accessThe DOI matches its Crossref record; 47 of the 47 references it cites were found in a registry or an index.
Abstract
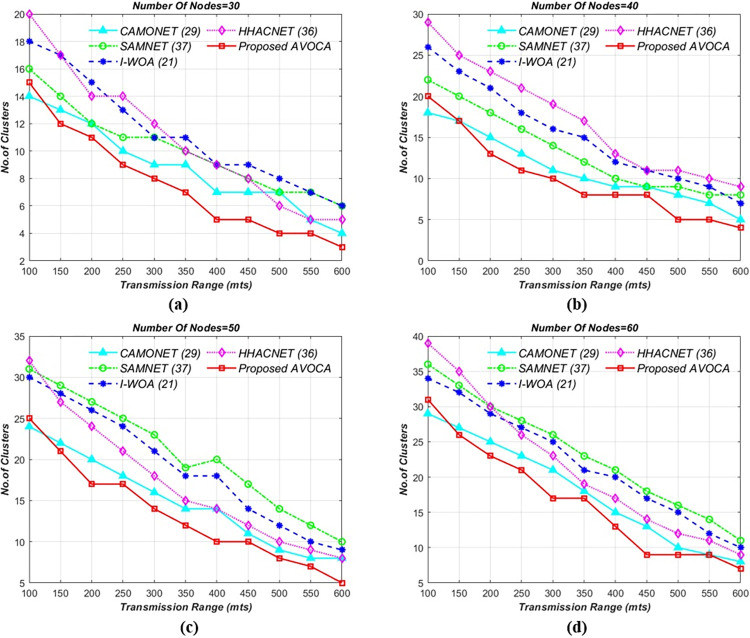
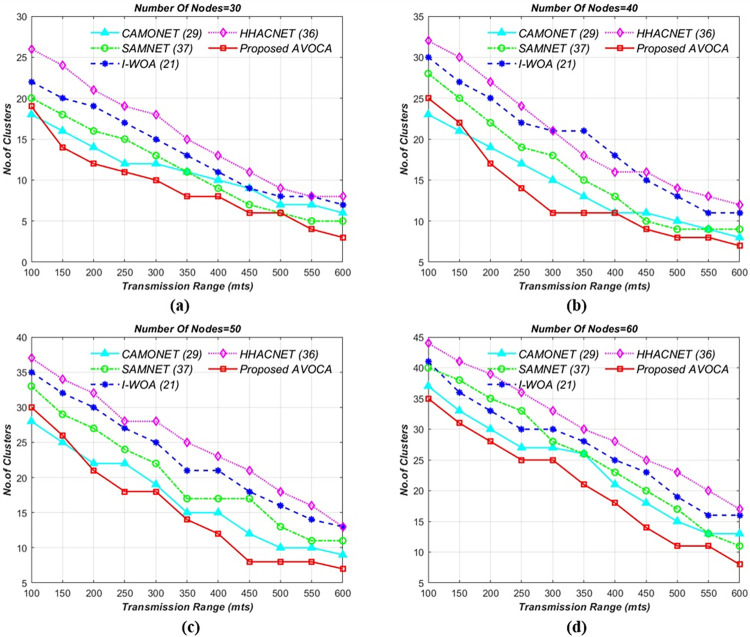
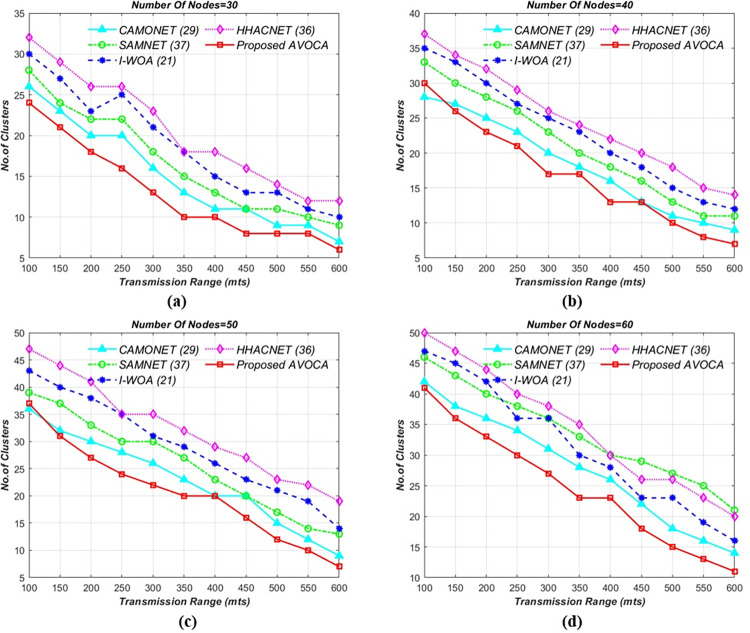
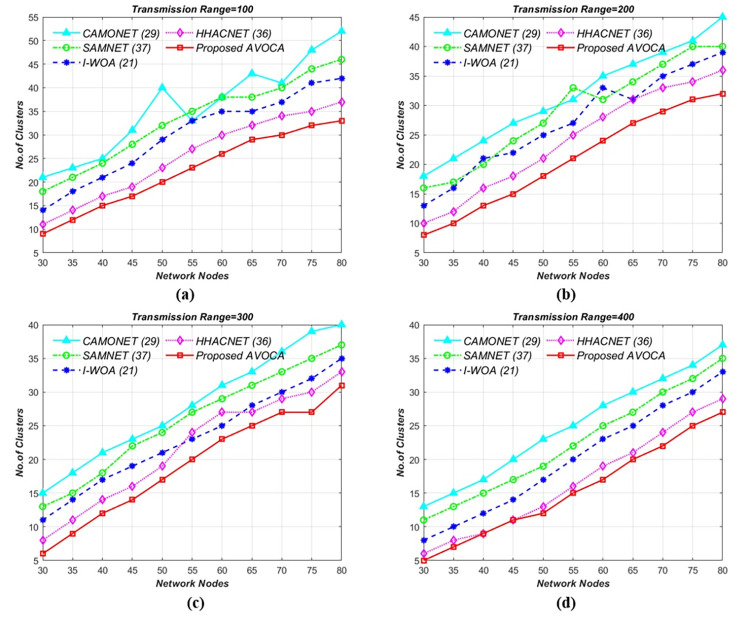
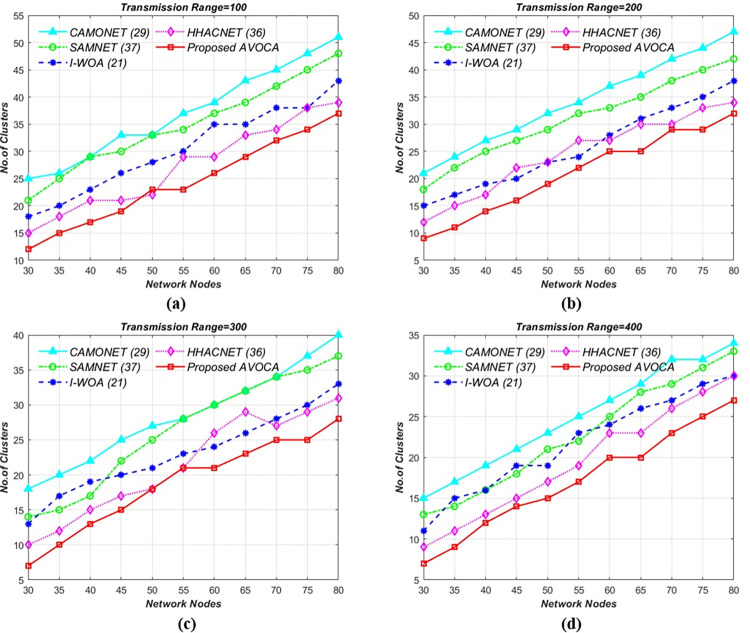
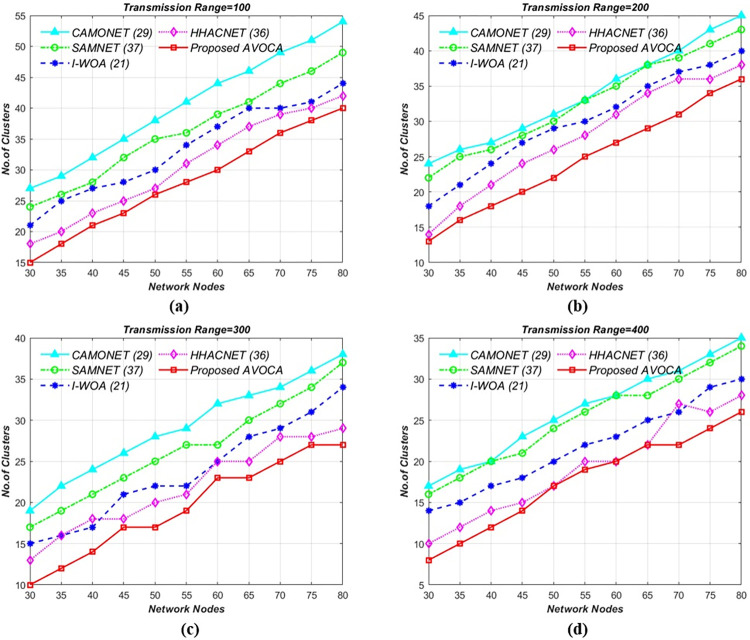
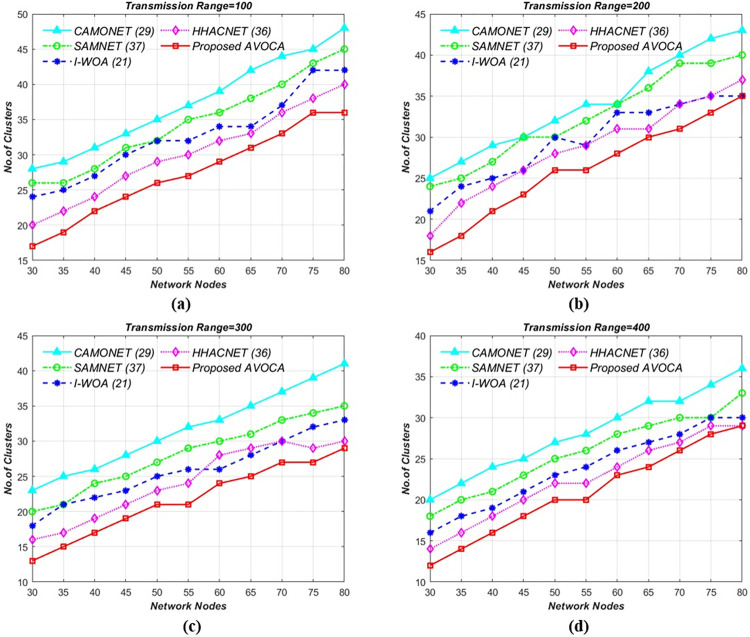
The Internet of Vehicles (IoV) is one of the developing paradigms that integrates the automotive industry with the Internet of Things (IoT). The evolution of traditional Vehicular Ad-hoc Networks (VANETs), which are a layered framework for Intelligent Transportation Systems (ITS), is employed to provide Quality of Service (QoS) to end users in hazardous situations. VANETs can set up ad-hoc networks and share information among themselves using Peer-to-Peer (P2P) communication. Dynamic properties in VANETs such as dynamic topology, node mobility, sparse vehicle distribution, and bandwidth constraints can have an impact on scalability, routing, and security. This can result in frequent link failures, instability, reliability, and QOS concerns, as well as the inherent complexity of NP-hard problems. Researchers have proposed several techniques to achieve stability; the most prominent one is clustering, which relies on mobility metrics. However, existing clustering techniques generate overwhelming clusters, resulting in greater resource consumption, communication overhead, and hop count, which may lead to increased latency. Therefore, the primary objective is to achieve stability by increasing cluster lifetime, which is accomplished by generating optimal clusters. A nature-inspired meta-heuristic algorithm titled African Vulture Optimization Based Clustering Algorithm (AVOCA) is implemented to achieve it. The proposed algorithm can achieve load optimization with efficient resource utilization by mitigating hidden node challenges and ensuring communication proficiency. By maintaining an equilibrium state between the exploration and exploitation phases, AVOCA avoids local optima. The paper explores a taxonomy of the techniques used in Cluster Head (CH) selection, coordination, and maintenance to achieve stability with lower communication costs. We evaluated the effectiveness of AVOCA using various network grid sizes, transmission ranges, and network nodes. The results show that AVOCA generates 40% less clusters when compared to the Clustering Algorithm Based on Moth-Flame Optimization for VANETs (CAMONET). AVOCA generates 45% less clusters when compared to Self-Adaptive Multi-Kernel Clustering for Urban VANETs (SAMNET), AVOCA generates 43% less clusters when compared to Intelligent Whale Optimization Algorithm (i-WOA) and AVOCA generates 38% less clusters when compared to Harris Hawks Optimization (HHO). The results show that AVOCA outperforms state-of-the-art algorithms in generating optimal clusters.
Overview
The claims and statistics of this paper haven’t been checked yet.
Free: it reads the open-access text and checks the first 5 claims that cite a source we can check. Create a free account to check every claim.
Integrity signals
Registry
Cites
Statistics
Figures
Verification
Claims the paper makes
The claims and statistics of this paper haven’t been checked yet.
Free: it reads the open-access text and checks the first 5 claims that cite a source we can check. Create a free account to check every claim.
Self-check
Percentages, sums and reported differences re-computed from the paper’s own numbers.
The self-check needs the paper’s full text.
Citations
Cites
Abdollahzadeh, B., Gharehchopogh, F. S., & Mirjalili, S. (2021) · Computers & Industrial Engineering · doi:10.1016/j.cie.2021.107408 · Cited by 1,438
New Multi-Hop Clustering Algorithm for Vehicular Ad Hoc Networks
Zhang, D., Ge, H., Zhang, T., Cui, Y.-Y., Liu, X., & Mao, G. (2019) · IEEE Transactions on Intelligent Transportation Systems · doi:10.1109/tits.2018.2853165 · Cited by 395
Ali, H., Shahzad, W., & Khan, F. A. (2012) · Applied Soft Computing · doi:10.1016/j.asoc.2011.05.036 · Cited by 159
A mobility-based scheme for dynamic clustering in vehicular ad-hoc networks (VANETs)
Ren, M., Khoukhi, L., Labiod, H., Zhang, J., & Vèque, V. (2016) · Vehicular Communications · doi:10.1016/j.vehcom.2016.12.003 · Cited by 156 · cited 1×
“(d) Furthermore, VANETs constitute large-scale networks that impose limitations on the communication radius of a vehicle due to limited spectral bandwidth, resulting in poor connectivity among vehicles [16].”
BackgroundCACONET: Ant Colony Optimization (ACO) Based Clustering Algorithm for VANET
Aadil, F., Bajwa, K. B., Khan, S., Chaudhry, N. M., & Akram, A. (2016) · PLoS ONE · doi:10.1371/journal.pone.0154080 · Cited by 131 · cited 1×
“Key parameters for assessing clustering stability include (a) the number of times the Cluster Head (CH) changes, (b) the duration of the CH, (c) the rate at which Cluster Nodes (CNs) change their CH, and (d) state transitions over the network’s lifetime [20].”
BackgroundEfficient clustering V2V routing based on PSO in VANETs
Bao, X., Li, H., Zhao, G., Chang, L., Zhou, J., & Li, Y. (2019) · Measurement · doi:10.1016/j.measurement.2019.107306 · Cited by 103 · cited 2×
“To ensure secure and sustainable travel, VANETs have evolved from conventional means of transportation into a network for information gathering and forwarding [8].”
BackgroundCAMONET: Moth-Flame Optimization (MFO) Based Clustering Algorithm for VANETs
Shah, Y. A., Habib, H. A., Aadil, F., Khan, M. F., Maqsood, M., & Nawaz, T. (2018) · IEEE Access · doi:10.1109/access.2018.2868118 · Cited by 92 · cited 3×
“Other MFO variants, ICMFO and CAMONET, are proposed by different authors in [28, 29], respectively.”
BackgroundMethodSharma, S., & Kaul, A. (2018) · Vehicular Communications · doi:10.1016/j.vehcom.2017.12.003 · Cited by 91 · cited 1×
“[41] HF-MCDM Integration of two phases.”
Husnain, G., & Anwar, S. (2021) · PLoS ONE · doi:10.1371/journal.pone.0250271 · Cited by 83
An enhanced whale optimization algorithm for vehicular communication networks
Kittusamy, S. R. V., Elhoseny, M., & Shankar, K. (2019) · International Journal of Communication Systems · doi:10.1002/dac.3953 · Cited by 82
Harris Hawks Optimization-Based Clustering Algorithm for Vehicular Ad-Hoc Networks
Ali, A. F., Aadil, F., Khan, M. F., Maqsood, M., & Lim, S. (2023) · IEEE Transactions on Intelligent Transportation Systems · doi:10.1109/tits.2023.3257484 · Cited by 73 · cited 3×
“In addition to AVOCA, this research also implemented several well-renowned algorithms for clustering in VANET, including CAMONET [29], SAMNET [37], I-WOA [21], and HHOCNET [36].”
BackgroundMethodA novel selective cross layer based routing scheme using ACO method for vehicular networks
Gawas, M. A., & Govekar, S. S. (2019) · Journal of Network and Computer Applications · doi:10.1016/j.jnca.2019.05.010 · Cited by 59 · cited 1×
“Each car in a network is equipped with a wireless transceiver that functions as a router for sharing data between neighboring vehicles when no centralized infrastructure is available [7].”
BackgroundA Reputation based Weighted Clustering Protocol in VANET: A Multi-objective Firefly Approach
Joshua, C. J., Duraisamy, R., & Varadarajan, V. (2019) · Mobile Networks and Applications · doi:10.1007/s11036-019-01257-z · Cited by 58 · cited 1×
“Furthermore, the author C.J. Joshua introduces another variant in [31], where the Reputation-based Weighted Clustering Protocol (RWCP) stabilizes VANET topology without introducing overhead.”
BackgroundHamdi, M. M., Audah, L., & Rashid, S. A. (2022) · IEEE Access · doi:10.1109/access.2022.3147498 · Cited by 52 · cited 3×
“Furthermore, harnessing the computational power of hardware and incorporating stochastic operators enhances their strength and effectiveness in exploring the search space for optimal solutions [5].”
BackgroundMethodInfluentialAchievable sum-rate analysis of correlated two-antenna uplink MIMO channels
Lee, J., & Lee, Y. (2009) · Seoul National University Open Repository (Seoul National University) · doi:10.1002/dac · Cited by 47
A New Heuristic Clustering Algorithm Based on RSU for Internet of Vehicles
Senouci, O., Harous, S., & Aliouat, Z. (2019) · Arabian Journal for Science and Engineering · doi:10.1007/s13369-019-03854-2 · Cited by 45 · cited 2×
“Fourth, data can be shared and broadcast more widely among vehicles and various infrastructures via the Internet [14].”
BackgroundMethodHusnain, G., & Anwar, S. (2022) · International Journal of Wireless Information Networks · doi:10.1007/s10776-022-00555-w · Cited by 43
SAMNET: Self-adaptative multi-kernel clustering algorithm for urban VANETs
Sellami, L., & Alaya, B. (2021) · Vehicular Communications · doi:10.1016/j.vehcom.2021.100332 · Cited by 39 · cited 2×
“In addition to AVOCA, this research also implemented several well-renowned algorithms for clustering in VANET, including CAMONET [29], SAMNET [37], I-WOA [21], and HHOCNET [36].”
MethodClustering-Based Modified Ant Colony Optimizer for Internet of Vehicles (CACOIOV)
Ebadinezhad, S., Dereboylu, Z., & Ever, E. (2019) · Sustainability · doi:10.3390/su11092624 · Cited by 38
Khan, Z., Fang, S., Koubâa, A., Fan, P., Abbas, F., & Farman, H. (2020) · Computers & Electrical Engineering · doi:10.1016/j.compeleceng.2020.106736 · Cited by 38 · cited 1×
“The authors Z.Khan et al. propose another version of ACO with a street-centric routing scheme (SCRS) for Bus-based VANETs [26] that addresses optimal-route along with relay-bus selection for Internet of Energy (IoE) in terms of computational cost and time by reducing unnecessary beacon messages.”
BackgroundSalim, A., Khedr, A. M., Alwasel, B., Osamy, W., & Aziz, A. (2023) · IEEE Access · doi:10.1109/access.2023.3275446 · Cited by 37 · cited 1×
“The authors A. Salim et al. propose a Swarm optimization-based and mobility-aware clustering method (SOMACA) based on the Sparrow Search algorithm (SSA) [23].”
MethodInvestigating Routing in the VANET Network: Review and Classification of Approaches
Sangaiah, A. K., Javadpour, A., Hsu, C.-C., Haldorai, A., & Zeynivand, A. (2023) · Algorithms · doi:10.3390/a16080381 · Cited by 37
Talib, M. S., Hassan, A., Alameri, T., Abas, Z. A., Mohammed, A. A.-J., Ibrahim, A. J., & Abdullah, N. I. (2020) · IEEE Access · doi:10.1109/access.2020.3020510 · Cited by 36 · cited 1×
“Eq (5) is another PDF used to generate the time interval among the batches and follows an Exponential Distribution [43].”
MethodEnhancement in Quality of Routing Service Using Metaheuristic PSO Algorithm in VANET Networks
Javadpour, A., Rezaei, S., Sangaiah, A. K., Słowik, A., & Khaniabadi, S. M. (2021) · Soft Computing · doi:10.1007/s00500-021-06188-0 · Cited by 36
Advanced Greedy Hybrid Bio-Inspired Routing Protocol to Improve IoV
Attia, R. M., Hassaan, A., & Rizk, R. Y. (2021) · IEEE Access · doi:10.1109/access.2021.3114646 · Cited by 35
Intelligent clustering using moth flame optimizer for vehicular ad hoc networks
Ishtiaq, A., Ahmed, S., Khan, M. F., Aadil, F., Maqsood, M., & Khan, S. (2019) · International Journal of Distributed Sensor Networks · doi:10.1177/1550147718824460 · Cited by 34
An Evolutionary Algorithm-Based Vehicular Clustering Technique for VANETs
Shah, Y. A., Aadil, F., Khalil, A., Assam, M., Abunadi, I., Alluhaidan, A. S., & Al‐Wesabi, F. N. (2022) · IEEE Access · doi:10.1109/access.2022.3145905 · Cited by 34
Regin, R., & Menakadevi, T. (2019) · Wireless Personal Communications · doi:10.1007/s11277-019-06366-2 · Cited by 33
Traffic flow control using multi-agent reinforcement learning
Zeynivand, A., Javadpour, A., Bolouki, S., Sangaiah, A. K., Ja’fari, F., Pinto, P., & Zhang, W. (2022) · Journal of Network and Computer Applications · doi:10.1016/j.jnca.2022.103497 · Cited by 33 · cited 1×
“In [30] the authors A. Zeynivand et al. improves the QoS for inter-road communication through traffic control for optimizing travel times, and queue lengths by using multi-agent reinforcement learning.”
BackgroundAhmad, M., Ikram, A. A., Wahid, I., Ullah, F., Ahmad, A., & Khan, F. A. (2019) · Peer-to-Peer Networking and Applications · doi:10.1007/s12083-019-00724-4 · Cited by 32
IMOC: Optimization Technique for Drone-Assisted VANET (DAV) Based on Moth Flame Optimization
Tariq, R., Iqbal, Z., & Aadil, F. (2020) · Wireless Communications and Mobile Computing · doi:10.1155/2020/8860646 · Cited by 28 · cited 2×
“While EAs are computationally expensive, they excel at finding fast optimal solutions, and effective choices for problems that are challenging to solve using other techniques [12].”
BackgroundCenter of mass and junction based data routing method to increase the QoS in VANET
Debnath, A., Basumatary, H., Tarafdar, A., Debbarma, M. K., & Bhattacharyya, B. K. (2019) · AEU - International Journal of Electronics and Communications · doi:10.1016/j.aeue.2019.05.026 · Cited by 24 · cited 2×
“VANETs offer numerous advantages, such as sufficient node energy, powerful data computation, storage capability, a cooperative system, fleet management, and an enhanced navigation system [1].”
BackgroundJunction-based stable clustering algorithm for vehicular ad hoc network
Mukhtaruzzaman, M., & Atiquzzaman, M. (2021) · Annals of Telecommunications · doi:10.1007/s12243-021-00881-9 · Cited by 24 · cited 1×
“In [39], the authors M. Mukhtaruzzaman and M.Atiquzzaman focus on Junction-Based Clustering for VANETs (JCV).”
BackgroundLabiod, M. A., Gharbi, M., Coudoux, F., Corlay, P., & Doghmane, N. (2019) · AEU - International Journal of Electronics and Communications · doi:10.1016/j.aeue.2019.03.001 · Cited by 23
Harkat, Y., Amrouche, A., Lamini, E., et al. (2019) · AEU - International Journal of Electronics and Communications · doi:10.1016/j.aeue.2019.01.014 · Cited by 21
A two-phase fuzzy based access network selection scheme for vehicular ad hoc networks
Evangeline, C. S., & Kumaravelu, V. B. (2021) · Peer-to-Peer Networking and Applications · doi:10.1007/s12083-021-01228-w · Cited by 18
Hosmani, S., & Mathapati, B. (2021) · Journal of Ambient Intelligence and Humanized Computing · doi:10.1007/s12652-021-03414-3 · Cited by 16 · cited 1×
“In [35], authors S.Hosmani and B.Mathapati focus shifts to Robust and Reliable Secure Clustering and Data Transmission (R2 SCDT), which is based on trust values, providing secure and reliable communication.”
BackgroundESSAIoV: Enhanced Sparrow Search Algorithm-Based Clustering for Internet of Vehicles
Khedr, A. M., Vijayan, D., Salim, A., Elsway, A. A., & Osamy, W. (2023) · Arabian Journal for Science and Engineering · doi:10.1007/s13369-023-07862-1 · Cited by 15 · cited 1×
“SSA interspersed with GA is another strategy proposed by the authors A.M.Khedr et al. in [24] to enhance effective communication in high mobility nodes titled, Enhanced Sparrow Search Algorithm for IoV (ESSAIoV).”
BackgroundEnhancing the Route Optimization Using Hybrid MAF Optimization Algorithm for the Internet of Vehicle
Dhanare, R., Nagwanshi, K. K., & Varma, S. (2022) · Wireless Personal Communications · doi:10.1007/s11277-022-09629-7 · Cited by 12
mmWave Channel Stationarity Analysis of V2X Communications in an Urban Environment
Rodríguez-Corbo, F. A., Azpilicueta, L., Celaya-Echarri, M., Shubair, R. M., & Falcone, F. (2023) · IEEE Antennas and Wireless Propagation Letters · doi:10.1109/lawp.2023.3243696 · Cited by 12 · cited 1×
“When Line-Of-Sight (LOS) exists among vehicles (typically highway scenarios) with high mobility and relatively low antenna height, a high-power signal is transmitted in single-hop communication [10].”
BackgroundNavigation route based stable clustering for vehicular ad hoc networks
Yang, Z., Wu, W., Chen, Y.-S., Lin, X., & Chen, X. (2018) · China Communications · doi:10.1109/cc.2018.8331990 · Cited by 10
On the performance of cooperative vehicular networks under antenna correlation at RSU
Jameel, F., & Javed, M. A. (2018) · AEU - International Journal of Electronics and Communications · doi:10.1016/j.aeue.2018.08.018 · Cited by 8
Navigation Route Based Stable Clustering for Vehicular Ad Hoc Networks
Yang, Z., Wu, W., Chen, Y.-S., Lin, X., & Chen, X. (2018) · Lecture notes of the Institute for Computer Sciences, Social Informatics and Telecommunications Engineering · doi:10.1007/978-3-319-78139-6_54 · Cited by 6
Evangeline, C. S., & Kumaravelu, V. B. (2021) · Journal of Circuits Systems and Computers · doi:10.1142/s0218126621502066 · Cited by 5 · cited 1×
“The authors C.S. Evangeline and Vinoth Babu k in [33] improve the QoS of the VANET based on the two-phase access network selection.”
BackgroundMIMO Cooperation Schemes for Uplink of Future Railway Communication Systems
Amis, K., Galezowski, T., & Lagrange, X. (2020) · IEEE International Symposium on Personal, Indoor and Mobile Radio Communications (PIMRC) · doi:10.1109/pimrc48278.2020.9217233 · Cited by 2 · cited 1×
“In the current era of IoT, every vehicle that has access to the Internet can share data within the network is referred to as an IOV, which enables smart city functionalities [3].”
BackgroundBarbero (2014) · doi:10.1016/j · Cited by 1
(2014) · Institutional Repository University of Antioquia (University of Antioquia) · doi:10.1371/journal.pone
Research works printed but not linked: 1
- Albashir A. Youssef, Aadaptive LDPC coded high data rate based IR-UWB combined with VMIMO system for vehicular communication links., AEU—Int J Electron Commun
Cited by
Tariq, U., & Ahanger, T. A. (2025) · World Electric Vehicle Journal · doi:10.3390/wevj16010024 · Cited by 19
“The rapid advancement of ITSs is closely tied to the effectiveness of VANETs, which are crucial for secure and efficient vehicle-to-infrastructure communications [1].”
Rambabu, B., Anupkant, S., Archana, M., Swathi, V. N. V. L. S., Mallareddy, A., & Nimmala, S. (2024) · International Conference on Technological Advancements in Computational Sciences (ICTACS) · doi:10.1109/ictacs62700.2024.10840908 · Cited by 16
“Another work analyzed the improvement of network stability for intelligent transportation systems in VANETs, using nature-inspired meta-heuristic algorithms such as GA and PSO for cluster and communication configuration [12].”
Meera, V. K., Balasubramanian, C., & Praveen, R. (2025) · International Journal of Communication Systems · doi:10.1002/dac.70171 · Cited by 11
“Yerrathi and Pakala [30] proposed an African Vulture Optimization–Based Clustering Algorithm (AVOCA) for minimizing the number of generated clusters, which targets achieving better resource management with maximized energy stability in vehicular networks.”
Husnain, G., Zafar, W., Iqbal, A., Khan, A., Alzahrani, A. S., & Al-Naeem, M. (2026) · IET Intelligent Transport Systems · doi:10.1049/itr2.70170 · Cited by 10
Clustering in Vehicular Ad Hoc Network: A Bibliometric Analysis
Kumari, A., Kumar, S., Raw, R. S., & Bohra, N. (2025) · SN Computer Science · doi:10.1007/s42979-024-03638-y · Cited by 5
“The algorithms consider vehicle density, velocity, geographical location, and dynamic cluster size adjustments based on network conditions [9, 46].”
Metadata
- Authors
- Yerrathi, S., & Pakala, V.
- Affiliations
- Vellore Institute of Technology University (IN)
- Corresponding author
- Pakala, Venugopal
- Venue
- PLOS ONE
- Publisher
- Public Library of Science (PLoS)
- Published
- 2024-01-11
- Volume
- 19
- Issue
- 1
- Pages
- e0296331
- ISSN
- 1932-6203 (ISSN-L)
- PMC
- PMC10783730
- OpenAlex
- W4390776947
- Cited by
- 15
- References
- 42
- Citations by year
- 2026: 7 · 2025: 6 · 2024: 2
- FWCI
- 1.55
- Type
- journal article
- Language
- en
- Open access
- gold
- doi.org
- Licence
- Locations
- PLoS ONE (publishedVersion, cc-by)
- PubMed Central (publishedVersion, cc-by)
- PubMed (publishedVersion)
- RePEc: Research Papers in Economics (submittedVersion)
- DOAJ (DOAJ: Directory of Open Access Journals) (submittedVersion, cc-by-sa)
- Greater South Information System
- Topics
- Physical Sciences › Engineering › Electrical and Electronic Engineering › Vehicular Ad Hoc Networks (VANETs)
- Physical Sciences › Engineering › Control and Systems Engineering › Traffic control and management
- Physical Sciences › Computer Science › Computer Networks and Communications › Mobile Ad Hoc Networks
- Keywords
- vehicular ad hoc networks, network stability, cluster head selection, cluster formation, nature-inspired metaheuristics, clustering algorithms, hidden terminal problem, quality of service, intelligent transportation systems, Internet of Vehicles, swarm intelligence
- MeSH terms
- Algorithms, Computer Communication Networks, Reproducibility of Results, Cluster Analysis, Internet
About these checks
Registry, retraction, Cites and statistics results are computed, not judged, with one exception: a printed reference that no index lists is read once by a model before it counts as a citation error. Claims are extracted by a model and kept only when their quote appears verbatim in the text; each cited source is then checked, with a model’s help, for whether it says what the claim relies on. Those verdicts can be wrong — read the claim’s quote and the cited source before relying on one.
Statistics and arithmetic are recomputed, not judged.
Confidence bands are shown only for fields calibrated on our annotated test set. None is calibrated yet, so no band is shown.
What counts as a claim ›How we measure confidence ›How we check this ›
Are you an author, or do you see a problem with this page? Request a review
Data sources
Bibliographic data: Semantic Scholar, OpenAlex, Crossref.
Contains information from the Semantic Scholar Academic Graph Datasets, made available under the ODC Attribution License (ODC-BY 1.0).
Semantic Scholar’s data is described in: Kinney, R., et al. (2023). The Semantic Scholar Open Data Platform. arXiv:2301.10140.
