

The DOI matches its Crossref record; 50 of the 51 references it cites were found in a registry or an index, and 1 are not checked yet.
Modeling health risks using neural network ensembles
Open accessAbstract
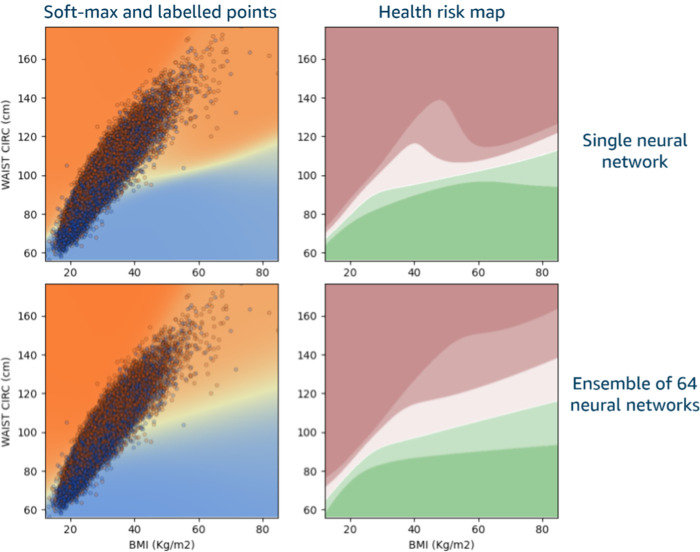
This study aims to demonstrate that demographics combined with biometrics can be used to predict obesity related chronic disease risk and produce a health risk score that outperforms body mass index (BMI)—the most commonly used biomarker for obesity. We propose training an ensemble of small neural networks to fuse demographics and biometrics inputs. The categorical outputs of the networks are then turned into a multi-dimensional risk map, which associates diverse inputs with stratified, output health risk. Our ensemble model is optimized and validated on disjoint subsets of nationally representative data (N~100,000) from the National Health and Nutrition Examination Survey (NHANES). To broaden applicability of the proposed method, we consider only non-invasive inputs that can be easily measured through modern devices. Our results show that: (a) neural networks can predict individual conditions (e.g., diabetes, hypertension) or the union of multiple (e.g., nine) health conditions; (b) Softmax model outputs can be used to stratify individual- or any-condition risk; (c) ensembles of neural networks improve generalizability; (d) multiple-input models outperform BMI (e.g., 75.1% area under the receiver operator curve for eight-input, any-condition models compared to 64.2% for BMI); (e) small neural networks are as effective as larger ones for the inference tasks considered; the proposed models are small enough that they can be expressed as human-readable equations, and they can be adapted to clinical settings to identify high-risk, undiagnosed populations.
Overview
The claims and statistics of this paper haven’t been checked yet.
Free: it reads the open-access text and checks the first 5 claims that cite a source we can check. Create a free account to check every claim.
Integrity signals
Registry
Cites
Statistics
Figures



Verification
Claims the paper makes
The claims and statistics of this paper haven’t been checked yet.
Free: it reads the open-access text and checks the first 5 claims that cite a source we can check. Create a free account to check every claim.
Claims other papers make about this one
Each is checked against this paper’s own text: does it say what the citing paper says it does?
The cited source says what the claim attributes to it.
In the citing paper
“For example, BMI, the main patient characteristic being used for limiting coverage eligibility, is an imperfect measure of obesity-related health risks [65].”
From Affordable access to GLP-1 obesity medications: strategies to guide market action and policy solutions in the US (2025) · cites this paper as [65]
Experimental — accuracy not yet measured
Self-check
Percentages, sums and reported differences re-computed from the paper’s own numbers.
The self-check needs the paper’s full text.
Citations
Cites
Adam: A Method for Stochastic Optimization
Kingma, D. P., & Ba, J. (2014) · arXiv · doi:10.48550/arxiv.1412.6980 · Cited by 98,946
Learning representations by back-propagating errors
Rumelhart, D. E., Hinton, G. E., & Williams, R. J. (1986) · Nature · doi:10.1038/323533a0 · Cited by 31,892
A Unified Approach to Interpreting Model Predictions
Lundberg, S., & Lee, S.-I. (2017) · arXiv · doi:10.48550/arxiv.1705.07874 · Cited by 23,707
Breiman, L. (1996) · Machine Learning · doi:10.1007/bf00058655 · Cited by 16,325
Gauriat, C.-M., Pencolé, Y., Ribot, P., & Brouillet, G. (2024) · HAL (Le Centre pour la Communication Scientifique Directe) · doi:10.4230/oasics.dx.2024.27 · Cited by 12,586
Child abuse: Adolescent records vs. adult recall
Femina, D. D., Yeager, C. A., & Lewis, D. O. (1990) · Child Abuse & Neglect · doi:10.1016/0145-2134(90)90033-p · Cited by 8,820
Machine learning: Algorithms, real-world applications and research directions
Sarker, I. H. (2021) · SN Computer Science · doi:10.1007/s42979-021-00592-x · Cited by 5,583
The Disease Burden Associated With Overweight and Obesity
Must, A. (1999) · JAMA · doi:10.1001/jama.282.16.1523 · Cited by 4,780
2013 AHA/ACC/TOS Guideline for the Management of Overweight and Obesity in Adults
Jensen, M. D., Ryan, D. H., Apovian, C. M., Ard, J. D., Comuzzie, A. G., Donato, K. A., Hu, F. B., Hubbard, V. S., Jakicic, J. M., Kushner, R. F., et al. (2014) · Journal of the American College of Cardiology · doi:10.1016/j.jacc.2013.11.004 · Cited by 4,058
Finkelstein, E. A., Trogdon, J. G., Cohen, J. W., & Dietz, W. (2009) · Health Affairs · doi:10.1377/hlthaff.28.5.w822 · Cited by 2,957
Research works printed but not linked: 6
- World Health Organization Nutrition and Food Safety., 2008, Waist circumference and waist-hip ratio: report of a WHO expert consultation., 8
- National Institute of Diabetes and Digestive and Kidney Diseases, 2021, Overweight & obesity statistics.
- American Medical Association, 2023, AMA adopts new policy clarifying role of BMI as a measure in medicine.
- I Goodfellow, 2017, Deep learning.
- S Ioffe, 2015, Batch normalization: accelerating deep network training by reducing internal covariate shift. Proc. of the 32nd, International Conference on Machine Learning, 7
- I Goodfellow, 1916, Deep Learning., 180
Cited by
Pearson, S. D., Whaley, C. M., & Emond, S. K. (2025) · Journal of Comparative Effectiveness Research · doi:10.57264/cer-2025-0083 · Cited by 55
Beyond Body Mass Index: Accurate Metabolic Disease‐Risk Phenotyping With 3D Smartphone Application
McCarthy, C., Tinsley, G. M., Ramirez, S., & Heymsfield, S. B. (2024) · Obesity Science & Practice · doi:10.1002/osp4.70025 · Cited by 5
Self-citationMo, M., Luo, W., Hu, Q., Wang, J., Jiao, T., Xie, L., Wu, G., Yang, Y., Deng, J., & Xu, X. (2025) · Frontiers in Public Health · doi:10.3389/fpubh.2025.1640226 · Cited by 1
Depression Associated with Other Medical Conditions
Sunzeri, F., & Sunzeri, E. (2026) · Springer eBooks · doi:10.1007/978-3-032-14465-2_12
Validation of digital anthropometric measurements during pregnancy: a longitudinal study
Ramirez, S., Brown, J., Yang, R., Deynzer, M., Lemos, G., McCarthy, C., Dube, S., Virostko, J. M., Janumala, I., Nichols, A. R., et al. (2026) · European Journal of Clinical Nutrition · doi:10.1038/s41430-026-01763-w · Cited by 1
Self-citation
Metadata
- Authors
- Smith, B. M., Criminisi, A., Sorek, N., Harari, Y., Sood, N., & Heymsfield, S. B.
- Affiliations
- Amazon (United States) (US)
- Amazon (United Kingdom) (GB)
- University of Southern California (US)
- Pennington Biomedical Research Center (US)
- Corresponding author
- Smith, Brandon M.
- Venue
- PLOS ONE
- Publisher
- Public Library of Science (PLoS)
- Published
- 2024-10-09
- Volume
- 19
- Issue
- 10
- Pages
- e0308922
- ISSN
- 1932-6203 (ISSN-L)
- PMC
- PMC11463747
- OpenAlex
- W4403240915
- Cited by
- 5
- References
- 49
- Citations by year
- 2026: 2 · 2025: 2 · 2024: 1
- FWCI
- 1.53
- Type
- journal article
- Language
- en
- Open access
- gold
- doi.org
- Licence
- Locations
- PLoS ONE (publishedVersion, cc-by)
- PubMed Central (publishedVersion, cc-by)
- PubMed (publishedVersion)
- DOAJ (DOAJ: Directory of Open Access Journals) (submittedVersion)
- Funders
- Funded by Amazon, Inc., Seattle, WA.
- Topics
- Health Sciences › Health Professions › Health Information Management › Artificial Intelligence in Healthcare
- Physical Sciences › Computer Science › Artificial Intelligence › Machine Learning in Healthcare
- Health Sciences › Medicine › Public Health, Environmental and Occupational Health › Health Promotion and Cardiovascular Prevention
- Keywords
- health risk prediction, neural network ensembles, obesity, chronic disease risk, body mass index, biometrics, demographics, risk score, diabetes mellitus, hypertension, model generalization, NHANES
- MeSH terms
- Adult, Female, Humans, Male, Middle Aged, Nutrition Surveys, Obesity, Risk Factors, Body Mass Index, Neural Networks, Computer, Risk Assessment
About these checks
Registry, retraction, Cites and statistics results are computed, not judged, with one exception: a printed reference that no index lists is read once by a model before it counts as a citation error. Claims are extracted by a model and kept only when their quote appears verbatim in the text; each cited source is then checked, with a model’s help, for whether it says what the claim relies on. Those verdicts can be wrong — read the claim’s quote and the cited source before relying on one.
Statistics and arithmetic are recomputed, not judged.
Confidence bands are shown only for fields calibrated on our annotated test set. None is calibrated yet, so no band is shown.
What counts as a claim ›How we measure confidence ›How we check this ›
Are you an author, or do you see a problem with this page? Request a review
How to cite
Cite CoChat for the checks on this page, and the paper for its own findings.
- This page
- CoChat. (2026). Citation check: Modeling health risks using neural network ensembles. https://app.cochat.ai/papers/10.1371/journal.pone.0308922
- The paper
- Smith, B. M., Criminisi, A., Sorek, N., Harari, Y., Sood, N., & Heymsfield, S. B. (2024). Modeling health risks using neural network ensembles. PLOS ONE. https://doi.org/10.1371/journal.pone.0308922
Data sources
Bibliographic data: Semantic Scholar, OpenAlex, Crossref.
Contains information from the Semantic Scholar Academic Graph Datasets, made available under the ODC Attribution License (ODC-BY 1.0).
Semantic Scholar’s data is described in: Kinney, R., et al. (2023). The Semantic Scholar Open Data Platform. arXiv:2301.10140.
