

The DOI matches its Crossref record; 30 of the 30 references it cites were found in a registry or an index; none of the 18 sources its claims cite is checked for support yet.
Impacts of water depth on pedestrian speed, gait, and stability: results from an experimental study
Open accessAbstract
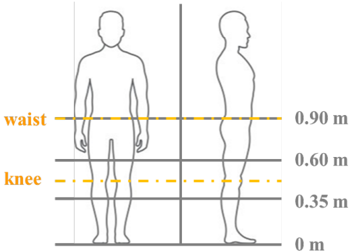
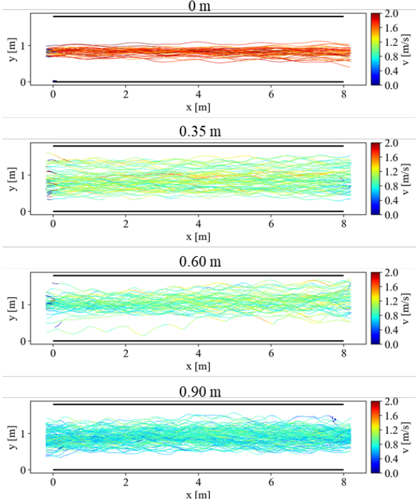
Under rapid socio-economic development and increasingly frequent extreme weather events, flood disasters have led to growing losses and casualties, highlighting the importance of understanding pedestrian dynamics in flooded environments. This study conducted controlled movement experiments involving 188 participants across four water depths (0, 0.35, 0.60, and 0.90 m) to investigate the effects of water depth on walking behavior. Results show that water depth significantly influences pedestrian speed and gait characteristics. When depth increased from 0m to 0.35 m, pedestrian speed decreased by 38.6% for males and 44.8 % for females, lateral swaying amplitude increased by 69 % and 133.3 %, and step length shortened by 37.0 % and 32.0 %, respectively. Further increases in depth resulted in progressively smaller changes. Water also exacerbated gender differences in walking speed, while disparities in stride frequency, step length, and swaying amplitude were most pronounced under dry conditions. At depths up to 0.90 m, the coefficients of variation for step length and stride frequency increased, indicating diminished gait stability. These findings clarify how water depth affects pedestrian movement and stability, reveal gender-specific behavioral responses, and provide essential empirical data to improve flood evacuation modeling and enhance pedestrian safety during flood events.
Overview
AI snapshot
Written from the paper’s full text.
TL;DR
In controlled experiments with 188 participants at four water depths (0, 0.35, 0.60, and 0.90 m), increasing water depth sharply reduced walking speed and step length and increased lateral sway, with the largest changes between 0 and 0.35 m. Gender differences in speed emerged in water, and gait variability rose at 0.90 m.
Key findings
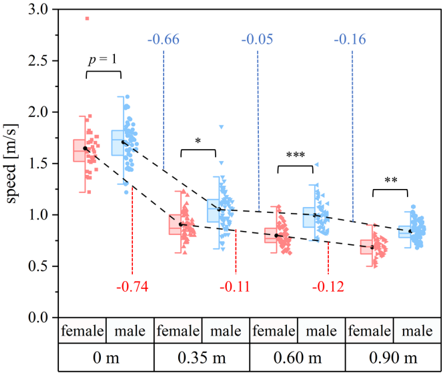
- Speed fell significantly from 0 to 0.35 m: average male speed decreased by 0.66 m s⁻¹ (38.6%) and average female speed by 0.74 m s⁻¹ (44.8%); further depth increases produced diminishing reductions. Kruskal-Wallis testing showed significant speed differences across gender–water depth groups (χ² = 308.95, DF = 7, p < 0.001), with no significant gender difference at 0 m (p = 1) but significant differences at all flooded depths (p < 0.001).
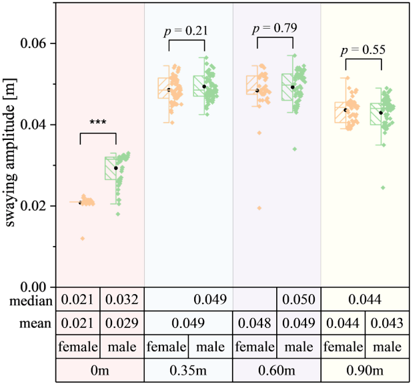
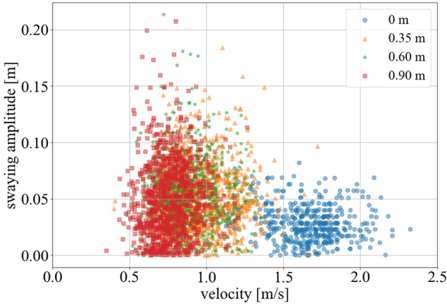
- Lateral swaying amplitude increased from 0 to 0.35 m by 69% for males and 133.3% for females; sway was highest at 0.35 m and 0.60 m and lower at 0.90 m. Water depth significantly affected sway amplitude (χ² = 293.86, DF = 3, p < 0.0001), and no significant linear correlation between velocity and sway amplitude was found except weak correlations at 0 m (Spearman Corr. = −0.12, p = 0.01) and 0.90 m (Spearman Corr. = 0.1, p = 0.002).
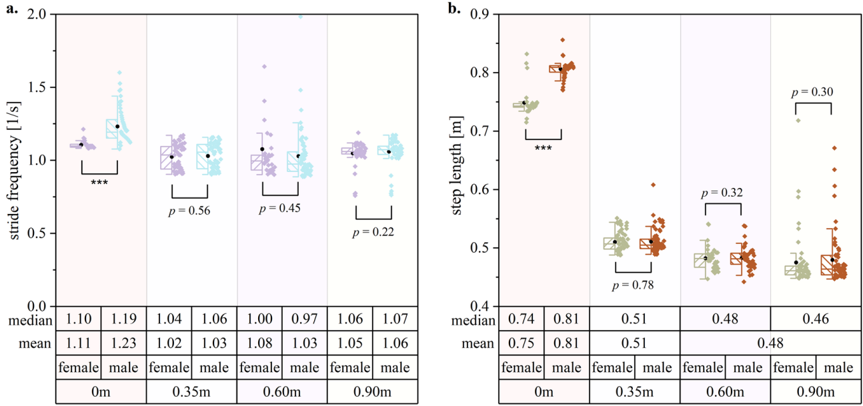
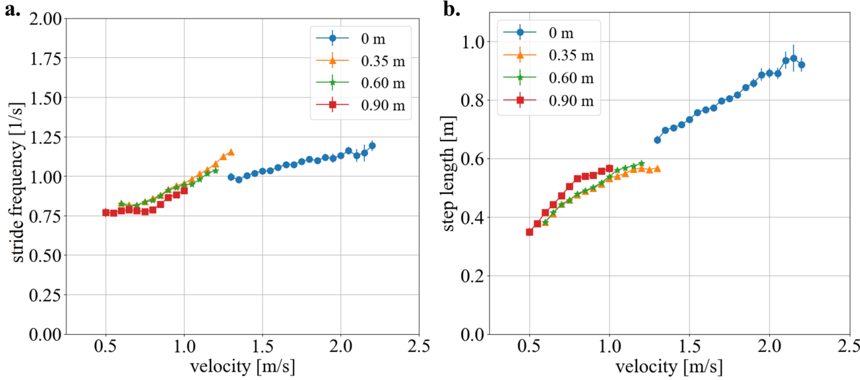
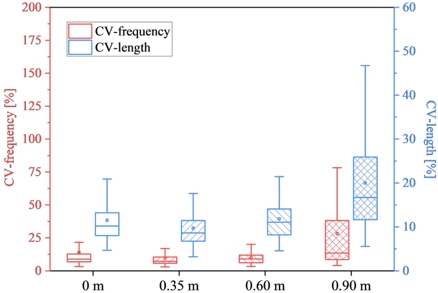
- Stride frequency remained around 1 Hz across all depths, while step length decreased significantly: average step lengths at 0 m were 0.75 m for females and 0.81 m for males, falling to 0.51 m, 0.48 m, and 0.46 m at 0.35 m, 0.60 m, and 0.90 m, respectively. Water depth significantly affected step length (χ² = 306.0, DF = 3, p < 0.0001) and stride frequency (χ² = 133.4, DF = 3, p < 0.0001); coefficients of variation for both increased at 0.90 m, indicating reduced gait stability.
- Height and weight were weakly positively correlated with walking speed in water (r < 0.4, p < 0.05), but multiple linear regression found gender (p < 0.001) and water depth (p < 0.001) to be primary factors, while height (p = 0.835) and weight (p = 0.597) were not statistically significant after controlling for other variables.
Methods
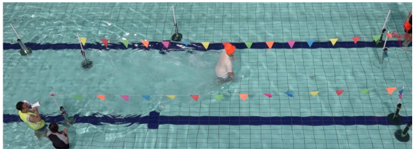
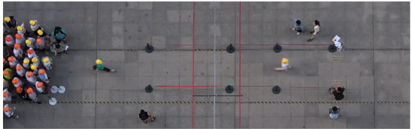
- Controlled experiment conducted in July 2024 at the University of Science and Technology of China with 188 student volunteers (101 males, 87 females), aged 16–33 years (mean 22.3 ± 3.5 years; height 1.7 ± 0.1 m; weight 62.6 ± 12.0 kg). Four water depths were tested: 0 m, 0.35 m, 0.60 m, and 0.90 m. Water trials took place in a swimming pool at 26 °C with clear water and no currents other than those induced by participants; the 0 m condition was in an open area.
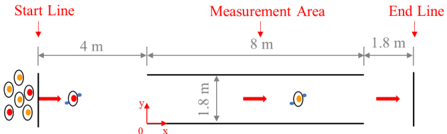
- Participants walked individually through a 1.8 m wide, 8 m long channel. Video was recorded at 25 fps and 1920 × 1080 pixels; Petrack software calibrated 2D pixel coordinates to real-world 3D coordinates, with average error less than 0.02 m. Trajectory data were used to derive speed, lateral swaying amplitude, stride frequency, step length, and coefficients of variation.
- Because speed distributions were non-normal, the Kruskal-Wallis H-test was applied with gender and water depth as a combined grouping factor, followed by Dunn’s post-hoc test. Pearson correlation and multiple linear regression examined height, weight, gender, and water depth; the interquartile range was used to summarize speed statistics.
Limitations
- The paper states that the experimental environment was idealized and did not account for flowing water or small waves generated by pedestrian movement, which may influence ground visibility and are common in real floods.
- The sample consisted solely of college students, a relatively homogeneous group that may not represent broader demographic variation; analyses were limited to trajectory data and did not include psychological factors such as stress and fatigue.
- Evident from the text: per-depth participant counts (114, 97 or 95, 133, and 88) exceed the stated 188 total, indicating likely repeated participation across conditions, but the paper does not discuss repeated-measures dependence or possible time-of-day/order effects across the two test days.
Model-written summary. Check it against the paper before relying on it.
Integrity signals
Registry
Cites
Statistics
Figures
Verification
Claims the paper makes
64 Own result · 25 Own interpretation · 11 Sources not found · 8 Own method · 5 No basis given
A result the paper reports from its own data — it cites no other source for it, so there is none to check. The quote shows it is in the paper.
In the paper
“Results show that water depth significantly influences pedestrian speed and gait characteristics.”
§ IMPACTS OF WATER DEPTH ON PEDESTRIAN SPEED, GAIT, AND STABILITY: RESULTS FROM AN EXPERIMENTAL STUDY > Abstract
plainstates a causen = 188- Asserted: passes — The authors put it forward as true.
- Checkable: passes — It can be checked against evidence.
- Load-bearing: passes — The paper’s conclusions depend on it.
- Based: passes — The paper gives a reason why it holds.
A result the paper reports from its own data — it cites no other source for it, so there is none to check. The quote shows it is in the paper.
In the paper
“The analysis shows that gender differences in stride frequency (χ 2 = 46.8,p < 0.0001) and step length (χ 2 = 46.2,p < 0.0001) are significant only at 0 m water depth.”
§ IMPACTS OF WATER DEPTH ON PEDESTRIAN SPEED, GAIT, AND STABILITY: RESULTS FROM AN EXPERIMENTAL STUDY > 3.3.1. Effect of water depth and gender on
plain- Asserted: passes — The authors put it forward as true.
- Checkable: passes — It can be checked against evidence.
- Load-bearing: unclear — It is unclear whether the paper’s conclusions depend on it.
- Based: passes — The paper gives a reason why it holds.
A result the paper reports from its own data — it cites no other source for it, so there is none to check. The quote shows it is in the paper.
In the paper
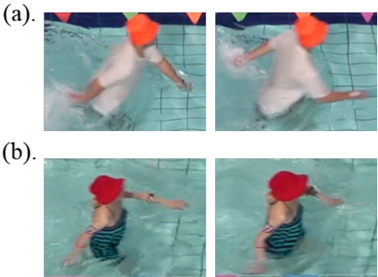
“Pedestrians increased their arm-swing amplitude to better maintain balance in water relative to land.”
§ IMPACTS OF WATER DEPTH ON PEDESTRIAN SPEED, GAIT, AND STABILITY: RESULTS FROM AN EXPERIMENTAL STUDY > 3.1. Trajectories and pedestrian behavior
plainstates a cause- Asserted: passes — The authors put it forward as true.
- Checkable: passes — It can be checked against evidence.
- Load-bearing: unclear — It is unclear whether the paper’s conclusions depend on it.
- Based: passes — The paper gives a reason why it holds.
A result the paper reports from its own data — it cites no other source for it, so there is none to check. The quote shows it is in the paper.
In the paper
“when water depth rose from 0 m to 0.35 m, pedestrian speeds dropped significantly, with average male speeds decreasing by 0.66 m s -1 (38.6 %) and average female speeds by 0.74 m s -1 (44.8 %).”
§ IMPACTS OF WATER DEPTH ON PEDESTRIAN SPEED, GAIT, AND STABILITY: RESULTS FROM AN EXPERIMENTAL STUDY > 3.2.1. Effect of water depth and gender on speed
plainstates a cause- Asserted: passes — The authors put it forward as true.
- Checkable: passes — It can be checked against evidence.
- Load-bearing: passes — The paper’s conclusions depend on it.
- Based: passes — The paper gives a reason why it holds.
A result the paper reports from its own data — it cites no other source for it, so there is none to check. The quote shows it is in the paper.
In the paper
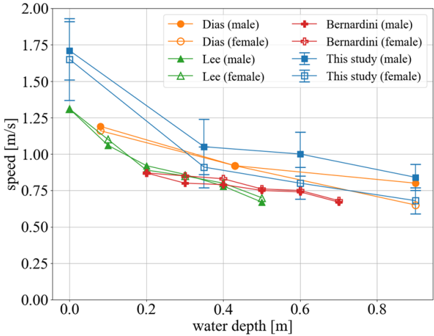
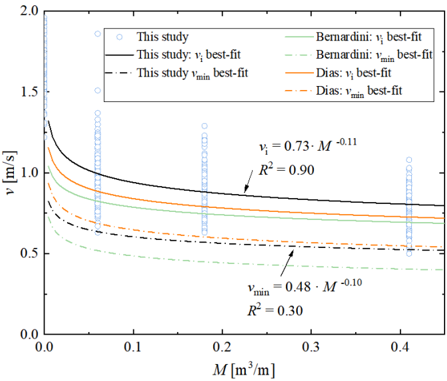
“The specific flood forces M (see Appendix A.1) associated with water depths of 0.90 m, 0.60 m, and 0.35 m in this study were 0.405 m 3 m -1 , 0.18 m 3 m -1 and 0.06 m 3 m -1 , respectively.”
§ IMPACTS OF WATER DEPTH ON PEDESTRIAN SPEED, GAIT, AND STABILITY: RESULTS FROM AN EXPERIMENTAL STUDY > 3.2.2. Comparison with previous studies
plainstates an association- Asserted: passes — The authors put it forward as true.
- Checkable: passes — It can be checked against evidence.
- Load-bearing: passes — The paper’s conclusions depend on it.
- Based: passes — The paper gives a reason why it holds.
A result the paper reports from its own data — it cites no other source for it, so there is none to check. The quote shows it is in the paper.
In the paper
“Notably, a significant effect of gender on lateral sway amplitude was evident only at 0 m depth.”
§ IMPACTS OF WATER DEPTH ON PEDESTRIAN SPEED, GAIT, AND STABILITY: RESULTS FROM AN EXPERIMENTAL STUDY > 4. Discussion and conclusion
plainstates an association- Asserted: passes — The authors put it forward as true.
- Checkable: passes — It can be checked against evidence.
- Load-bearing: unclear — It is unclear whether the paper’s conclusions depend on it.
- Based: passes — The paper gives a reason why it holds.
A result the paper reports from its own data — it cites no other source for it, so there is none to check. The quote shows it is in the paper.
In the paper
“Lateral swaying amplitude increased significantly when water depth increased from 0 m to 0.35 m, with an average increase of 69 % for males and 133.3 % for females.”
§ IMPACTS OF WATER DEPTH ON PEDESTRIAN SPEED, GAIT, AND STABILITY: RESULTS FROM AN EXPERIMENTAL STUDY > 3.3.1. Effect of water depth and gender on
plainstates a cause- Asserted: passes — The authors put it forward as true.
- Checkable: passes — It can be checked against evidence.
- Load-bearing: passes — The paper’s conclusions depend on it.
- Based: passes — The paper gives a reason why it holds.
A result the paper reports from its own data — it cites no other source for it, so there is none to check. The quote shows it is in the paper.
In the paper
“The analysis shows that gender differences in stride frequency (χ 2 = 46.8,p < 0.0001) and step length (χ 2 = 46.2,p < 0.0001) are significant only at 0 m water depth.”
§ IMPACTS OF WATER DEPTH ON PEDESTRIAN SPEED, GAIT, AND STABILITY: RESULTS FROM AN EXPERIMENTAL STUDY > 3.3.1. Effect of water depth and gender on
plainstates an association- Asserted: passes — The authors put it forward as true.
- Checkable: passes — It can be checked against evidence.
- Load-bearing: unclear — It is unclear whether the paper’s conclusions depend on it.
- Based: passes — The paper gives a reason why it holds.
A result the paper reports from its own data — it cites no other source for it, so there is none to check. The quote shows it is in the paper.
In the paper
“Unlike the linear relationships identified in prior study [31], no significant linear correlation was detected in this study.”
§ IMPACTS OF WATER DEPTH ON PEDESTRIAN SPEED, GAIT, AND STABILITY: RESULTS FROM AN EXPERIMENTAL STUDY > 3.3.1. Effect of water depth and gender on
plain- Asserted: passes — The authors put it forward as true.
- Checkable: passes — It can be checked against evidence.
- Load-bearing: unclear — It is unclear whether the paper’s conclusions depend on it.
- Based: passes — The paper gives a reason why it holds.
A result the paper reports from its own data — it cites no other source for it, so there is none to check. The quote shows it is in the paper.
In the paper
“The analysis shows that gender differences in stride frequency (χ 2 = 46.8,p < 0.0001) and step length (χ 2 = 46.2,p < 0.0001) are significant only at 0 m water depth.”
§ IMPACTS OF WATER DEPTH ON PEDESTRIAN SPEED, GAIT, AND STABILITY: RESULTS FROM AN EXPERIMENTAL STUDY > 3.3.1. Effect of water depth and gender on
plainstates an association- Asserted: passes — The authors put it forward as true.
- Checkable: passes — It can be checked against evidence.
- Load-bearing: unclear — It is unclear whether the paper’s conclusions depend on it.
- Based: passes — The paper gives a reason why it holds.
- It may state two separate claims as one. 35
- Probably not a substantial claim. 17
A result the paper reports from its own data — it cites no other source for it, so there is none to check. The quote shows it is in the paper.
In the paper
“while step length decreases significantly as water depth increases: at 0 m water depth, the average step lengths for females and males are 0.75 m and 0.81 m, respectively; at 0.35 m, 0.60 m, and 0.90 m water depths, step lengths decrease to 0.51 m, 0.48 m, and 0.46 m, respectively.”
§ IMPACTS OF WATER DEPTH ON PEDESTRIAN SPEED, GAIT, AND STABILITY: RESULTS FROM AN EXPERIMENTAL STUDY > 4. Discussion and conclusion
plainstates a cause- Asserted: passes — The authors put it forward as true.
- Checkable: passes — It can be checked against evidence.
- Load-bearing: passes — The paper’s conclusions depend on it.
- Based: passes — The paper gives a reason why it holds.
It may state two separate claims as one.
A result the paper reports from its own data — it cites no other source for it, so there is none to check. The quote shows it is in the paper.
In the paper
“Additionally, water depth significantly affects both stride frequency (χ 2 = 133.4,DF = 3, p < 0.0001) and step length (χ 2 = 306.0,DF = 3, p < 0.0001).”
§ IMPACTS OF WATER DEPTH ON PEDESTRIAN SPEED, GAIT, AND STABILITY: RESULTS FROM AN EXPERIMENTAL STUDY > 4. Discussion and conclusion
plainstates a cause- Asserted: passes — The authors put it forward as true.
- Checkable: passes — It can be checked against evidence.
- Load-bearing: passes — The paper’s conclusions depend on it.
- Based: passes — The paper gives a reason why it holds.
It may state two separate claims as one.
A result the paper reports from its own data — it cites no other source for it, so there is none to check. The quote shows it is in the paper.
In the paper
“The analysis indicated a significant overall difference in speed among these groups (χ 2 = 308.95,DF = 7, p < 0.001), suggesting that both gender and water depth jointly affected pedestrian speed.”
§ IMPACTS OF WATER DEPTH ON PEDESTRIAN SPEED, GAIT, AND STABILITY: RESULTS FROM AN EXPERIMENTAL STUDY > Additional information
hedgedstates an association- Asserted: passes — The authors put it forward as true.
- Checkable: passes — It can be checked against evidence.
- Load-bearing: passes — The paper’s conclusions depend on it.
- Based: passes — The paper gives a reason why it holds.
It may state two separate claims as one.
A result the paper reports from its own data — it cites no other source for it, so there is none to check. The quote shows it is in the paper.
In the paper
“Dunn's post-hoc test (Table 5 in Appendix A.2) indicated no significant difference between swaying amplitudes at 0.35 m and 0.60 m depths, while significant differences were observed between all other depths.”
- Also stated in: § Additional information · plain
“Dunn's post-hoc test (Table 5) indicated no significant difference between swaying amplitudes at 0.35 m and 0.60 m depths, while significant differences were observed between all other depths.”
§ IMPACTS OF WATER DEPTH ON PEDESTRIAN SPEED, GAIT, AND STABILITY: RESULTS FROM AN EXPERIMENTAL STUDY > 3.3.1. Effect of water depth and gender on
plain- Asserted: passes — The authors put it forward as true.
- Checkable: passes — It can be checked against evidence.
- Load-bearing: passes — The paper’s conclusions depend on it.
- Based: passes — The paper gives a reason why it holds.
It may state two separate claims as one.
- Also stated in: § Additional information · plain
A result the paper reports from its own data — it cites no other source for it, so there is none to check. The quote shows it is in the paper.
In the paper
“The results showed that gender had no significant effect on speed under dry conditions (0 m depth, p = 1), while significant gender differences emerged at all flooded depths (p < 0.001).”
§ IMPACTS OF WATER DEPTH ON PEDESTRIAN SPEED, GAIT, AND STABILITY: RESULTS FROM AN EXPERIMENTAL STUDY > Additional information
plain- Asserted: passes — The authors put it forward as true.
- Checkable: passes — It can be checked against evidence.
- Load-bearing: passes — The paper’s conclusions depend on it.
- Based: passes — The paper gives a reason why it holds.
It may state two separate claims as one.
A result the paper reports from its own data — it cites no other source for it, so there is none to check. The quote shows it is in the paper.
In the paper
“(1) Water depth and gender significantly influenced pedestrian speeds, with a notable decline in speed as water depth increased.”
§ IMPACTS OF WATER DEPTH ON PEDESTRIAN SPEED, GAIT, AND STABILITY: RESULTS FROM AN EXPERIMENTAL STUDY > 4. Discussion and conclusion
plainstates a cause- Asserted: passes — The authors put it forward as true.
- Checkable: passes — It can be checked against evidence.
- Load-bearing: passes — The paper’s conclusions depend on it.
- Based: passes — The paper gives a reason why it holds.
It may state two separate claims as one.
A result the paper reports from its own data — it cites no other source for it, so there is none to check. The quote shows it is in the paper.
In the paper
“No significant linear correlation was found between velocity and lateral sway amplitude, with only a weak correlation at 0 m and 0.90 m depths.”
§ IMPACTS OF WATER DEPTH ON PEDESTRIAN SPEED, GAIT, AND STABILITY: RESULTS FROM AN EXPERIMENTAL STUDY > 4. Discussion and conclusion
plain- Asserted: passes — The authors put it forward as true.
- Checkable: passes — It can be checked against evidence.
- Load-bearing: unclear — It is unclear whether the paper’s conclusions depend on it.
- Based: passes — The paper gives a reason why it holds.
It may state two separate claims as one.
A result the paper reports from its own data — it cites no other source for it, so there is none to check. The quote shows it is in the paper.
In the paper
“The greatest sway amplitudes were observed at water depths of 0.35 m and 0.60 m, followed by a decline at 0.90 m depth”
§ IMPACTS OF WATER DEPTH ON PEDESTRIAN SPEED, GAIT, AND STABILITY: RESULTS FROM AN EXPERIMENTAL STUDY > 4. Discussion and conclusion
plainstates an association- Asserted: passes — The authors put it forward as true.
- Checkable: passes — It can be checked against evidence.
- Load-bearing: passes — The paper’s conclusions depend on it.
- Based: passes — The paper gives a reason why it holds.
It may state two separate claims as one.
A result the paper reports from its own data — it cites no other source for it, so there is none to check. The quote shows it is in the paper.
In the paper
“The experiment involved 188 student volunteers (101 males and 87 females) aged 16 to 33 years, with an average age of 22.3 ± 3.5 years, an average height of 1.7 ± 0.1 m, and an average weight of 62.6 ± 12.0 kg.”
§ IMPACTS OF WATER DEPTH ON PEDESTRIAN SPEED, GAIT, AND STABILITY: RESULTS FROM AN EXPERIMENTAL STUDY > 2.2. Participant characteristics
plainn = 188- Asserted: passes — The authors put it forward as true.
- Checkable: passes — It can be checked against evidence.
- Load-bearing: fails — The paper’s conclusions may not depend on it.
- Based: passes — The paper gives a reason why it holds.
Probably not a substantial claim. The paper’s conclusions may not depend on it. It may state two separate claims as one.
A result the paper reports from its own data — it cites no other source for it, so there is none to check. The quote shows it is in the paper.
In the paper
“The results show that gender (p < 0.001) and water depth (p < 0.001) are the primary factors influencing walking speed, whereas height (p = 0.835) and weight (p = 0.597) are no longer statistically significant after controlling for other variables”
§ IMPACTS OF WATER DEPTH ON PEDESTRIAN SPEED, GAIT, AND STABILITY: RESULTS FROM AN EXPERIMENTAL STUDY > 3.2. Speed
plainstates an association- Asserted: passes — The authors put it forward as true.
- Checkable: passes — It can be checked against evidence.
- Load-bearing: passes — The paper’s conclusions depend on it.
- Based: passes — The paper gives a reason why it holds.
It may state two separate claims as one.
A result the paper reports from its own data — it cites no other source for it, so there is none to check. The quote shows it is in the paper.
In the paper
“(3) Water depth significantly impacted step length, stride frequency, and gait stability.”
§ IMPACTS OF WATER DEPTH ON PEDESTRIAN SPEED, GAIT, AND STABILITY: RESULTS FROM AN EXPERIMENTAL STUDY > 4. Discussion and conclusion
plainstates a cause- Asserted: passes — The authors put it forward as true.
- Checkable: passes — It can be checked against evidence.
- Load-bearing: passes — The paper’s conclusions depend on it.
- Based: passes — The paper gives a reason why it holds.
It may state two separate claims as one.
- Rests on an assumption: A lower coefficient of variation in stride frequency and step length indicates greater gait stability.
A result the paper reports from its own data — it cites no other source for it, so there is none to check. The quote shows it is in the paper.
In the paper
“Specifically, pedestrian speeds decreased markedly (by 38.6 % for males and 44.8 % for females) when transitioning from 0 m to 0.35 m water depth, with further increases in water depth showing minimal additional decrease.”
§ IMPACTS OF WATER DEPTH ON PEDESTRIAN SPEED, GAIT, AND STABILITY: RESULTS FROM AN EXPERIMENTAL STUDY > 4. Discussion and conclusion
plainstates a cause- Asserted: passes — The authors put it forward as true.
- Checkable: passes — It can be checked against evidence.
- Load-bearing: passes — The paper’s conclusions depend on it.
- Based: passes — The paper gives a reason why it holds.
It may state two separate claims as one.
The paper states this without a source or data behind it here, so there is nothing to check it against. The quote shows it is in the paper.
In the paper
“pedestrians displayed a range of gaits in water, including regular strides and mini-strides, with no instances of footlifting above the water surface, even in shallow depths (0.35 m).”
§ IMPACTS OF WATER DEPTH ON PEDESTRIAN SPEED, GAIT, AND STABILITY: RESULTS FROM AN EXPERIMENTAL STUDY > 3.1. Trajectories and pedestrian behavior
plain- Asserted: passes — The authors put it forward as true.
- Checkable: passes — It can be checked against evidence.
- Load-bearing: unclear — It is unclear whether the paper’s conclusions depend on it.
- Based: passes — The paper gives a reason why it holds.
It may state two separate claims as one.
None of the sources cited for this claim could be matched to a paper in Crossref, so there is nothing to check it against.
In the paper
“Compared with previous studies [25][26][27][28], this work involved a larger sample size”
§ IMPACTS OF WATER DEPTH ON PEDESTRIAN SPEED, GAIT, AND STABILITY: RESULTS FROM AN EXPERIMENTAL STUDY > 4. Discussion and conclusion
What the sources say
- Not matchedcites [25]
Couldn’t be matched to a paper in Crossref, so it can’t be checked.
- Not matchedcites [26]
Couldn’t be matched to a paper in Crossref, so it can’t be checked.
- Not matchedcites [27]
Couldn’t be matched to a paper in Crossref, so it can’t be checked.
plain- Asserted: passes — The authors put it forward as true.
- Checkable: passes — It can be checked against evidence.
- Load-bearing: fails — The paper’s conclusions may not depend on it.
- Based: passes — The paper gives a reason why it holds.
Probably not a substantial claim. The paper’s conclusions may not depend on it.
- Not matched
A result the paper reports from its own data — it cites no other source for it, so there is none to check. The quote shows it is in the paper.
In the paper
“However, as the water depth increased to 0.90 m, there was a marked increase in the CV of step length, and a corresponding increase in the CV of stride frequency, indicating a reduction in gait stability.”
§ IMPACTS OF WATER DEPTH ON PEDESTRIAN SPEED, GAIT, AND STABILITY: RESULTS FROM AN EXPERIMENTAL STUDY > 3.3.2. Effect of water depth and gender on stride frequency and step length
hedgedstates a cause- Asserted: passes — The authors put it forward as true.
- Checkable: passes — It can be checked against evidence.
- Load-bearing: passes — The paper’s conclusions depend on it.
- Based: passes — The paper gives a reason why it holds.
It may state two separate claims as one.
- Rests on an assumption: A lower coefficient of variation in stride frequency and step length indicates greater gait stability.
A result the paper reports from its own data — it cites no other source for it, so there is none to check. The quote shows it is in the paper.
In the paper
“The CV s for both parameters were lower in the no-water (0 m) and shallower water depths (0.35 m and 0.60 m), suggesting a more stable gait.”
§ IMPACTS OF WATER DEPTH ON PEDESTRIAN SPEED, GAIT, AND STABILITY: RESULTS FROM AN EXPERIMENTAL STUDY > 3.3.2. Effect of water depth and gender on stride frequency and step length
hedgedstates an association- Asserted: passes — The authors put it forward as true.
- Checkable: passes — It can be checked against evidence.
- Load-bearing: passes — The paper’s conclusions depend on it.
- Based: passes — The paper gives a reason why it holds.
It may state two separate claims as one.
- Rests on an assumption: A lower coefficient of variation in stride frequency and step length indicates greater gait stability.
A result the paper reports from its own data — it cites no other source for it, so there is none to check. The quote shows it is in the paper.
In the paper
“Gender differences in speed were pronounced in water, revealing that female speeds were particularly sensitive to water depth changes.”
§ IMPACTS OF WATER DEPTH ON PEDESTRIAN SPEED, GAIT, AND STABILITY: RESULTS FROM AN EXPERIMENTAL STUDY > 4. Discussion and conclusion
plainstates an association- Asserted: passes — The authors put it forward as true.
- Checkable: passes — It can be checked against evidence.
- Load-bearing: passes — The paper’s conclusions depend on it.
- Based: passes — The paper gives a reason why it holds.
It may state two separate claims as one.
A result the paper reports from its own data — it cites no other source for it, so there is none to check. The quote shows it is in the paper.
In the paper
“at 0 m water depth, the average step lengths for females and males are 0.75 m and 0.81 m, respectively; at 0.35 m, 0.60 m, and 0.90 m water depths, step lengths decrease to 0.51 m, 0.48 m, and 0.46 m, respectively.”
§ IMPACTS OF WATER DEPTH ON PEDESTRIAN SPEED, GAIT, AND STABILITY: RESULTS FROM AN EXPERIMENTAL STUDY > 3.3.1. Effect of water depth and gender on
plainstates a cause- Asserted: passes — The authors put it forward as true.
- Checkable: passes — It can be checked against evidence.
- Load-bearing: passes — The paper’s conclusions depend on it.
- Based: passes — The paper gives a reason why it holds.
It may state two separate claims as one.
The paper states this without a source or data behind it here, so there is nothing to check it against. The quote shows it is in the paper.
In the paper
“focused on a consistent age group”
§ IMPACTS OF WATER DEPTH ON PEDESTRIAN SPEED, GAIT, AND STABILITY: RESULTS FROM AN EXPERIMENTAL STUDY > 4. Discussion and conclusion
plain- Asserted: passes — The authors put it forward as true.
- Checkable: passes — It can be checked against evidence.
- Load-bearing: fails — The paper’s conclusions may not depend on it.
- Based: passes — The paper gives a reason why it holds.
Probably not a substantial claim. The paper’s conclusions may not depend on it.
A result the paper reports from its own data — it cites no other source for it, so there is none to check. The quote shows it is in the paper.
In the paper
“Dunn's post-hoc analysis (see Appendix A.2) showed no significant gender difference at 0 m depth (p = 1), while significant differences were observed at other depths (p < 0.001).”
§ IMPACTS OF WATER DEPTH ON PEDESTRIAN SPEED, GAIT, AND STABILITY: RESULTS FROM AN EXPERIMENTAL STUDY > 3.2.1. Effect of water depth and gender on speed
plain- Asserted: passes — The authors put it forward as true.
- Checkable: passes — It can be checked against evidence.
- Load-bearing: unclear — It is unclear whether the paper’s conclusions depend on it.
- Based: passes — The paper gives a reason why it holds.
It may state two separate claims as one.
A result the paper reports from its own data — it cites no other source for it, so there is none to check. The quote shows it is in the paper.
In the paper
“we observe that IQR values decline as water depth increases.This indicates reduced data dispersion with increasing depth”
§ IMPACTS OF WATER DEPTH ON PEDESTRIAN SPEED, GAIT, AND STABILITY: RESULTS FROM AN EXPERIMENTAL STUDY > 3.2.1. Effect of water depth and gender on speed
hedgedstates a cause- Asserted: passes — The authors put it forward as true.
- Checkable: passes — It can be checked against evidence.
- Load-bearing: unclear — It is unclear whether the paper’s conclusions depend on it.
- Based: passes — The paper gives a reason why it holds.
It may state two separate claims as one.
A result the paper reports from its own data — it cites no other source for it, so there is none to check. The quote shows it is in the paper.
In the paper
“As velocity continues to rise, both step length and stride frequency increase concurrently.”
§ IMPACTS OF WATER DEPTH ON PEDESTRIAN SPEED, GAIT, AND STABILITY: RESULTS FROM AN EXPERIMENTAL STUDY > 3.3.1. Effect of water depth and gender on
plainstates an association- Asserted: passes — The authors put it forward as true.
- Checkable: passes — It can be checked against evidence.
- Load-bearing: unclear — It is unclear whether the paper’s conclusions depend on it.
- Based: passes — The paper gives a reason why it holds.
It may state two separate claims as one.
What the paper did — it cites no source for this, so there is none to check. The quote shows it is in the paper.
In the paper
“The experimental protocols were reviewed and approved by the institutional ethics committee (No. 2024-N(H)-317).”
§ IMPACTS OF WATER DEPTH ON PEDESTRIAN SPEED, GAIT, AND STABILITY: RESULTS FROM AN EXPERIMENTAL STUDY > 2. Experiment setup
plain- Asserted: passes — The authors put it forward as true.
- Checkable: passes — It can be checked against evidence.
- Load-bearing: fails — The paper’s conclusions may not depend on it.
- Based: passes — The paper gives a reason why it holds.
Probably not a substantial claim. The paper’s conclusions may not depend on it.
A conclusion the paper draws from its own results — it cites no other source for it, so there is none to check. The quote shows it is in the paper.
In the paper
“These findings suggest that deeper water depths introduce greater perturbations to pedestrian gait, leading to higher variability in both step length and stride frequency.”
§ IMPACTS OF WATER DEPTH ON PEDESTRIAN SPEED, GAIT, AND STABILITY: RESULTS FROM AN EXPERIMENTAL STUDY > 3.3.2. Effect of water depth and gender on stride frequency and step length
hedgedstates a cause- Asserted: passes — The authors put it forward as true.
- Checkable: passes — It can be checked against evidence.
- Load-bearing: passes — The paper’s conclusions depend on it.
- Based: passes — The paper gives a reason why it holds.
It may state two separate claims as one.
- Rests on an assumption: A lower coefficient of variation in stride frequency and step length indicates greater gait stability.
In the paper
“Petrack software [30] was used to calibrate the video, converting 2D pixel coordinates into real-world 3D coordinates.The average error for the present dataset was less than 0.02 m.”
§ IMPACTS OF WATER DEPTH ON PEDESTRIAN SPEED, GAIT, AND STABILITY: RESULTS FROM AN EXPERIMENTAL STUDY > 2.3. Experimental procedure and data extraction
What the sources say
- Not matchedcites [30]
Couldn’t be matched to a paper in Crossref, so it can’t be checked.
plain- Asserted: passes — The authors put it forward as true.
- Checkable: passes — It can be checked against evidence.
- Load-bearing: passes — The paper’s conclusions depend on it.
- Based: passes — The paper gives a reason why it holds.
Probably not a substantial claim. It may state two separate claims as one.
- Not matched
A conclusion the paper draws from its own results — it cites no other source for it, so there is none to check. The quote shows it is in the paper.
In the paper
“In this study, pedestrian speeds were slightly higher, likely reflecting differences in experimental settings, cultural background, and participant characteristics.”
§ IMPACTS OF WATER DEPTH ON PEDESTRIAN SPEED, GAIT, AND STABILITY: RESULTS FROM AN EXPERIMENTAL STUDY > 3.2.2. Comparison with previous studies
hedgedstates a possible cause- Asserted: passes — The authors put it forward as true.
- Checkable: passes — It can be checked against evidence.
- Load-bearing: fails — The paper’s conclusions may not depend on it.
- Based: passes — The paper gives a reason why it holds.
Probably not a substantial claim. The paper’s conclusions may not depend on it. It may state two separate claims as one.
A conclusion the paper draws from its own results — it cites no other source for it, so there is none to check. The quote shows it is in the paper.
In the paper
“However, at depths of 0.35 m and 0.60 m, where the lower body was partially submerged, a greater lateral swaying was necessary to maintain stability, resulting in increased swaying amplitude.”
§ IMPACTS OF WATER DEPTH ON PEDESTRIAN SPEED, GAIT, AND STABILITY: RESULTS FROM AN EXPERIMENTAL STUDY > 3.3.1. Effect of water depth and gender on
plainstates a cause- Asserted: passes — The authors put it forward as true.
- Checkable: passes — It can be checked against evidence.
- Load-bearing: passes — The paper’s conclusions depend on it.
- Based: passes — The paper gives a reason why it holds.
It may state two separate claims as one.
A conclusion the paper draws from its own results — it cites no other source for it, so there is none to check. The quote shows it is in the paper.
In the paper
“These findings suggest that water depths of 0.35 m and 0.60 m may create similar resistance and support conditions, yielding comparable sway dynamics.”
§ IMPACTS OF WATER DEPTH ON PEDESTRIAN SPEED, GAIT, AND STABILITY: RESULTS FROM AN EXPERIMENTAL STUDY > 3.3.1. Effect of water depth and gender on
hedgedstates a possible cause- Asserted: passes — The authors put it forward as true.
- Checkable: passes — It can be checked against evidence.
- Load-bearing: passes — The paper’s conclusions depend on it.
- Based: passes — The paper gives a reason why it holds.
It may state two separate claims as one.
The paper states this without a source or data behind it here, so there is nothing to check it against. The quote shows it is in the paper.
In the paper
“However, existing research has yet to reach a consensus regarding the impact of gender on movement speed, and there remains a paucity of data on pedestrian gait characteristics.”
§ IMPACTS OF WATER DEPTH ON PEDESTRIAN SPEED, GAIT, AND STABILITY: RESULTS FROM AN EXPERIMENTAL STUDY > 1. Introduction
plain- Asserted: passes — The authors put it forward as true.
- Checkable: passes — It can be checked against evidence.
- Load-bearing: passes — The paper’s conclusions depend on it.
- Based: fails — The paper may give no reason why it holds.
Probably not a substantial claim. The paper may give no reason why it holds.
What the paper did — it cites no source for this, so there is none to check. The quote shows it is in the paper.
In the paper
“Analyses were limited to pedestrian trajectory data and did not include potential psychological factors such as stress and fatigue.”
§ IMPACTS OF WATER DEPTH ON PEDESTRIAN SPEED, GAIT, AND STABILITY: RESULTS FROM AN EXPERIMENTAL STUDY > 4. Discussion and conclusion
plain- Asserted: passes — The authors put it forward as true.
- Checkable: passes — It can be checked against evidence.
- Load-bearing: fails — The paper’s conclusions may not depend on it.
- Based: passes — The paper gives a reason why it holds.
Probably not a substantial claim. The paper’s conclusions may not depend on it. It may state two separate claims as one.
In the paper
“Findings indicate that human instability arises from two primary physical mechanisms: moment instability (tipping) and friction instability (slipping) [21].”
§ IMPACTS OF WATER DEPTH ON PEDESTRIAN SPEED, GAIT, AND STABILITY: RESULTS FROM AN EXPERIMENTAL STUDY > 1. Introduction
What the sources say
- Not matchedcites [21]
Couldn’t be matched to a paper in Crossref, so it can’t be checked.
hedgedstates a cause- Asserted: passes — The authors put it forward as true.
- Checkable: passes — It can be checked against evidence.
- Load-bearing: fails — The paper’s conclusions may not depend on it.
- Based: passes — The paper gives a reason why it holds.
Probably not a substantial claim. The paper’s conclusions may not depend on it.
- Not matched
What the paper did — it cites no source for this, so there is none to check. The quote shows it is in the paper.
In the paper
“Additionally, the sample consisted solely of college students, a relatively homogeneous group that may not fully represent broader demographic variations.”
§ IMPACTS OF WATER DEPTH ON PEDESTRIAN SPEED, GAIT, AND STABILITY: RESULTS FROM AN EXPERIMENTAL STUDY > 4. Discussion and conclusion
hedged- Asserted: passes — The authors put it forward as true.
- Checkable: passes — It can be checked against evidence.
- Load-bearing: fails — The paper’s conclusions may not depend on it.
- Based: passes — The paper gives a reason why it holds.
Probably not a substantial claim. The paper’s conclusions may not depend on it. It may state two separate claims as one.
What the paper did — it cites no source for this, so there is none to check. The quote shows it is in the paper.
In the paper
“Since speed distributions did not meet normality assumptions, the nonparametric Kruskal-Wallis H-test was applied”
§ IMPACTS OF WATER DEPTH ON PEDESTRIAN SPEED, GAIT, AND STABILITY: RESULTS FROM AN EXPERIMENTAL STUDY > Additional information
plain- Asserted: passes — The authors put it forward as true.
- Checkable: passes — It can be checked against evidence.
- Load-bearing: passes — The paper’s conclusions depend on it.
- Based: passes — The paper gives a reason why it holds.
Probably not a substantial claim.
In the paper
“Furthermore, the minimum walking speed v m in under varying characteristic flood forces M serves as a conservative benchmark for assessing pedestrian evacuation speed in flood conditions [32].”
§ IMPACTS OF WATER DEPTH ON PEDESTRIAN SPEED, GAIT, AND STABILITY: RESULTS FROM AN EXPERIMENTAL STUDY > Additional information
What the sources say
- Not matchedcites [32]
Couldn’t be matched to a paper in Crossref, so it can’t be checked.
plain- Asserted: passes — The authors put it forward as true.
- Checkable: passes — It can be checked against evidence.
- Load-bearing: fails — The paper’s conclusions may not depend on it.
- Based: passes — The paper gives a reason why it holds.
Probably not a substantial claim. The paper’s conclusions may not depend on it.
- Rests on an assumption: The relationship between characteristic flood force M and pedestrian walking speed v_i (Eq. 3) is extensively applied in flood evacuation modeling.
- The authors state this as an assumption: The specific flood force M is determined by flood depth and flow velocity as expressed in Eq. 2, and this model is valid for the hydrostatic conditions of this study.
- Not matched
What the paper did — it cites no source for this, so there is none to check. The quote shows it is in the paper.
In the paper
“To prevent interference, each volunteer was tested individually.”
§ IMPACTS OF WATER DEPTH ON PEDESTRIAN SPEED, GAIT, AND STABILITY: RESULTS FROM AN EXPERIMENTAL STUDY > 2.3. Experimental procedure and data extraction
plain- Asserted: passes — The authors put it forward as true.
- Checkable: passes — It can be checked against evidence.
- Load-bearing: fails — The paper’s conclusions may not depend on it.
- Based: passes — The paper gives a reason why it holds.
Probably not a substantial claim. The paper’s conclusions may not depend on it.
The paper states this without a source or data behind it here, so there is nothing to check it against. The quote shows it is in the paper.
In the paper
“However, existing research has yet to reach a consensus regarding the impact of gender on movement speed, and there remains a paucity of data on pedestrian gait characteristics.”
§ IMPACTS OF WATER DEPTH ON PEDESTRIAN SPEED, GAIT, AND STABILITY: RESULTS FROM AN EXPERIMENTAL STUDY > 1. Introduction
plain- Asserted: passes — The authors put it forward as true.
- Checkable: passes — It can be checked against evidence.
- Load-bearing: passes — The paper’s conclusions depend on it.
- Based: fails — The paper may give no reason why it holds.
Probably not a substantial claim. The paper may give no reason why it holds.
A conclusion the paper draws from its own results — it cites no other source for it, so there is none to check. The quote shows it is in the paper.
In the paper
“This pattern suggests that, under normal conditions, females tend to maintain greater body stability during walking, whereas males exhibit relatively larger lateral body movements because of a more expressive walking style.”
§ IMPACTS OF WATER DEPTH ON PEDESTRIAN SPEED, GAIT, AND STABILITY: RESULTS FROM AN EXPERIMENTAL STUDY > 3.3.1. Effect of water depth and gender on
hedgedstates a cause- Asserted: passes — The authors put it forward as true.
- Checkable: passes — It can be checked against evidence.
- Load-bearing: passes — The paper’s conclusions depend on it.
- Based: passes — The paper gives a reason why it holds.
It may state two separate claims as one.
In the paper
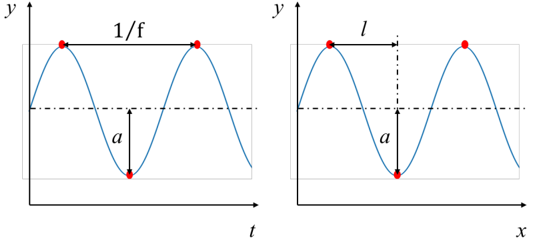
“Following the method developed by Cao et al. [33] we calculated the trajectory curvature to quantify lateral swaying amplitude, stride frequency, and step length.”
§ IMPACTS OF WATER DEPTH ON PEDESTRIAN SPEED, GAIT, AND STABILITY: RESULTS FROM AN EXPERIMENTAL STUDY > Additional information
What the sources say
- Not matchedcites Cao et al. [33]
Couldn’t be matched to a paper in Crossref, so it can’t be checked.
plain- Asserted: passes — The authors put it forward as true.
- Checkable: passes — It can be checked against evidence.
- Load-bearing: passes — The paper’s conclusions depend on it.
- Based: passes — The paper gives a reason why it holds.
Probably not a substantial claim.
- Not matched
What the paper did — it cites no source for this, so there is none to check. The quote shows it is in the paper.
In the paper
“In-water trials were performed in a swimming pool under controlled conditions, maintaining a water temperature of 26 °C, standard water density, clear water free of sediment or silt, and no currents, other than those induced by the movement of participants.”
§ IMPACTS OF WATER DEPTH ON PEDESTRIAN SPEED, GAIT, AND STABILITY: RESULTS FROM AN EXPERIMENTAL STUDY > 2.1. Experimental environment
plain- Asserted: passes — The authors put it forward as true.
- Checkable: passes — It can be checked against evidence.
- Load-bearing: fails — The paper’s conclusions may not depend on it.
- Based: passes — The paper gives a reason why it holds.
Probably not a substantial claim. The paper’s conclusions may not depend on it. It may state two separate claims as one.
A conclusion the paper draws from its own results — it cites no other source for it, so there is none to check. The quote shows it is in the paper.
In the paper
“implying that deeper water not only slows pedestrian speeds but also minimizes speed variation within each gender group.”
§ IMPACTS OF WATER DEPTH ON PEDESTRIAN SPEED, GAIT, AND STABILITY: RESULTS FROM AN EXPERIMENTAL STUDY > 3.2.1. Effect of water depth and gender on speed
hedgedstates a cause- Asserted: passes — The authors put it forward as true.
- Checkable: passes — It can be checked against evidence.
- Load-bearing: passes — The paper’s conclusions depend on it.
- Based: passes — The paper gives a reason why it holds.
It may state two separate claims as one.
What the paper did — it cites no source for this, so there is none to check. The quote shows it is in the paper.
In the paper
“First, the experimental environment was idealized and did not account for the effects of flowing water or small waves generated by pedestrian movement, which may influence ground visibility, both of which are common in real flood scenarios.”
§ IMPACTS OF WATER DEPTH ON PEDESTRIAN SPEED, GAIT, AND STABILITY: RESULTS FROM AN EXPERIMENTAL STUDY > 4. Discussion and conclusion
hedged- Asserted: passes — The authors put it forward as true.
- Checkable: passes — It can be checked against evidence.
- Load-bearing: unclear — It is unclear whether the paper’s conclusions depend on it.
- Based: passes — The paper gives a reason why it holds.
It may state two separate claims as one.
A conclusion the paper draws from its own results — it cites no other source for it, so there is none to check. The quote shows it is in the paper.
In the paper
“suggesting that pedestrians increase body sway to maintain balance, thus requiring greater personal space.”
§ IMPACTS OF WATER DEPTH ON PEDESTRIAN SPEED, GAIT, AND STABILITY: RESULTS FROM AN EXPERIMENTAL STUDY > 4. Discussion and conclusion
hedgedstates a cause- Asserted: passes — The authors put it forward as true.
- Checkable: passes — It can be checked against evidence.
- Load-bearing: passes — The paper’s conclusions depend on it.
- Based: passes — The paper gives a reason why it holds.
It may state two separate claims as one.
- Rests on an assumption: Lateral body sway is essential for maintaining balance while walking, and stride frequency and step length are key determinants of pedestrian speed.
A conclusion the paper draws from its own results — it cites no other source for it, so there is none to check. The quote shows it is in the paper.
In the paper
“In water, however, the combined effects of resistance and buoyancy necessitate greater lateral swaying for balance, thereby reducing the sensitivity of lateral swaying to gender differences.”
§ IMPACTS OF WATER DEPTH ON PEDESTRIAN SPEED, GAIT, AND STABILITY: RESULTS FROM AN EXPERIMENTAL STUDY > 3.3.1. Effect of water depth and gender on
plainstates a cause- Asserted: passes — The authors put it forward as true.
- Checkable: passes — It can be checked against evidence.
- Load-bearing: passes — The paper’s conclusions depend on it.
- Based: passes — The paper gives a reason why it holds.
It may state two separate claims as one.
None of the sources cited for this claim could be matched to a paper in Crossref, so there is nothing to check it against.
In the paper
“At greater depths (0.35 m to 0.90 m), the rate of speed reduction diminished, a trend also noted by Lee et al. [27] (0.2 m to 0.5 m) and supported by findings from Dias et al. [28] and Bernardini et al. [25].”
§ IMPACTS OF WATER DEPTH ON PEDESTRIAN SPEED, GAIT, AND STABILITY: RESULTS FROM AN EXPERIMENTAL STUDY > 3.2.2. Comparison with previous studies
What the sources say
- Not matchedcites [27]
Couldn’t be matched to a paper in Crossref, so it can’t be checked.
- Not matchedcites [28]
Couldn’t be matched to a paper in Crossref, so it can’t be checked.
- Not matchedcites [25]
Couldn’t be matched to a paper in Crossref, so it can’t be checked.
plainstates an association- Asserted: passes — The authors put it forward as true.
- Checkable: passes — It can be checked against evidence.
- Load-bearing: unclear — It is unclear whether the paper’s conclusions depend on it.
- Based: passes — The paper gives a reason why it holds.
It may state two separate claims as one.
- Not matched
A conclusion the paper draws from its own results — it cites no other source for it, so there is none to check. The quote shows it is in the paper.
In the paper
“At 0.90 m, as the legs were fully submerged and constrained by the current, the water provided additional support, enhancing stability and reducing lateral swaying amplitude.”
§ IMPACTS OF WATER DEPTH ON PEDESTRIAN SPEED, GAIT, AND STABILITY: RESULTS FROM AN EXPERIMENTAL STUDY > 3.3.1. Effect of water depth and gender on
plainstates a cause- Asserted: passes — The authors put it forward as true.
- Checkable: passes — It can be checked against evidence.
- Load-bearing: passes — The paper’s conclusions depend on it.
- Based: passes — The paper gives a reason why it holds.
It may state two separate claims as one.
In the paper
“This discrepancy may be due to differences in experimental motivation.”
§ IMPACTS OF WATER DEPTH ON PEDESTRIAN SPEED, GAIT, AND STABILITY: RESULTS FROM AN EXPERIMENTAL STUDY > 3.2.2. Comparison with previous studies
What the sources say
- Not matchedcites [25]
Couldn’t be matched to a paper in Crossref, so it can’t be checked.
hedgedstates a possible cause- Asserted: passes — The authors put it forward as true.
- Checkable: passes — It can be checked against evidence.
- Load-bearing: fails — The paper’s conclusions may not depend on it.
- Based: passes — The paper gives a reason why it holds.
Probably not a substantial claim. The paper’s conclusions may not depend on it.
- Not matched
The paper relies on this without support.
The experimental walking task simulates emergency evacuation.
“simulating an emergency evacuation by proceeding quickly and safely through the measurement area to the End Line.”
The paper relies on this without support.
The controlled swimming pool conditions adequately represent floodwater conditions for pedestrian movement.
“In-water trials were performed in a swimming pool under controlled conditions, maintaining a water temperature of 26 °C, standard water density, clear water free of sediment or silt, and no currents, other than those induced by the movement of participants.”
The paper relies on this without support.
The student volunteer sample is representative of the general pedestrian population in flood evacuations.
“The experiment involved 188 student volunteers (101 males and 87 females) aged 16 to 33 years”
The paper relies on this without support.
A lower coefficient of variation in stride frequency and step length indicates greater gait stability.
“A lower CV value indicates greater consistency and smaller fluctuations in the measured parameters.”
The paper relies on this without support.
The relationship between characteristic flood force M and pedestrian walking speed v_i (Eq. 3) is extensively applied in flood evacuation modeling.
“The relationship between characteristic flood force M and pedestrian walking speed v i (Eq. 3) is extensively applied in flood evacuation modeling.”
The authors state this as an assumption.
The specific flood force M is determined by flood depth and flow velocity as expressed in Eq. 2, and this model is valid for the hydrostatic conditions of this study.
“The specific flood force, a critical parameter in flood characterization, is determined by both flood depth and flow velocity, as expressed in Eq. 3.”
The paper relies on this without support.
Lateral body sway is essential for maintaining balance while walking, and stride frequency and step length are key determinants of pedestrian speed.
“Lateral body sway is essential for maintaining balance while walking, with stride frequency and step length serving as key determinants of pedestrian speed.”
Self-check
Percentages, sums and reported differences re-computed from the paper’s own numbers.
Each contradiction between two passages listed here was confirmed by an independent check.
Rated minor: it would not touch a result — a value no result rests on, a p-value that stays on the same side of the significance level, or a conflict that is clerical, resolved elsewhere in the paper, or outside its own findings.
In the paper
§ IMPACTS OF WATER DEPTH ON PEDESTRIAN SPEED, GAIT, AND STABILITY: RESULTS FROM AN EXPERIMENTAL STUDY > 1. Introduction
“203 volunteers aged 8 to 68 years”
§ IMPACTS OF WATER DEPTH ON PEDESTRIAN SPEED, GAIT, AND STABILITY: RESULTS FROM AN EXPERIMENTAL STUDY > Additional information
“Bernardini et al. [25] Italy 5∼68 114 89 tank”
Rated minor: it would not touch a result — a value no result rests on, a p-value that stays on the same side of the significance level, or a conflict that is clerical, resolved elsewhere in the paper, or outside its own findings.
In the paper
“97 volunteers (53 males and 42 females) in the 0.60 m depth”
§ IMPACTS OF WATER DEPTH ON PEDESTRIAN SPEED, GAIT, AND STABILITY: RESULTS FROM AN EXPERIMENTAL STUDY > 2.2. Participant characteristics
Reported 97 · recomputed 95
Rated minor: it would not touch a result — a value no result rests on, a p-value that stays on the same side of the significance level, or a conflict that is clerical, resolved elsewhere in the paper, or outside its own findings.
In the paper
§ IMPACTS OF WATER DEPTH ON PEDESTRIAN SPEED, GAIT, AND STABILITY: RESULTS FROM AN EXPERIMENTAL STUDY > Additional information
“significant gender differences emerged at all flooded depths (p < 0.001)”
§ IMPACTS OF WATER DEPTH ON PEDESTRIAN SPEED, GAIT, AND STABILITY: RESULTS FROM AN EXPERIMENTAL STUDY > Additional information
“Male, Female Speed in 0.35 m water -3.29 0.02848 1 Male, Female Speed in 0.60 m water -4.82 <0.0001 1 Male, Female Speed in 0.90 m water 4.06 0.00137 1”
Citations
Cites
Pedestrian Behavior at Bottlenecks
Hoogendoorn, S. P., & Daamen, W. (2005) · Transportation Science · doi:10.1287/trsc.1040.0102 · Cited by 563
Global evidence of rapid urban growth in flood zones since 1985
Rentschler, J. E. M., Avner, P., Marconcini, M., Su, R., Strano, E., Vousdoukas, M. I., & Stéphane Hallegatte, A. (2023) · Nature · doi:10.1038/s41586-023-06468-9 · Cited by 518
Flood-induced mortality across the globe: Spatiotemporal pattern and influencing factors
Hu, P., Zhang, Q., Shi, P., Chen, B., & Fang, J. (2018) · The Science of The Total Environment · doi:10.1016/j.scitotenv.2018.06.197 · Cited by 323
Automatic Extraction of Pedestrian Trajectories from Video Recordings
Boltes, M., Seyfried, A., Steffen, B., & Schadschneider, A. (2009) · Springer eBooks · doi:10.1007/978-3-642-04504-2_3 · Cited by 233
Human Instability in Flood Flows 1
Jonkman, S. N., & Penning‐Rowsell, E. (2008) · JAWRA Journal of the American Water Resources Association · doi:10.1111/j.1752-1688.2008.00217.x · Cited by 223
New criterion for the stability of a human body in floodwaters
Xia, J., Falconer, R. A., Wang, Y., & Xiao, X. (2014) · Journal of Hydraulic Research · doi:10.1080/00221686.2013.875073 · Cited by 209
Experimental study of the stability of pedestrians exposed to urban pluvial flooding
Martínez, E., Gómez, M., & Russo, B. (2016) · Natural Hazards · doi:10.1007/s11069-016-2242-z · Cited by 147
Hydrodynamics of pedestrians' instability in floodwaters
Arrighi, C., Oumeraci, H., & Castelli, F. (2017) · Hydrology and earth system sciences · doi:10.5194/hess-21-515-2017 · Cited by 128
Bernardini, G., Quagliarini, E., D’Orazio, M., & Brocchini, M. (2019) · Safety Science · doi:10.1016/j.ssci.2019.104563 · Cited by 106
Lee, H.-K., Hong, W., & Lee, Y.-H. (2019) · International Journal of Disaster Risk Reduction · doi:10.1016/j.ijdrr.2019.101198 · Cited by 102
Research works printed but not linked: 1
- W. M. Cao, Shuchao, J. Ni, et al. Research on crowd movement characteristics and evacuation modeling in subway stations under flood disaster. Journal of Railway Science and Engineering pp. 1-11, 2023. https: //doi.org/10.19713/j.cnki.43-1423/u.T20230119 · DOI
Cited by
Sorted by citations
Effects of water depth and exit width on bottleneck evacuation dynamics under flood conditions
Li, X., Guo, C., Zhang, J., & Song, W. (2026) · Journal of Hydrology · doi:10.1016/j.jhydrol.2026.136637
Self-citation
Metadata
- Authors
- Li, X., Song, W., Zhang, J., & Bode, N. W. F.
- Venue
- Acta Polytechnica CTU Proceedings
- Published
- 2026-06-16
- Volume
- 57
- Pages
- 226-238
- ISSN
- 2336-5382 (ISSN-L)
- OpenAlex
- W7167206161
- Cited by
- 1
- References
- 30
- Citations by year
- 2026: 1
- FWCI
- 5.89
- Type
- journal article
- Language
- en
- Open access
- diamond
- doi.org
- Locations
- Acta Polytechnica CTU Proceedings (publishedVersion, cc-by)
- Explore Bristol Research (publishedVersion, cc-by)
- DOAJ (DOAJ: Directory of Open Access Journals) (submittedVersion)
- Cvut DSpace (Czech Technical University) (submittedVersion, cc-by)
- Bristol Research (University of Bristol) (submittedVersion, cc-by)
- Funders
- China Scholarship Council
- Topics
- Social Sciences › Safety Research › Evacuation and Crowd Dynamics
- Health Sciences › Health Professions › Physical Therapy, Sports Therapy and Rehabilitation › Balance, Gait, and Falls Prevention
- Physical Sciences › Engineering › Civil and Structural Engineering › Structural Engineering and Vibration Analysis
- Keywords
- water depth, pedestrian speed, gait, gait stability, step length, cadence, gender differences, flood evacuation, flood safety
About these checks
Registry, retraction, Cites and statistics results are computed, not judged, with one exception: a printed reference that no index lists is read once by a model before it counts as a citation error. Claims are extracted by a model and kept only when their quote appears verbatim in the text; each cited source is then checked, with a model’s help, for whether it says what the claim relies on. Those verdicts can be wrong — read the claim’s quote and the cited source before relying on one.
A language model drew the claims from the paper on 2026-11-10, under version 3 of the claim definition (model deepseek-v4.1-flash, prompt extract-v3).
A second model labelled each claim on 2026-11-10 (model jev-1.13-20260917, definition revision gold-guideline-v0.2).
Statistics and arithmetic are recomputed, not judged.
Confidence bands are shown only for fields calibrated on our annotated test set. None is calibrated yet, so no band is shown.
What counts as a claim ›How we measure confidence ›How we check this ›
Are you an author, or do you see a problem with this page? Request a review
