

The DOI matches its Crossref record; 33 of the 33 references it cites were found in a registry or an index.
Determination of benchmark concentrations and their statistical uncertainty for cytotoxicity test data and functional in vitro assays
Abstract
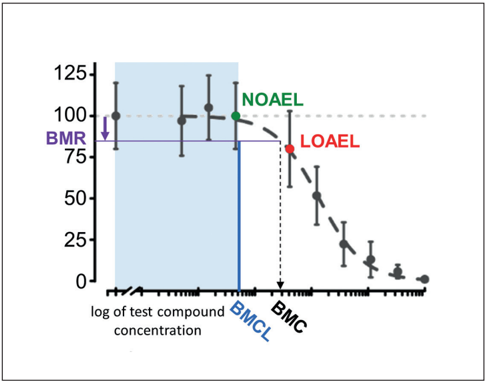
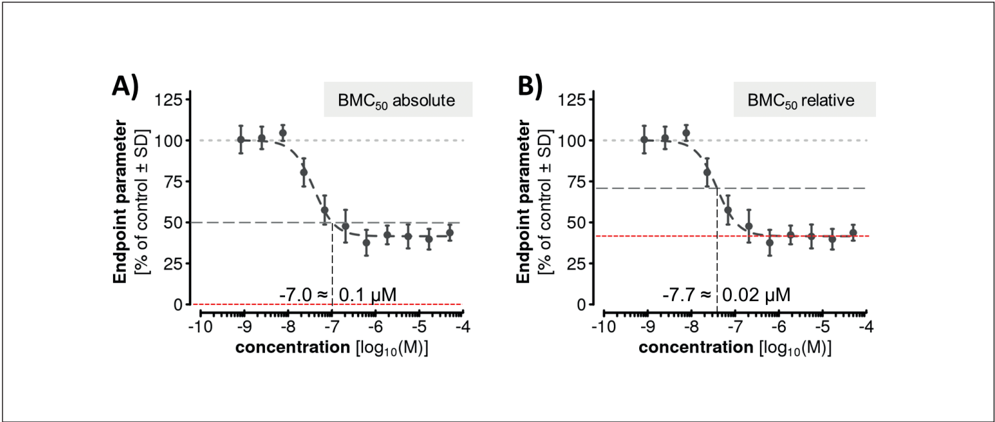
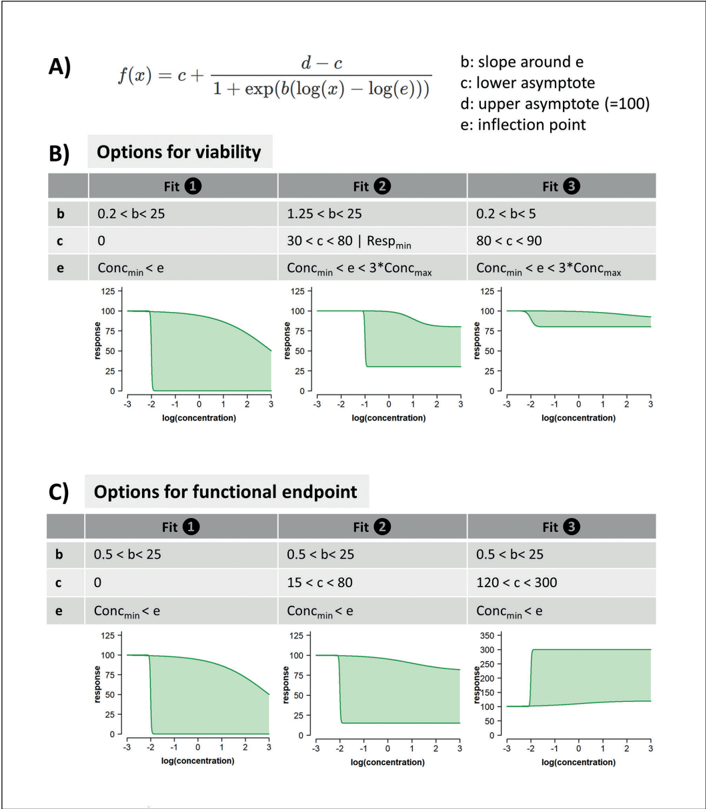
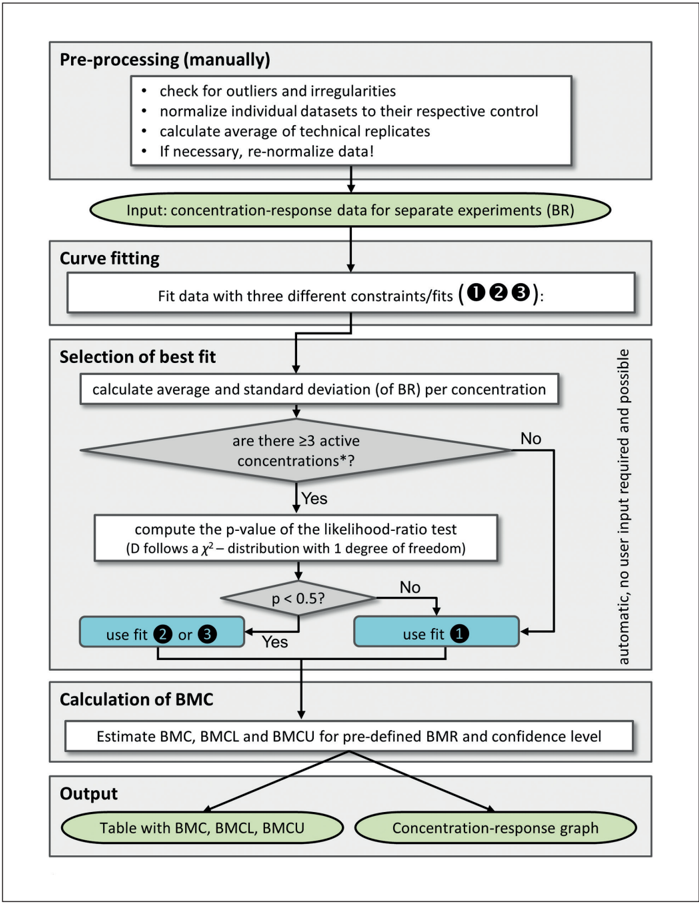
Many toxicological test methods, including assays of cell viability and function, require an evaluation of concentration-response data. This often involves curve fitting, and the resulting mathematical functions are then used to determine the concentration at which a certain deviation from the control value occurs (e.g. a decrease of cell viability by 15%). Such a threshold is called the benchmark response (BMR). For a toxicological test, it is often of interest to determine the concentration of test compound at which a pre-defined BMR of e.g. 10, 25 or 50% is reached. The concentration at which the modelled curve crosses the BMR is called the benchmark concentration (BMC). We present a user-friendly, web-based tool (BMCeasy), designed for operators without programming skills and profound statistical background, to determine BMCs and their confidence intervals. BMCeasy allows simultaneous analysis of viability plus a functional test endpoint, and it yields absolute BMCs with confidence intervals for any BMR. Besides an explanation of the algorithm underlying BMCeasy, this article also gives multiple examples of data outputs. BMCeasy was used within the EU-ToxRisk project for preparing data packages that were submitted to regulatory authorities, demonstrating the real-life applicability of the tool.
Overview
The claims and statistics of this paper haven’t been checked yet.
Run the check — free, no account needed. It reads the open-access text and checks the sources it cites.
Integrity signals
Registry
Cites
Statistics
Figures

Verification
Claims the paper makes
The claims and statistics of this paper haven’t been checked yet.
Run the check — free, no account needed. It reads the open-access text and checks the sources it cites.
Claims other papers make about this one
Each is checked against this paper’s own text: does it say what the citing paper says it does?
The cited source says what the claim attributes to it.
In the citing paper
“Where sufficiently resolved concentration-response data are available, benchmark concentration approaches can provide an additional quantitative basis for defining cytotoxicity-related decision points and their uncertainty (Krebs, 2019).”
From Cytotoxicity across OECD methods is not a single endpoint: context-dependent roles, variability and implications for decision-making (2026) · cites this paper as Krebs, 2019
Self-check
Percentages, sums and reported differences re-computed from the paper’s own numbers.
The self-check needs the paper’s full text.
Citations
Cites
R: A Language and Environment for Statistical Computing
R Core Team (2025) · doi:10.32614/r.manuals · Cited by 352,181
Ritz, C., & Streibig, J. C. (2005) · Journal of Statistical Software · doi:10.18637/jss.v012.i05 · Cited by 1,456
A new method for determining allowable daily intakes*1
Crump, K. S. (1984) · Fundamental and Applied Toxicology · doi:10.1016/0272-0590(84)90107-6 · Cited by 930
Reference dose (RfD): Description and use in health risk assessments
Barnes, D. G., Dourson, M. L., Dourson, M. L., Preuss, P. W., Barnes, D. G., Bellin, J. S., DeRosa, C. T., Engler, R., Erdreich, L. S., Färber, T. M., et al. (1988) · Regulatory Toxicology and Pharmacology · doi:10.1016/0273-2300(88)90047-5 · Cited by 810
Toward a unified approach to dose–response modeling in ecotoxicology
Ritz, C. (2010) · Environmental Toxicology and Chemistry · doi:10.1002/etc.7 · Cited by 329
Introduction to benchmark dose methods and U.S. EPA's benchmark dose software (BMDS) version 2.1.1
Davis, J. A., Gift, J. S., & Zhao, Q. J. (2010) · Toxicology and Applied Pharmacology · doi:10.1016/j.taap.2010.10.016 · Cited by 272
Benchmark dose (BMD) modeling: current practice, issues, and challenges
Haber, L. T., Dourson, M. L., Allen, B. C., et al. (2018) · Critical Reviews in Toxicology · doi:10.1080/10408444.2018.1430121 · Cited by 229
Krug, A. K., Kolde, R., Gaspar, J. A., Rempel, E., Balmer, N. V., Meganathan, K., Vojnits, K., Baquié, M., Waldmann, T., Enseñat‐Waser, R., et al. (2012) · Archives of Toxicology · doi:10.1007/s00204-012-0967-3 · Cited by 228
tcpl: the ToxCast pipeline for high‐throughput screening data
Filer, D., Kothiya, P., Setzer, W. R., Judson, R., & Martin, M. T. (2016) · Bioinform. · doi:10.1093/bioinformatics/btw680 · Cited by 221
Behl, M., Hsieh, J., Shafer, T. J., Mundy, W. R., Rice, J. R., Boyd, W. A., Freedman, J. H., Hunter, E. S., Jarema, K. A., Padilla, S., et al. (2015) · Neurotoxicology and Teratology · doi:10.1016/j.ntt.2015.09.003 · Cited by 218
Cited by
Blum, J., Masjosthusmann, S., Bartmann, K., Bendt, F., Dolde, X., Dönmez, A., Förster, N., Holzer, A.-K., Hübenthal, U., Keßel, H. E., et al. (2023) · Chemosphere · doi:10.1016/j.chemosphere.2022.137035 · Cited by 105
Thoma, T., Löhr, L., Demuth, P., Hambruch, N., Oesch, F., & Landsiedel, R. (2026) · NAM Journal · doi:10.1016/j.namjnl.2026.100126
Metadata
- Authors
- Krebs, A.
- Venue
- ALTEX
- Publisher
- ALTEX Edition
- Published
- 2019
- ISSN
- 1868-596X
- Cited by
- 13
- References
- 33
About these checks
Registry, retraction, Cites and statistics results are computed, not judged, with one exception: a printed reference that no index lists is read once by a model before it counts as a citation error. Claims are extracted by a model and kept only when their quote appears verbatim in the text; each cited source is then checked, with a model’s help, for whether it says what the claim relies on. Those verdicts can be wrong — read the claim’s quote and the cited source before relying on one.
Statistics and arithmetic are recomputed, not judged.
Confidence bands are shown only for fields calibrated on our annotated test set. None is calibrated yet, so no band is shown.
What counts as a claim ›How we measure confidence ›How we check this ›
Are you an author, or do you see a problem with this page? Request a review
Data sources
Bibliographic data: Semantic Scholar, OpenAlex, Crossref.
Contains information from the Semantic Scholar Academic Graph Datasets, made available under the ODC Attribution License (ODC-BY 1.0).
Semantic Scholar’s data is described in: Kinney, R., et al. (2023). The Semantic Scholar Open Data Platform. arXiv:2301.10140.
