Cited by 117Neuroscience and Neuropharmacology ResearchVisual perception and processing mechanismsNeurogenesis and neuroplasticity mechanisms

The DOI matches its Crossref record; 98 of the 98 references it cites were found in a registry or an index.

Comparison of Plasticity In Vivo and In Vitro in the Developing Visual Cortex of Normal and Protein Kinase A RIβ-Deficient Mice

Open access

Abstract

Developing sensory systems are sculpted by an activity-dependent strengthening and weakening of connections. Long-term potentiation (LTP) and depression (LTD)in vitro have been proposed to model this experience-dependent circuit refinement. We directly compared LTP and LTD induction in vitro with plasticity in vivo in the developing visual cortex of a mouse mutant of protein kinase A (PKA), a key enzyme implicated in the plasticity of a diverse array of systems. In mice lacking the RIβ regulatory subunit of PKA, we observed three abnormalities of synaptic plasticity in layer II/III of visual cortex in vitro. These included an absence of (1) extracellularly recorded LTP, (2) depotentiation or LTD, and (3) paired-pulse facilitation. Potentiation was induced, however, by pairing low-frequency stimulation with direct depolarization of individual mutant pyramidal cells. Together these findings suggest that the LTP defect in slices lacking PKA RIβ lies in the transmission of sufficient net excitation through the cortical circuit. Nonetheless, functional development and plasticity of visual cortical responses in vivo after monocular deprivation did not differ from normal. Moreover, the loss of all responsiveness to stimulation of the originally deprived eye in most cortical cells could be restored by reverse suture of eyelids during the critical period in both wild-type and mutant mice. Such an activity-dependent increase in response would seem to require a mechanism like potentiation in vivo. Thus, the RIβ isoform of PKA is not essential for ocular dominance plasticity, which can proceed despite defects in several common in vitro models of neural plasticity.

Overview

The claims and statistics of this paper haven’t been checked yet.

Run the check — free, no account needed. It reads the open-access text and checks the sources it cites.

A few free checks a day · papers already verified open instantly · results are public

Integrity signals

Registry

Crossref · 10.1523/jneurosci.18-06-02108.1998

Cites

98 of 98 references verified0 citation errors · 0 not checkable

Statistics

Figures

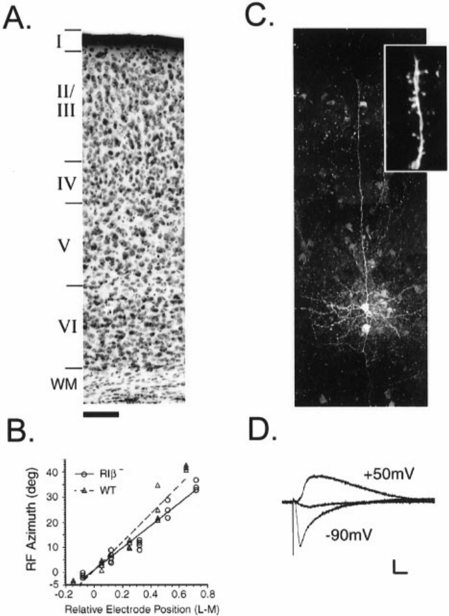
Figure 1 Characteristic morphology and synaptic responses in the visual cortex of PKA RI b 2 mutant mice. A , Six distinct laminae are identifiable in Nissl-stained coronal sections through the binocular zone of primary visual cortex taken from animals at the peak of the critical period. Scale bar, 100 m m. B , Visual responses are retinotopically organized in RI b 2 cortex. A series of evenly spaced microelectrode penetrations were made across a portion of the lateromedial extent of V1 in each animal. Receptive field ( RF )-center azimuths are plotted versus electrode position relative to the vertical meridian ( n 5 3-7 cortical cell RFs per penetration). The correlation coefficients for three RI b 2 and four WT regressions were 0.92 6 0.04 and 0.91 6 0.03, respectively. C , Neurons filled with biocytin in the supragranular layers exhibit pyramidal morphology with a long apical dendrite extending to the pial surface and profuse basal processes. Numerous postsynaptic spines are readily visible ( inset ). Scale bar (shown in A ): 45 m m; inset, 6 m m. D , Synaptic responses to underlying layer IV stimulation consist of fast non-NMDA-R and slower NMDA-Rmediated components in supragranular pyramidal cells. Whole-cell voltage-clamp recordings were first made at 2 90mV, and then fast nonNMDA and GABAA receptors were blocked using CNQX and bicuculline methiodide (10 m M each) to reveal slow NMDA-R currents when membrane potential was set to 1 50 mV. Finally, NMDA-Rs were blocked by 50 m M D-APV at 1 50 mV ( middle trace ). Calibration: 50 pA, 10 msec.
Figure 1 Characteristic morphology and synaptic responses in the visual cortex of PKA RI b 2 mutant mice. A , Six distinct laminae are identifiable in Nissl-stained coronal sections through the binocular zone of primary visual cortex taken from animals at the peak of the critical period. Scale bar, 100 m m. B , Visual responses are retinotopically organized in RI b 2 cortex. A series of evenly spaced microelectrode penetrations were made across a portion of the lateromedial extent of V1 in each animal. Receptive field ( RF )-center azimuths are plotted versus electrode position relative to the vertical meridian ( n 5 3-7 cortical cell RFs per penetration). The correlation coefficients for three RI b 2 and four WT regressions were 0.92 6 0.04 and 0.91 6 0.03, respectively. C , Neurons filled with biocytin in the supragranular layers exhibit pyramidal morphology with a long apical dendrite extending to the pial surface and profuse basal processes. Numerous postsynaptic spines are readily visible ( inset ). Scale bar (shown in A ): 45 m m; inset, 6 m m. D , Synaptic responses to underlying layer IV stimulation consist of fast non-NMDA-R and slower NMDA-Rmediated components in supragranular pyramidal cells. Whole-cell voltage-clamp recordings were first made at 2 90mV, and then fast nonNMDA and GABAA receptors were blocked using CNQX and bicuculline methiodide (10 m M each) to reveal slow NMDA-R currents when membrane potential was set to 1 50 mV. Finally, NMDA-Rs were blocked by 50 m M D-APV at 1 50 mV ( middle trace ). Calibration: 50 pA, 10 msec.CC-BY-NC-SA · From the PDF
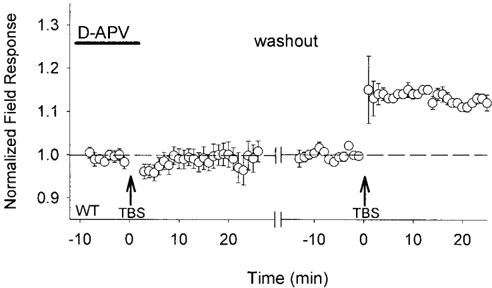
Figure 2 TBS-induced LTP of extracellular field responses via NMDA-R activation in mouse visual cortex. Theta-burst stimulation ( TBS ) to layer IV in the binocular zone of wild-type mouse visual cortex ( left arrow ) fails to potentiate supragranular field responses in the presence of D-APV (50-100 m M). The ability to generate LTP by TBS along this pathway ( right arrow ) is restored after washing out (40-60 min) the NMDA-Rantagonist from the slice ( n 5 6 slices from 5 mice). Responses are normalized to the baseline period just before each TBS, and grouped data are shown as the average of all slices ( 6 SEM), with one trial per slice.
Figure 2 TBS-induced LTP of extracellular field responses via NMDA-R activation in mouse visual cortex. Theta-burst stimulation ( TBS ) to layer IV in the binocular zone of wild-type mouse visual cortex ( left arrow ) fails to potentiate supragranular field responses in the presence of D-APV (50-100 m M). The ability to generate LTP by TBS along this pathway ( right arrow ) is restored after washing out (40-60 min) the NMDA-Rantagonist from the slice ( n 5 6 slices from 5 mice). Responses are normalized to the baseline period just before each TBS, and grouped data are shown as the average of all slices ( 6 SEM), with one trial per slice.CC-BY-NC-SA · From the PDF
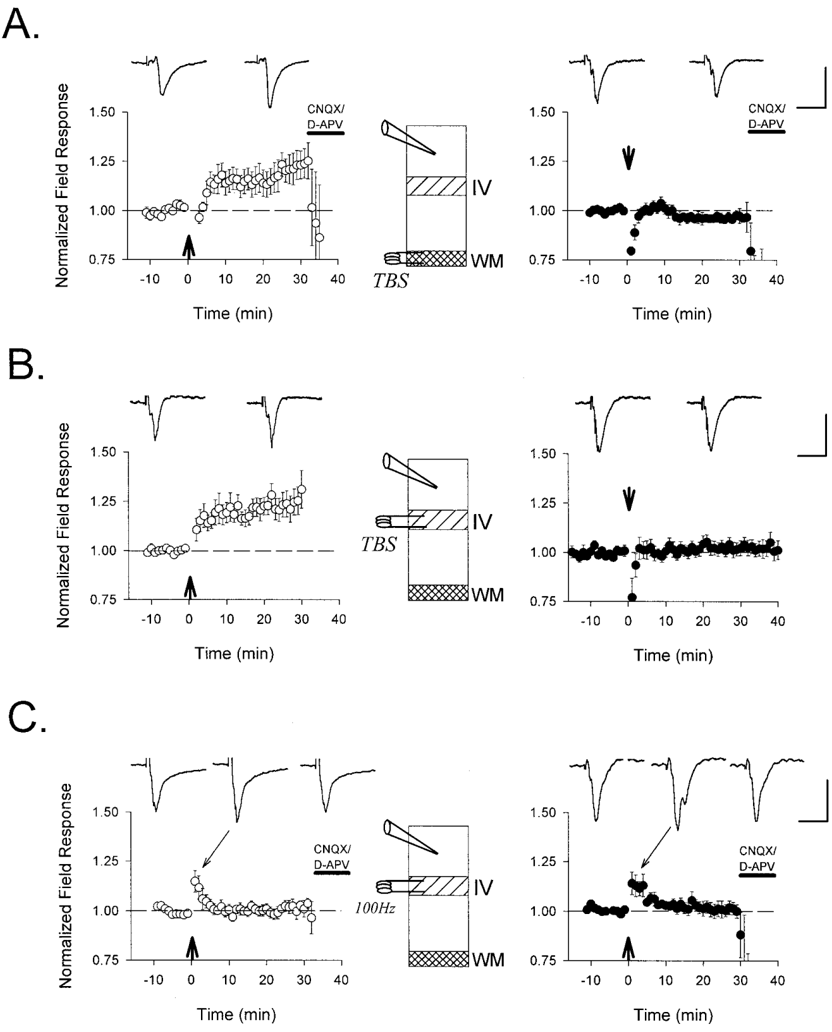
Figure 3 Defective LTP of extracellular field responses in the visual cortex of PKA RI b 2 mice. TBS ( arrow ) applied ( A ) to the white matter ( n 5 6 and 5 slices from 4 and 3 mice, WT and RI b 2 , respectively) or ( B ) directly to layer IV ( n 5 8 and 11 from 7 and 6 mice, WT and RI b 2 , respectively) potentiates supragranular field response amplitudes in WT ( E ) but not RI b 2 ( F ) mice recorded blind to genotype. C , More powerful tetani (four 1 sec bursts of 100 Hz; arrow ) fail to induce LTP in both WT and mutant slices ( n 5 5 slices from 3 mice each). Representative traces 5 min before and 25 min after conditioning stimuli are shown above each graph. Sample traces during post-tetanic potentiation are also indicated in C . Except for the experiments in B , which were continued to examine depotentiation (compare Fig. 6 A ), glutamate receptor antagonists CNQX (10 m M) and D-APV (50 m M) were routinely bath-applied to determine the synaptic nature of the field response. Calibration: 0.3 mV, 20 msec for each.
Figure 3 Defective LTP of extracellular field responses in the visual cortex of PKA RI b 2 mice. TBS ( arrow ) applied ( A ) to the white matter ( n 5 6 and 5 slices from 4 and 3 mice, WT and RI b 2 , respectively) or ( B ) directly to layer IV ( n 5 8 and 11 from 7 and 6 mice, WT and RI b 2 , respectively) potentiates supragranular field response amplitudes in WT ( E ) but not RI b 2 ( F ) mice recorded blind to genotype. C , More powerful tetani (four 1 sec bursts of 100 Hz; arrow ) fail to induce LTP in both WT and mutant slices ( n 5 5 slices from 3 mice each). Representative traces 5 min before and 25 min after conditioning stimuli are shown above each graph. Sample traces during post-tetanic potentiation are also indicated in C . Except for the experiments in B , which were continued to examine depotentiation (compare Fig. 6 A ), glutamate receptor antagonists CNQX (10 m M) and D-APV (50 m M) were routinely bath-applied to determine the synaptic nature of the field response. Calibration: 0.3 mV, 20 msec for each.CC-BY-NC-SA · From the PDF
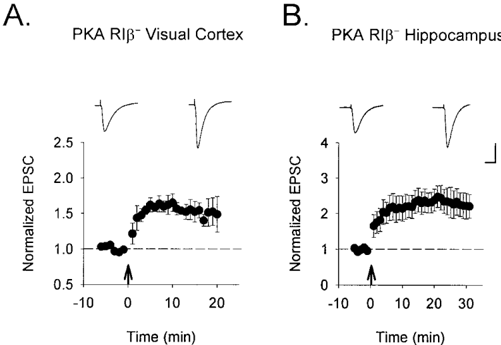
Figure 4 Preservation of postsynaptic LTP mechanisms in PKA RI b 2 mice. A , Direct postsynaptic depolarization of supragranular pyramidal cells (from 2 70 to 0 mV) induces LTP in mutant visual cortex when paired with synaptic stimulation (100 pulses at 1 Hz to layer IV). B , Robust LTP is similarly induced by pairing at Schaeffer collateral synapses studied as a control within the same slice. Nine cells from each region were recorded in slices from a total of seven mice. Sample traces 5 min before and 20 min after pairing are shown above each graph. Calibration: 100 pA, 20 msec.
Figure 4 Preservation of postsynaptic LTP mechanisms in PKA RI b 2 mice. A , Direct postsynaptic depolarization of supragranular pyramidal cells (from 2 70 to 0 mV) induces LTP in mutant visual cortex when paired with synaptic stimulation (100 pulses at 1 Hz to layer IV). B , Robust LTP is similarly induced by pairing at Schaeffer collateral synapses studied as a control within the same slice. Nine cells from each region were recorded in slices from a total of seven mice. Sample traces 5 min before and 20 min after pairing are shown above each graph. Calibration: 100 pA, 20 msec.CC-BY-NC-SA · From the PDF
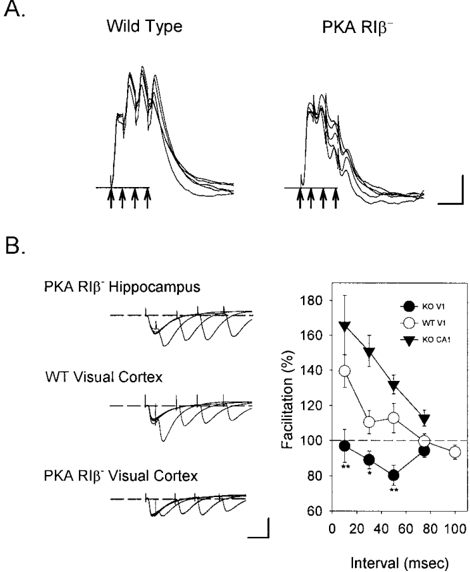
Figure 5 Disrupted net depolarization and paired-pulse facilitation in the visual cortex of PKA RI b 2 mice. A , Whereas TBS produces a prolonged depolarization in wild-type pyramidal cells, a decrementing response is observed in the knockout cells ( n 5 10 of 10 cells). Whole-cell current-clamp responses to the first bursts in five episodes of TBS to layer IV are shown superimposed. Arrows indicate the four stimulus pulses delivered at 10 msec intervals. Calibration: 5 mV, 20 msec. B , Pairedpulse facilitation (PPF) is perturbed in RI b 2 visual cortex but not in the hippocampus. Pairs of stimuli to layer IV elicit a prominent PPF only at 10 msec interpulse intervals in WT supragranular pyramidal cells voltageclamped to 2 70 mV. In contrast, mutant V1 exhibits no PPF along this pathway, whereas it is pronounced at all intervals tested in RI b 2 CA1 ( n 5 8 cells each; ** p , 0.01, * p , 0.05; t test WT vs RI b 2 cortex). Calibration: 40 pA, 20 msec.
Figure 5 Disrupted net depolarization and paired-pulse facilitation in the visual cortex of PKA RI b 2 mice. A , Whereas TBS produces a prolonged depolarization in wild-type pyramidal cells, a decrementing response is observed in the knockout cells ( n 5 10 of 10 cells). Whole-cell current-clamp responses to the first bursts in five episodes of TBS to layer IV are shown superimposed. Arrows indicate the four stimulus pulses delivered at 10 msec intervals. Calibration: 5 mV, 20 msec. B , Pairedpulse facilitation (PPF) is perturbed in RI b 2 visual cortex but not in the hippocampus. Pairs of stimuli to layer IV elicit a prominent PPF only at 10 msec interpulse intervals in WT supragranular pyramidal cells voltageclamped to 2 70 mV. In contrast, mutant V1 exhibits no PPF along this pathway, whereas it is pronounced at all intervals tested in RI b 2 CA1 ( n 5 8 cells each; ** p , 0.01, * p , 0.05; t test WT vs RI b 2 cortex). Calibration: 40 pA, 20 msec.CC-BY-NC-SA · From the PDF
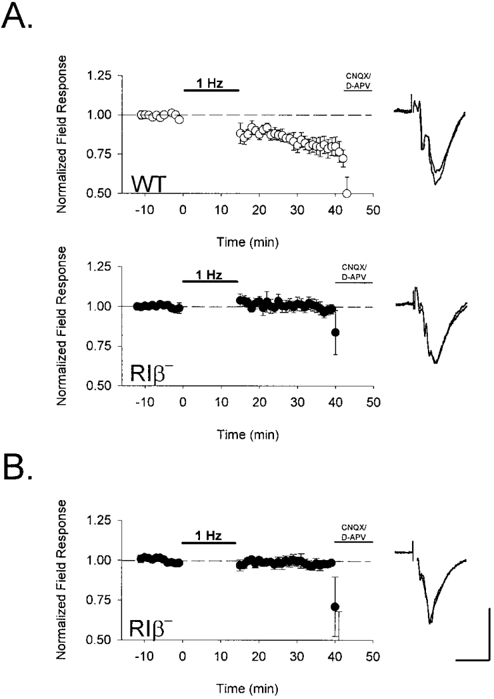
Figure 6 Absence of synaptic depression after low-frequency stimulation in PKA RI b 2 mice. Extracellular field potential amplitude was monitored in layer II/III after low-frequency stimulation (900 pulses at 1 Hz) to layer IV of visual cortex ( F , RI b 2 ; E , WT). A , Renormalized responses after an earlier TBS (compare Fig. 3 B ) were depotentiated in wild-type ( n 5 8 slices from 7 mice) but unchanged in RI b 2 mice ( n 5 11 slices from 6 animals). B , Low-frequency stimulation was similarly ineffective at naı ¨ve RI b 2 synapses ( n 5 5 slices from 3 mice). Bath application of CNQX (10 m M) and D-APV (50 m M) terminated each experiment to confirm the synaptic nature of the field response. Representative traces 5 min before and 20 min after LFS are shown superimposed to the right of each graph. Calibration: 0.3 mV, 10 msec.
Figure 6 Absence of synaptic depression after low-frequency stimulation in PKA RI b 2 mice. Extracellular field potential amplitude was monitored in layer II/III after low-frequency stimulation (900 pulses at 1 Hz) to layer IV of visual cortex ( F , RI b 2 ; E , WT). A , Renormalized responses after an earlier TBS (compare Fig. 3 B ) were depotentiated in wild-type ( n 5 8 slices from 7 mice) but unchanged in RI b 2 mice ( n 5 11 slices from 6 animals). B , Low-frequency stimulation was similarly ineffective at naı ¨ve RI b 2 synapses ( n 5 5 slices from 3 mice). Bath application of CNQX (10 m M) and D-APV (50 m M) terminated each experiment to confirm the synaptic nature of the field response. Representative traces 5 min before and 20 min after LFS are shown superimposed to the right of each graph. Calibration: 0.3 mV, 10 msec.CC-BY-NC-SA · From the PDF
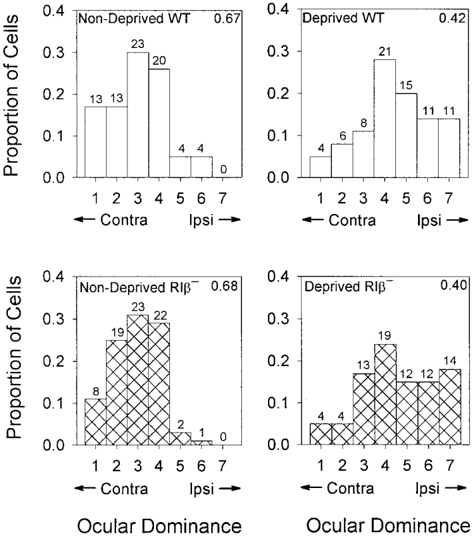
Figure 7 Loss of deprived-eye responses after monocular deprivation in PKA RI b 2 mice. Ocular dominance distributions were recorded blind to genotype from the binocular zone of two nondeprived adults each ( left panels ) of wild-type ( hollow bars ; n 5 77 cells) and RI b 2 mice ( hatched bars ; n 5 75 cells). Both distributions shifted significantly and similarly ( right panels ) in response to monocular deprivation of the contralateral eye for 4 d beginning at P25-27 ( n 5 76 and 78 cells from 3 mice each, WT and RI b 2 , respectively). Numbers of cells are indicated above each bar, and contralateral bias indices are shown in the top right-hand corner of each graph.
Figure 7 Loss of deprived-eye responses after monocular deprivation in PKA RI b 2 mice. Ocular dominance distributions were recorded blind to genotype from the binocular zone of two nondeprived adults each ( left panels ) of wild-type ( hollow bars ; n 5 77 cells) and RI b 2 mice ( hatched bars ; n 5 75 cells). Both distributions shifted significantly and similarly ( right panels ) in response to monocular deprivation of the contralateral eye for 4 d beginning at P25-27 ( n 5 76 and 78 cells from 3 mice each, WT and RI b 2 , respectively). Numbers of cells are indicated above each bar, and contralateral bias indices are shown in the top right-hand corner of each graph.CC-BY-NC-SA · From the PDF
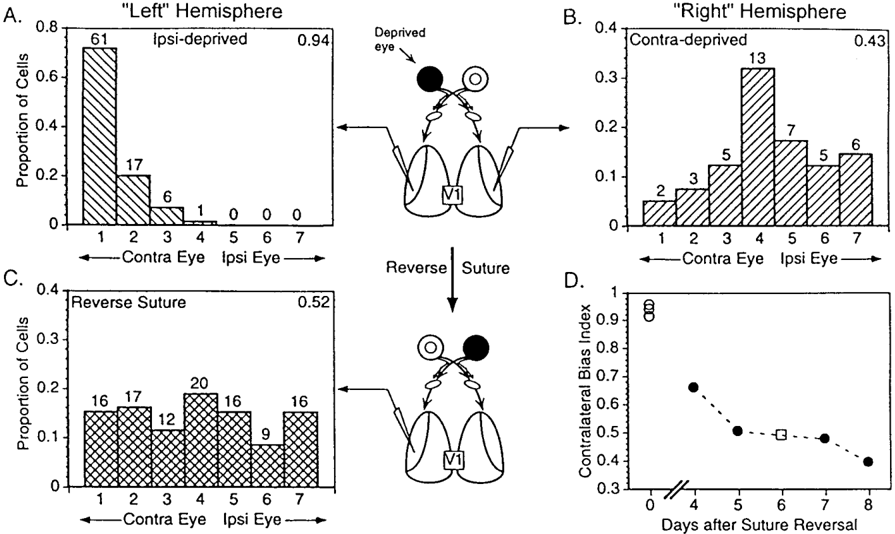
Figure 8 Potentiation of initially deprived eye responses by reverse suture in PKA RI b 2 mice. A , Ocular dominance distribution of cells recorded ipsilateral to an eye deprived of vision for 5 d beginning at P20-22 ( 'Left' Hemisphere ). A nearly complete dominance of the RI b 2 cortex by the contralateral eye occurs because of the innate bias toward contralateral eye dominance in nondeprived animals ( n 5 85 cells in 3 hemispheres). Numbers of cells are indicated above each bar, and contralateral bias indices are shown in the top right-hand corner of each graph. B , The shift in ocular dominance is typically less dramatic in the opposite 'Right' Hemisphere ( n 5 41 cells in 3 mice) (see also Fig. 7, or Gordon and Stryker, 1996). C , Ocular dominance distribution of cells in RI b 2 visual cortex recorded ipsilateral to the initially deprived eye ( 'Left' Hemisphere ) reveals a strengthening of previously lost inputs after suture reversal for an additional 4-8 d (P26-34; n 5 106 cells from 4 mice). D , Individually calculated CBIs of ipsilaterally deprived ( E , same animals as in A ) and reverse-sutured animals ( F , same animals as in C ) demonstrate the gradual recovery of response, similar to WT ( M ) with increasing duration of suture reversal.
Figure 8 Potentiation of initially deprived eye responses by reverse suture in PKA RI b 2 mice. A , Ocular dominance distribution of cells recorded ipsilateral to an eye deprived of vision for 5 d beginning at P20-22 ( 'Left' Hemisphere ). A nearly complete dominance of the RI b 2 cortex by the contralateral eye occurs because of the innate bias toward contralateral eye dominance in nondeprived animals ( n 5 85 cells in 3 hemispheres). Numbers of cells are indicated above each bar, and contralateral bias indices are shown in the top right-hand corner of each graph. B , The shift in ocular dominance is typically less dramatic in the opposite 'Right' Hemisphere ( n 5 41 cells in 3 mice) (see also Fig. 7, or Gordon and Stryker, 1996). C , Ocular dominance distribution of cells in RI b 2 visual cortex recorded ipsilateral to the initially deprived eye ( 'Left' Hemisphere ) reveals a strengthening of previously lost inputs after suture reversal for an additional 4-8 d (P26-34; n 5 106 cells from 4 mice). D , Individually calculated CBIs of ipsilaterally deprived ( E , same animals as in A ) and reverse-sutured animals ( F , same animals as in C ) demonstrate the gradual recovery of response, similar to WT ( M ) with increasing duration of suture reversal.CC-BY-NC-SA · From the PDF

Verification

Claims the paper makes

The claims and statistics of this paper haven’t been checked yet.

Run the check — free, no account needed. It reads the open-access text and checks the sources it cites.

A few free checks a day · papers already verified open instantly · results are public

Claims other papers make about this one

Each is checked against this paper’s own text: does it say what the citing paper says it does?

Self-check

Percentages, sums and reported differences re-computed from the paper’s own numbers.

The self-check needs the paper’s full text.

Citations

Cites

Show all 98 references

Cited by

Sorted by citations

See all 117

Metadata

Authors
Hensch, T. K., Gordon, J. A., Brandon, E. P., McKnight, G. S., Idzerda, R. L., & Stryker, M. P.
Affiliations
  • University of California, San Francisco (US)
  • University of Washington (US)
Venue
The Journal of Neuroscience
Published
1998-03-15
Volume
18
Issue
6
Pages
2108-2117
ISSN
  • 0270-6474 (ISSN-L)
  • 1529-2401
OpenAlex
W2171569315
Cited by
117
References
98
Citations by year
2026: 1 · 2025: 1 · 2024: 1 · 2023: 1 · 2021: 1 · 2020: 2 · 2018: 1 · 2017: 3 · 2016: 2 · 2015: 1 · 2014: 2 · 2013: 2 · 2012: 3
FWCI
3.83
Type
journal article
Language
en
Open access
Locations
  • Journal of Neuroscience (publishedVersion, cc-by-nc-sa)
  • PubMed Central (publishedVersion)
  • PubMed (publishedVersion)
Funders
  • National Institutes of Health (EY02874)
  • National Eye Institute (R01EY002874, EY-02874, R37EY002874)
  • National Institute of General Medical Sciences (GM32875, R01GM032875)
Topics
  • Life Sciences › Neuroscience › Cellular and Molecular Neuroscience › Neuroscience and Neuropharmacology Research
  • Life Sciences › Neuroscience › Cognitive Neuroscience › Visual perception and processing mechanisms
  • Life Sciences › Neuroscience › Developmental Neuroscience › Neurogenesis and neuroplasticity mechanisms
Keywords
visual cortex development, synaptic plasticity, long-term potentiation, long-term depression, depotentiation, paired-pulse facilitation, monocular deprivation, ocular dominance, critical period, pyramidal neurons, layer 2/3
MeSH terms
Action Potentials, Aging, Animals, Extracellular Space, Functional Laterality, Neuronal Plasticity, Ocular Physiological Phenomena, Reference Values, Sensory Deprivation, Synapses, Visual Cortex, Vision, Monocular, Long-Term Potentiation, Cyclic AMP-Dependent Protein Kinases, Patch-Clamp Techniques, Mice, Cyclic AMP-Dependent Protein Kinase RIbeta Subunit

About these checks

Registry, retraction, Cites and statistics results are computed, not judged, with one exception: a printed reference that no index lists is read once by a model before it counts as a citation error. Claims are extracted by a model and kept only when their quote appears verbatim in the text; each cited source is then checked, with a model’s help, for whether it says what the claim relies on. Those verdicts can be wrong — read the claim’s quote and the cited source before relying on one.

Statistics and arithmetic are recomputed, not judged.

Confidence bands are shown only for fields calibrated on our annotated test set. None is calibrated yet, so no band is shown.

What counts as a claim ›How we measure confidence ›How we check this ›

Are you an author, or do you see a problem with this page? Request a review