

The DOI matches its Crossref record; 33 of the 33 references it cites were found in a registry or an index; none of the 35 sources its claims cite is checked for support yet.
GIS-Based Evaluation of Pollution Sources and Water Quality Status in the Turag River, Bangladesh
Open accessAbstract
This study evaluates pollution sources and water quality status in the Turag River, Bangladesh, using Geographic Information System (GIS) techniques and Water Quality Index (WQI) assessment. The Turag River, classified as environmentally critical since 2009, faces severe degradation due to untreated industrial effluents from pharmaceutical facilities, textile mills, and manufacturing units located along its banks. Water samples were collected from nine strategic locations and analyzed for eight physicochemical parameters (pH, dissolved oxygen, biochemical oxygen demand, total suspended solids, turbidity, phosphate, nitrate, and temperature) using standard protocols. GIS-based spatial mapping revealed significant spatial heterogeneity in pollution levels, with BOD values (53-90 ppm, mean 73 ppm) and turbidity levels (40-80 NTU, mean 58.77 NTU) exceeding Department of Environment standards at all sampling sites. The calculated WQI values ranged from 35.14 to 38.83 (average 36.68), placing the river water quality consistently in the "Bad" category across all sampling locations. The northern section exhibited critical conditions for dissolved oxygen (3.4-3.5 ppm) and turbidity (75-80 NTU), while the southern segment showed elevated levels of BOD, phosphate, and nitrate. The consistently poor water quality classification indicates severe degradation, limiting usability to agricultural irrigation purposes only. These findings provide a foundation for developing targeted pollution control strategies and highlight the urgent need for comprehensive watershed management to restore this vital water resource.
Overview
AI snapshot
Written from the paper’s full text.
TL;DR
This study used GIS mapping and a Water Quality Index (WQI) to assess pollution sources and water quality at nine sites along the Turag River, Bangladesh, in May 2024. All sites fell in the “Bad” WQI category, with severe organic and turbidity pollution linked to industrial discharges.
Key findings
- WQI values ranged from 35.14 to 38.83 (average 36.68), placing all nine sampling sites in the “Bad” category (WQI 25–49), with usability limited to agricultural irrigation only.
- BOD ranged from 53 to 90 ppm (mean 73 ppm) and turbidity from 40 to 80 NTU (mean 58.77 NTU), exceeding DoE standards of ≤50 ppm and ≤10 NTU at all sites.
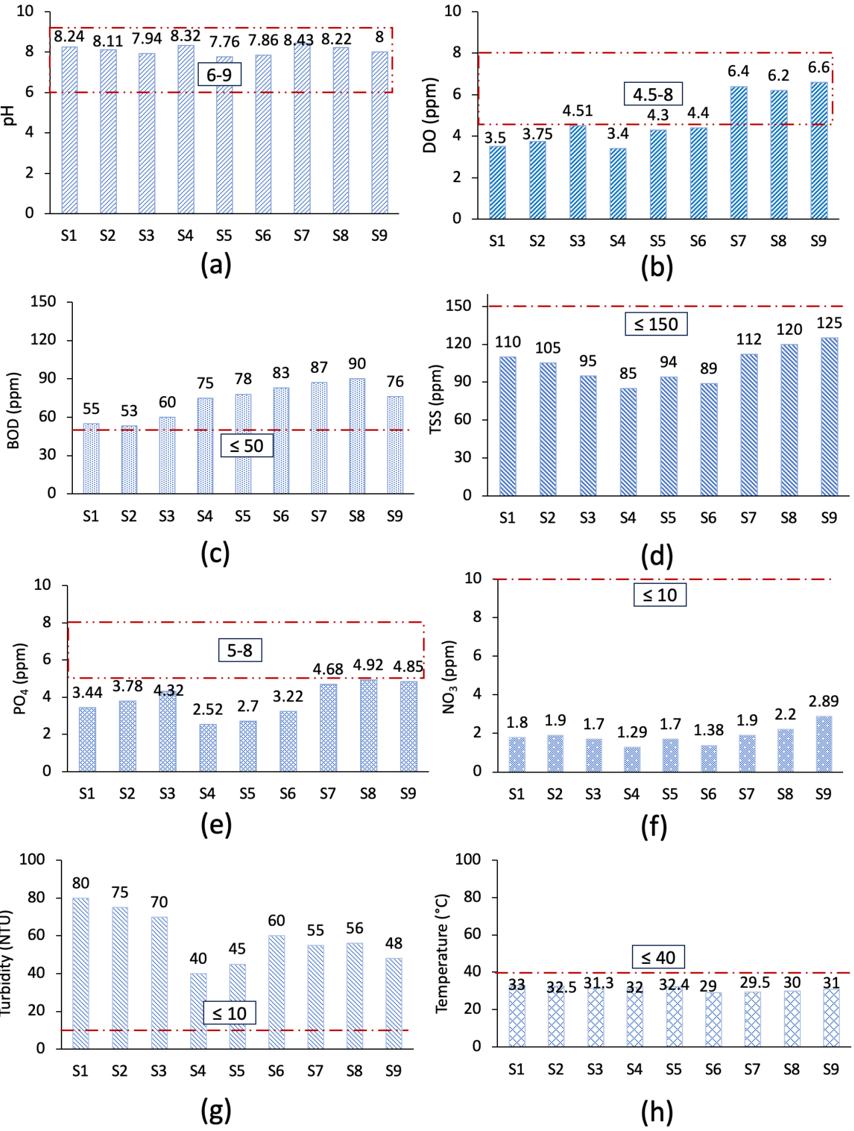
- DO ranged from 3.4 to 6.6 ppm (mean 4.78 ppm); the northern section had critical DO at S1 and S4 (3.5 and 3.4 ppm) and high turbidity (75–80 NTU), while the southern segment had elevated BOD (87–90 ppm), phosphate (4.85–4.92 ppm), and nitrate (2.2–2.89 ppm).
- TSS ranged from 85 to 125 ppm (mean 103.88 ppm), phosphate from 2.52 to 4.92 ppm (mean 3.82 ppm), nitrate from 1.29 to 2.89 ppm (mean 1.86 ppm), pH from 7.76 to 8.43 (mean 8.09), and temperature from 29°C to 33°C (mean 31.18°C).
Methods
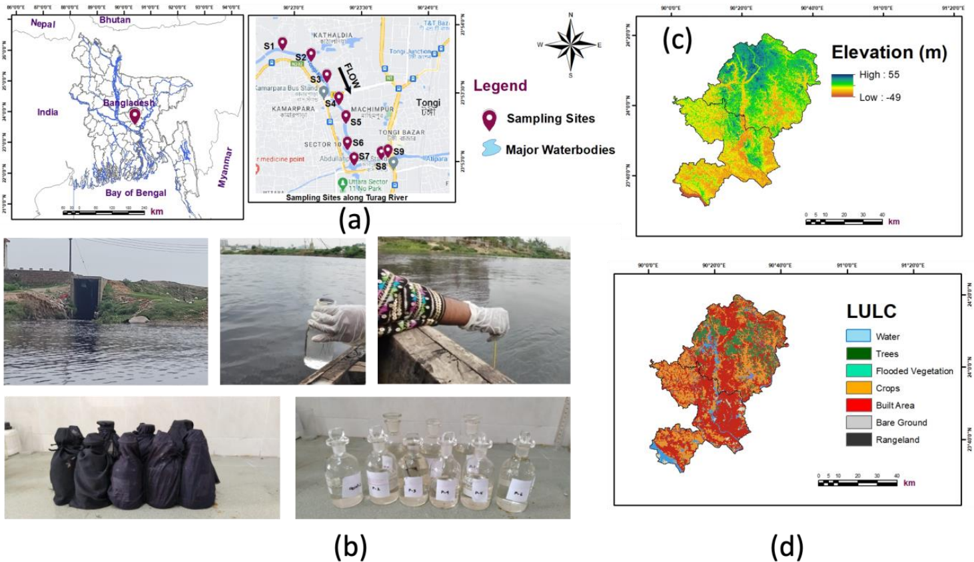
- Water samples were collected on May 22, 2024, from nine strategic locations along the Turag River near industrial discharge points, during the pre-monsoon season, from mid-stream at 8–10 inches depth using 250 ml and 500 ml plastic bottles and separate BOD bottles.
- Eight physicochemical parameters were analyzed: pH, DO, BOD, TSS, turbidity, phosphate, nitrate, and temperature, using a LUTRON YK-2005WA meter, HACH DR/870 Colorimeter, HACH DR 1900 Spectrophotometer, and calibrated mercury thermometer.
- WQI was calculated using the NSFWQI framework with parameter weights, and ArcGIS 10.5 with inverse distance weighted (IDW) interpolation was used to generate spatial maps at 10 m × 10 m resolution.
Limitations
- The paper states that sampling was conducted during a single season (pre-monsoon), limiting temporal representativeness; seasonal variations such as monsoonal dilution and dry-season concentration effects were not assessed.
- The paper states that the NSFWQI uses a predetermined set of parameters with fixed weighting factors that may not fully capture Turag River pollution dynamics, and that biological indicators such as fecal coliform were excluded.
- The paper states that GPP and NPP estimation was not feasible due to absent chlorophyll-a or light-use efficiency data; the text also makes evident that fecal coliform is listed among NSFWQI parameters but was not included in the eight measured parameters.
Model-written summary. Check it against the paper before relying on it.
Integrity signals
Registry
Cites
Statistics
Figures

Verification
Claims the paper makes
46 Own result · 22 Sources not found · 18 Own interpretation · 7 Own method · 4 No basis given · 1 Not checked yet
A result the paper reports from its own data — it cites no other source for it, so there is none to check. The quote shows it is in the paper.
In the paper
“In addition, the water temperature measurements across sampling sites ranged from 29°C to 33°C with an average value of 31.18°C(SD = 1.42).”
- Also stated in: § 4. Conclusion · plain
“Notably, TSS concentrations ranged from 85 to 125 ppm (average 103.88 ppm), phosphate content varied from 2.52 to 4.92 ppm (mean 3.82 ppm), and nitrate levels ranged from 1.29 to 2.89 ppm (average 1.86 ppm), with temperature measurements between 29°C and 33°C (average 31.18°C).”
§ GIS-Based Evaluation of Pollution Sources and Water Quality Status in the Turag River, Bangladesh > 3.1. Spatial Mapping of Physicochemical Attributes in the Turag River Water
plain- Asserted: passes — The authors put it forward as true.
- Checkable: passes — It can be checked against evidence.
- Load-bearing: unclear — It is unclear whether the paper’s conclusions depend on it.
- Based: passes — The paper gives a reason why it holds.
- Rests on an assumption: The nine sampling sites adequately represent water quality along the studied section of the Turag River.
- Also stated in: § 4. Conclusion · plain
A result the paper reports from its own data — it cites no other source for it, so there is none to check. The quote shows it is in the paper.
In the paper
“Notably, TSS concentrations ranged from 85 to 125 ppm (average 103.88 ppm), phosphate content varied from 2.52 to 4.92 ppm (mean 3.82 ppm), and nitrate levels ranged from 1.29 to 2.89 ppm (average 1.86 ppm), with temperature measurements between 29°C and 33°C (average 31.18°C).”
§ GIS-Based Evaluation of Pollution Sources and Water Quality Status in the Turag River, Bangladesh > 4. Conclusion
plain- Asserted: passes — The authors put it forward as true.
- Checkable: passes — It can be checked against evidence.
- Load-bearing: passes — The paper’s conclusions depend on it.
- Based: passes — The paper gives a reason why it holds.
- Rests on an assumption: The nine sampling sites adequately represent water quality along the studied section of the Turag River.
A result the paper reports from its own data — it cites no other source for it, so there is none to check. The quote shows it is in the paper.
In the paper
“All temperature readings remained below the DoE standard upper limit of 40°C.”
§ GIS-Based Evaluation of Pollution Sources and Water Quality Status in the Turag River, Bangladesh > 3.1. Spatial Mapping of Physicochemical Attributes in the Turag River Water
plain- Asserted: passes — The authors put it forward as true.
- Checkable: passes — It can be checked against evidence.
- Load-bearing: unclear — It is unclear whether the paper’s conclusions depend on it.
- Based: passes — The paper gives a reason why it holds.
- Rests on an assumption: The nine sampling sites adequately represent water quality along the studied section of the Turag River.
In the paper
“While all measured pH values fell within the acceptable range (6-9) established by DoE standards [44].”
§ GIS-Based Evaluation of Pollution Sources and Water Quality Status in the Turag River, Bangladesh > 3.1. Spatial Mapping of Physicochemical Attributes in the Turag River Water
What the sources say
- Not matchedcites [44]
Couldn’t be matched to a paper in Crossref, so it can’t be checked.
plain- Asserted: passes — The authors put it forward as true.
- Checkable: passes — It can be checked against evidence.
- Load-bearing: unclear — It is unclear whether the paper’s conclusions depend on it.
- Based: passes — The paper gives a reason why it holds.
- Not matched
A result the paper reports from its own data — it cites no other source for it, so there is none to check. The quote shows it is in the paper.
In the paper
“All samples exhibited nitrate values well below the DoE standard limit of 10 ppm.”
§ GIS-Based Evaluation of Pollution Sources and Water Quality Status in the Turag River, Bangladesh > 3.1. Spatial Mapping of Physicochemical Attributes in the Turag River Water
boosted- Asserted: passes — The authors put it forward as true.
- Checkable: passes — It can be checked against evidence.
- Load-bearing: unclear — It is unclear whether the paper’s conclusions depend on it.
- Based: passes — The paper gives a reason why it holds.
None of the sources cited for this claim have been checked yet.
In the paper
“According to the water quality classification system presented in Table 6, the average WQI value of 36.68 places the Turag River water quality in the”
§ GIS-Based Evaluation of Pollution Sources and Water Quality Status in the Turag River, Bangladesh > 3.2. Spatial Mapping of the Water Quality Index (WQI) in the Turag River
plain- Asserted: passes — The authors put it forward as true.
- Checkable: passes — It can be checked against evidence.
- Load-bearing: passes — The paper’s conclusions depend on it.
- Based: passes — The paper gives a reason why it holds.
- Rests on an assumption: The nine sampling sites adequately represent water quality along the studied section of the Turag River.
A result the paper reports from its own data — it cites no other source for it, so there is none to check. The quote shows it is in the paper.
In the paper
“Notably, TSS concentrations ranged from 85 to 125 ppm (average 103.88 ppm), phosphate content varied from 2.52 to 4.92 ppm (mean 3.82 ppm), and nitrate levels ranged from 1.29 to 2.89 ppm (average 1.86 ppm), with temperature measurements between 29°C and 33°C (average 31.18°C).”
§ GIS-Based Evaluation of Pollution Sources and Water Quality Status in the Turag River, Bangladesh > 4. Conclusion
plain- Asserted: passes — The authors put it forward as true.
- Checkable: passes — It can be checked against evidence.
- Load-bearing: passes — The paper’s conclusions depend on it.
- Based: passes — The paper gives a reason why it holds.
- Rests on an assumption: The nine sampling sites adequately represent water quality along the studied section of the Turag River.
A result the paper reports from its own data — it cites no other source for it, so there is none to check. The quote shows it is in the paper.
In the paper
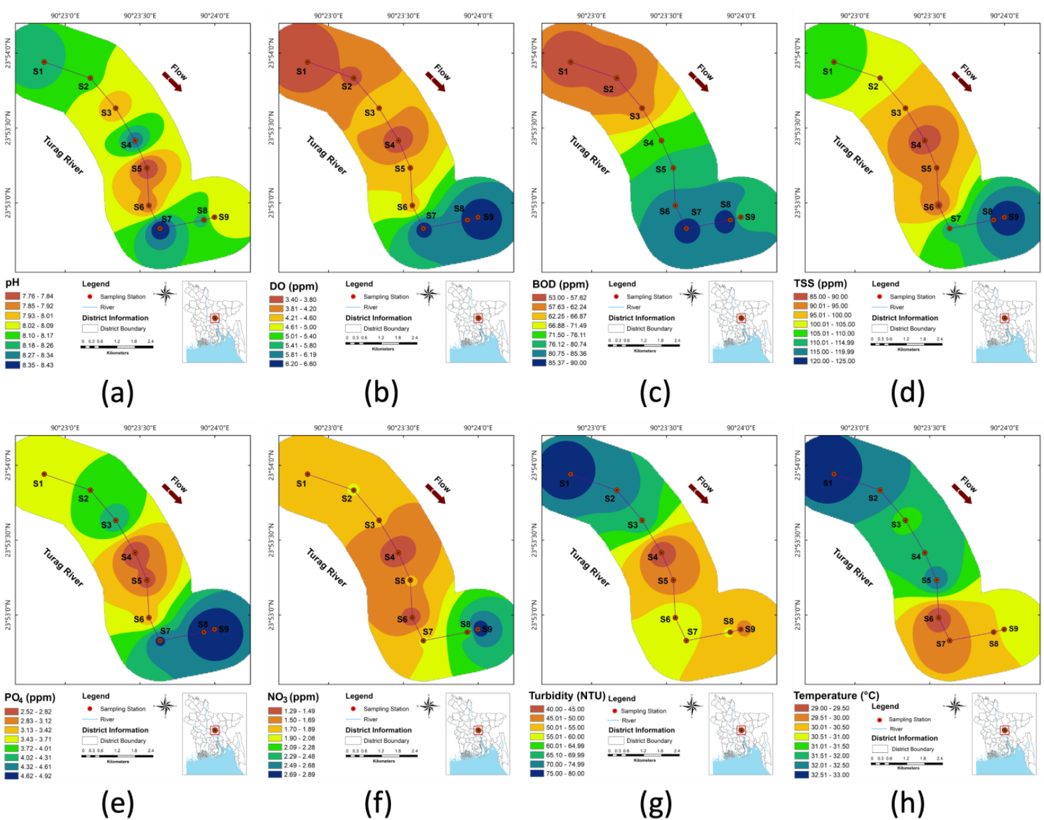
“The spatial mapping in Fig. (3b) reveals a distinct north-south gradient, with critically low DO levels in the northern portions (primarily at sites S1 and S4 with values of 3.5 and 3.4 ppm, respectively).”
§ GIS-Based Evaluation of Pollution Sources and Water Quality Status in the Turag River, Bangladesh > 3.1. Spatial Mapping of Physicochemical Attributes in the Turag River Water
plain- Asserted: passes — The authors put it forward as true.
- Checkable: passes — It can be checked against evidence.
- Load-bearing: passes — The paper’s conclusions depend on it.
- Based: passes — The paper gives a reason why it holds.
A result the paper reports from its own data — it cites no other source for it, so there is none to check. The quote shows it is in the paper.
In the paper
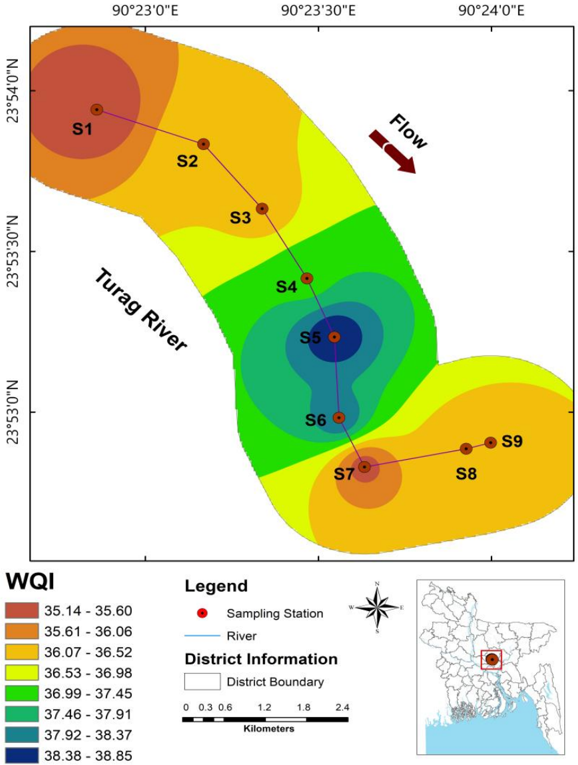
“The spatial distribution of WQI values across the study area, as visualized in Fig. (4), reveals distinct patterns of water quality variation along the Turag River.”
§ GIS-Based Evaluation of Pollution Sources and Water Quality Status in the Turag River, Bangladesh > 3.2. Spatial Mapping of the Water Quality Index (WQI) in the Turag River
plaincorrelational- Asserted: passes — The authors put it forward as true.
- Checkable: passes — It can be checked against evidence.
- Load-bearing: passes — The paper’s conclusions depend on it.
- Based: passes — The paper gives a reason why it holds.
- Rests on an assumption: The nine sampling sites adequately represent water quality along the studied section of the Turag River.
A result the paper reports from its own data — it cites no other source for it, so there is none to check. The quote shows it is in the paper.
In the paper
“turbidity levels (40-80 NTU, mean 58.77NTU) exceeding Department of Environment standards at all sampling sites.”
§ GIS-Based Evaluation of Pollution Sources and Water Quality Status in the Turag River, Bangladesh > Abstract
plain- Asserted: passes — The authors put it forward as true.
- Checkable: passes — It can be checked against evidence.
- Load-bearing: passes — The paper’s conclusions depend on it.
- Based: passes — The paper gives a reason why it holds.
- It may state two separate claims as one. 48
- Probably not a substantial claim. 20
- The quote only partly states this claim. 2
A result the paper reports from its own data — it cites no other source for it, so there is none to check. The quote shows it is in the paper.
In the paper
“As presented in Table 5, the calculated WQI values for the nine sampling sites range from 35.14 to 38.83, with an average value of 36.68.”
§ GIS-Based Evaluation of Pollution Sources and Water Quality Status in the Turag River, Bangladesh > 3.2. Spatial Mapping of the Water Quality Index (WQI) in the Turag River
plain- Asserted: passes — The authors put it forward as true.
- Checkable: passes — It can be checked against evidence.
- Load-bearing: passes — The paper’s conclusions depend on it.
- Based: passes — The paper gives a reason why it holds.
It may state two separate claims as one.
- Rests on an assumption: The nine sampling sites adequately represent water quality along the studied section of the Turag River.
In the paper
“Although the measured phosphate levels remained within the DoE standard range (5-8 ppm), they exceeded the maximum permissible limit of 2.00 ppm for irrigation water as recommended by Ayers and Westcot [45].”
§ GIS-Based Evaluation of Pollution Sources and Water Quality Status in the Turag River, Bangladesh > 3.1. Spatial Mapping of Physicochemical Attributes in the Turag River Water
What the sources say
- Not matchedcites [45]
Couldn’t be matched to a paper in Crossref, so it can’t be checked.
plain- Asserted: passes — The authors put it forward as true.
- Checkable: passes — It can be checked against evidence.
- Load-bearing: passes — The paper’s conclusions depend on it.
- Based: passes — The paper gives a reason why it holds.
It may state two separate claims as one.
- Not matched
A result the paper reports from its own data — it cites no other source for it, so there is none to check. The quote shows it is in the paper.
In the paper
“with BOD values (53-90 ppm, mean 73 ppm) and turbidity levels (40-80 NTU, mean 58.77NTU) exceeding Department of Environment standards at all sampling sites.”
§ GIS-Based Evaluation of Pollution Sources and Water Quality Status in the Turag River, Bangladesh > Abstract
plain- Asserted: passes — The authors put it forward as true.
- Checkable: passes — It can be checked against evidence.
- Load-bearing: passes — The paper’s conclusions depend on it.
- Based: passes — The paper gives a reason why it holds.
It may state two separate claims as one.
A result the paper reports from its own data — it cites no other source for it, so there is none to check. The quote shows it is in the paper.
In the paper
“Particularly significant are the extremely high BOD values (53-90 ppm) recorded at all sampling sites, which exceed the DoE standard of 50 ppm (Table 4), indicating severe organic pollution throughout the river.”
§ GIS-Based Evaluation of Pollution Sources and Water Quality Status in the Turag River, Bangladesh > 3.2. Spatial Mapping of the Water Quality Index (WQI) in the Turag River
hedgeddirect- Asserted: passes — The authors put it forward as true.
- Checkable: passes — It can be checked against evidence.
- Load-bearing: passes — The paper’s conclusions depend on it.
- Based: passes — The paper gives a reason why it holds.
It may state two separate claims as one.
- Rests on an assumption: The nine sampling sites adequately represent water quality along the studied section of the Turag River.
A result the paper reports from its own data — it cites no other source for it, so there is none to check. The quote shows it is in the paper.
In the paper
“As depicted in Fig. (2d), the highest TSS values were observed at site S9 (125 ppm) and site S8 (120 ppm), while the lowest concentration (85 ppm) was recorded at site S4.”
§ GIS-Based Evaluation of Pollution Sources and Water Quality Status in the Turag River, Bangladesh > 3.1. Spatial Mapping of Physicochemical Attributes in the Turag River Water
plain- Asserted: passes — The authors put it forward as true.
- Checkable: passes — It can be checked against evidence.
- Load-bearing: unclear — It is unclear whether the paper’s conclusions depend on it.
- Based: passes — The paper gives a reason why it holds.
It may state two separate claims as one.
A result the paper reports from its own data — it cites no other source for it, so there is none to check. The quote shows it is in the paper.
In the paper
“Fig. (2e) reveals that the highest PO₄ concentrations were detected at sites S8 (4.92 ppm) and S9 (4.85 ppm), while the lowest value (2.52 ppm) was recorded at site S4.”
§ GIS-Based Evaluation of Pollution Sources and Water Quality Status in the Turag River, Bangladesh > 3.1. Spatial Mapping of Physicochemical Attributes in the Turag River Water
plain- Asserted: passes — The authors put it forward as true.
- Checkable: passes — It can be checked against evidence.
- Load-bearing: unclear — It is unclear whether the paper’s conclusions depend on it.
- Based: passes — The paper gives a reason why it holds.
It may state two separate claims as one.
A result the paper reports from its own data — it cites no other source for it, so there is none to check. The quote shows it is in the paper.
In the paper
“The pH values of the collected water samples ranged from 7.76 to 8.43 with a mean value of 8.09 (standard deviation, SD = 0.22), indicating mild alkalinity.”
§ GIS-Based Evaluation of Pollution Sources and Water Quality Status in the Turag River, Bangladesh > 3.1. Spatial Mapping of Physicochemical Attributes in the Turag River Water
plain- Asserted: passes — The authors put it forward as true.
- Checkable: passes — It can be checked against evidence.
- Load-bearing: unclear — It is unclear whether the paper’s conclusions depend on it.
- Based: passes — The paper gives a reason why it holds.
It may state two separate claims as one.
A result the paper reports from its own data — it cites no other source for it, so there is none to check. The quote shows it is in the paper.
In the paper
“The lowest WQI value (35.14) was recorded at sampling site S1 (Beximco Pharma), while the highest value (38.83) was observed at site S5 (Ultra Washing and Dyeing Ltd).”
§ GIS-Based Evaluation of Pollution Sources and Water Quality Status in the Turag River, Bangladesh > 3.2. Spatial Mapping of the Water Quality Index (WQI) in the Turag River
plain- Asserted: passes — The authors put it forward as true.
- Checkable: passes — It can be checked against evidence.
- Load-bearing: unclear — It is unclear whether the paper’s conclusions depend on it.
- Based: passes — The paper gives a reason why it holds.
It may state two separate claims as one.
- Rests on an assumption: The nine sampling sites adequately represent water quality along the studied section of the Turag River.
A result the paper reports from its own data — it cites no other source for it, so there is none to check. The quote shows it is in the paper.
In the paper
“Notably, sampling sites S6 (Drug International Ltd) and S4 (NOVARTIS) also exhibited relatively higher WQI values of 38.32 and 37.28, respectively.”
§ GIS-Based Evaluation of Pollution Sources and Water Quality Status in the Turag River, Bangladesh > 3.2. Spatial Mapping of the Water Quality Index (WQI) in the Turag River
plain- Asserted: passes — The authors put it forward as true.
- Checkable: passes — It can be checked against evidence.
- Load-bearing: unclear — It is unclear whether the paper’s conclusions depend on it.
- Based: passes — The paper gives a reason why it holds.
It may state two separate claims as one.
- Rests on an assumption: The nine sampling sites adequately represent water quality along the studied section of the Turag River.
A result the paper reports from its own data — it cites no other source for it, so there is none to check. The quote shows it is in the paper.
In the paper
“Fig. (2b) illustrates significant variations in DO levels, with notably higher concentrations (6.2-6.6 ppm) observed at sampling sites S7, S8, and S9, indicating relatively improved oxygenation in the southern segment of the study area.”
§ GIS-Based Evaluation of Pollution Sources and Water Quality Status in the Turag River, Bangladesh > 3.1. Spatial Mapping of Physicochemical Attributes in the Turag River Water
hedgedcorrelational- Asserted: passes — The authors put it forward as true.
- Checkable: passes — It can be checked against evidence.
- Load-bearing: unclear — It is unclear whether the paper’s conclusions depend on it.
- Based: passes — The paper gives a reason why it holds.
It may state two separate claims as one.
A result the paper reports from its own data — it cites no other source for it, so there is none to check. The quote shows it is in the paper.
In the paper
“Moreover, the TSS concentrations in the water samples ranged from 85 to 125 ppm with an average value of 103.88 ppm (SD = 13.98).”
§ GIS-Based Evaluation of Pollution Sources and Water Quality Status in the Turag River, Bangladesh > 3.1. Spatial Mapping of Physicochemical Attributes in the Turag River Water
plain- Asserted: passes — The authors put it forward as true.
- Checkable: passes — It can be checked against evidence.
- Load-bearing: passes — The paper’s conclusions depend on it.
- Based: passes — The paper gives a reason why it holds.
It may state two separate claims as one.
The paper states this without a source or data behind it here, so there is nothing to check it against. The quote shows it is in the paper.
In the paper
“The northern section of the study area exhibits critical conditions for parameters such as DO and turbidity, while the southern segment shows elevated levels of BOD, phosphate, and nitrate.”
§ GIS-Based Evaluation of Pollution Sources and Water Quality Status in the Turag River, Bangladesh > 3.1. Spatial Mapping of Physicochemical Attributes in the Turag River Water
plaincorrelational- Asserted: passes — The authors put it forward as true.
- Checkable: passes — It can be checked against evidence.
- Load-bearing: passes — The paper’s conclusions depend on it.
- Based: passes — The paper gives a reason why it holds.
It may state two separate claims as one.
- Rests on an assumption: The nine sampling sites adequately represent water quality along the studied section of the Turag River.
A result the paper reports from its own data — it cites no other source for it, so there is none to check. The quote shows it is in the paper.
In the paper
“The GIS-based assessment of the Turag River revealed severe water quality degradation throughout the studied section, with spatial mapping effectively identifying pollution hotspots and contamination gradients.”
§ GIS-Based Evaluation of Pollution Sources and Water Quality Status in the Turag River, Bangladesh > 4. Conclusion
plaincorrelational- Asserted: passes — The authors put it forward as true.
- Checkable: passes — It can be checked against evidence.
- Load-bearing: passes — The paper’s conclusions depend on it.
- Based: passes — The paper gives a reason why it holds.
It may state two separate claims as one.
- Rests on an assumption: The nine sampling sites adequately represent water quality along the studied section of the Turag River.
The paper states this without a source or data behind it here, so there is nothing to check it against. The quote shows it is in the paper.
In the paper
“The central portion of the study area shows a slight improvement in WQI values, particularly at sampling sites S5 and S6, which recorded the highest WQI values among all sites.”
§ GIS-Based Evaluation of Pollution Sources and Water Quality Status in the Turag River, Bangladesh > 3.2. Spatial Mapping of the Water Quality Index (WQI) in the Turag River
plaincorrelational- Asserted: passes — The authors put it forward as true.
- Checkable: passes — It can be checked against evidence.
- Load-bearing: unclear — It is unclear whether the paper’s conclusions depend on it.
- Based: passes — The paper gives a reason why it holds.
It may state two separate claims as one.
- Rests on an assumption: The nine sampling sites adequately represent water quality along the studied section of the Turag River.
A result the paper reports from its own data — it cites no other source for it, so there is none to check. The quote shows it is in the paper.
In the paper
“The interpolated surfaces demonstrate distinct spatial patterns for different parameters, with most contaminants showing concentration gradients that correlate with the distribution of industrial facilities.”
§ GIS-Based Evaluation of Pollution Sources and Water Quality Status in the Turag River, Bangladesh > 3.1. Spatial Mapping of Physicochemical Attributes in the Turag River Water
boostedcorrelational- Asserted: passes — The authors put it forward as true.
- Checkable: passes — It can be checked against evidence.
- Load-bearing: passes — The paper’s conclusions depend on it.
- Based: passes — The paper gives a reason why it holds.
It may state two separate claims as one.
- Rests on an assumption: The nine sampling sites adequately represent water quality along the studied section of the Turag River.
A result the paper reports from its own data — it cites no other source for it, so there is none to check. The quote shows it is in the paper.
In the paper
“As shown in Fig. (2f), the highest NO₃ level was measured at site S9 (2.89 ppm), while the lowest concentration (1.29 ppm) was found at site S4.”
§ GIS-Based Evaluation of Pollution Sources and Water Quality Status in the Turag River, Bangladesh > 3.1. Spatial Mapping of Physicochemical Attributes in the Turag River Water
plain- Asserted: passes — The authors put it forward as true.
- Checkable: passes — It can be checked against evidence.
- Load-bearing: unclear — It is unclear whether the paper’s conclusions depend on it.
- Based: passes — The paper gives a reason why it holds.
It may state two separate claims as one.
A result the paper reports from its own data — it cites no other source for it, so there is none to check. The quote shows it is in the paper.
In the paper
“Fig. (2g) illustrates that the highest turbidity was recorded at site S1 (80 NTU), followed by site S2 (75 NTU), while the lowest value (40 NTU) was observed at site S4.”
§ GIS-Based Evaluation of Pollution Sources and Water Quality Status in the Turag River, Bangladesh > 3.1. Spatial Mapping of Physicochemical Attributes in the Turag River Water
plain- Asserted: passes — The authors put it forward as true.
- Checkable: passes — It can be checked against evidence.
- Load-bearing: unclear — It is unclear whether the paper’s conclusions depend on it.
- Based: passes — The paper gives a reason why it holds.
It may state two separate claims as one.
- Rests on an assumption: The nine sampling sites adequately represent water quality along the studied section of the Turag River.
The paper states this without a source or data behind it here, so there is nothing to check it against. The quote shows it is in the paper.
In the paper
“Although turbidity and TSS are generally positively correlated, their spatial trends diverge (Fig. 3d, 3g).”
§ GIS-Based Evaluation of Pollution Sources and Water Quality Status in the Turag River, Bangladesh > 3.1. Spatial Mapping of Physicochemical Attributes in the Turag River Water
plaincorrelational- Asserted: passes — The authors put it forward as true.
- Checkable: passes — It can be checked against evidence.
- Load-bearing: unclear — It is unclear whether the paper’s conclusions depend on it.
- Based: passes — The paper gives a reason why it holds.
It may state two separate claims as one.
- Rests on an assumption: Turbidity and TSS are generally positively correlated.
A result the paper reports from its own data — it cites no other source for it, so there is none to check. The quote shows it is in the paper.
In the paper
“The northern section exhibited critical conditions for dissolved oxygen (3.4-3.5 ppm) and turbidity (75-80 NTU), while the southern segment showed elevated levels of BOD, phosphate, and nitrate.”
§ GIS-Based Evaluation of Pollution Sources and Water Quality Status in the Turag River, Bangladesh > Abstract
plain- Asserted: passes — The authors put it forward as true.
- Checkable: passes — It can be checked against evidence.
- Load-bearing: unclear — It is unclear whether the paper’s conclusions depend on it.
- Based: passes — The paper gives a reason why it holds.
It may state two separate claims as one.
- Rests on an assumption: The nine sampling locations adequately represent water quality variations along the Turag River.
A result the paper reports from its own data — it cites no other source for it, so there is none to check. The quote shows it is in the paper.
In the paper
“Although all measured TSS values remained below the DoE standard limit of 150 ppm, most samples contained TSS concentrations exceeding 100 ppm.”
§ GIS-Based Evaluation of Pollution Sources and Water Quality Status in the Turag River, Bangladesh > 3.1. Spatial Mapping of Physicochemical Attributes in the Turag River Water
plain- Asserted: passes — The authors put it forward as true.
- Checkable: passes — It can be checked against evidence.
- Load-bearing: unclear — It is unclear whether the paper’s conclusions depend on it.
- Based: passes — The paper gives a reason why it holds.
It may state two separate claims as one.
A result the paper reports from its own data — it cites no other source for it, so there is none to check. The quote shows it is in the paper.
In the paper
“As illustrated in Fig. (2h), the highest temperature was recorded at site S1 (33°C), while the lowest values were observed at sites S6 and S7 (29°C and 29.5°C, respectively).”
§ GIS-Based Evaluation of Pollution Sources and Water Quality Status in the Turag River, Bangladesh > 3.1. Spatial Mapping of Physicochemical Attributes in the Turag River Water
plain- Asserted: passes — The authors put it forward as true.
- Checkable: passes — It can be checked against evidence.
- Load-bearing: unclear — It is unclear whether the paper’s conclusions depend on it.
- Based: passes — The paper gives a reason why it holds.
It may state two separate claims as one.
- Rests on an assumption: The nine sampling sites adequately represent water quality along the studied section of the Turag River.
A result the paper reports from its own data — it cites no other source for it, so there is none to check. The quote shows it is in the paper.
In the paper
“The pollution severity mapping shows a heterogeneous distribution of water quality, with notable spatial gradients in different sections of the river.”
§ GIS-Based Evaluation of Pollution Sources and Water Quality Status in the Turag River, Bangladesh > 3.2. Spatial Mapping of the Water Quality Index (WQI) in the Turag River
plaincorrelational- Asserted: passes — The authors put it forward as true.
- Checkable: passes — It can be checked against evidence.
- Load-bearing: passes — The paper’s conclusions depend on it.
- Based: passes — The paper gives a reason why it holds.
It may state two separate claims as one.
- Rests on an assumption: The nine sampling sites adequately represent water quality along the studied section of the Turag River.
The paper states this without a source or data behind it here, so there is nothing to check it against. The quote shows it is in the paper.
In the paper
“Moreover, the southern section of the study area exhibits moderate WQI values, despite showing elevated levels of BOD (Fig. 3c), phosphate (Fig. 3e), and nitrate (Fig. 3f) as discussed in Section 3.1.”
§ GIS-Based Evaluation of Pollution Sources and Water Quality Status in the Turag River, Bangladesh > 3.2. Spatial Mapping of the Water Quality Index (WQI) in the Turag River
plaincorrelational- Asserted: passes — The authors put it forward as true.
- Checkable: passes — It can be checked against evidence.
- Load-bearing: unclear — It is unclear whether the paper’s conclusions depend on it.
- Based: passes — The paper gives a reason why it holds.
It may state two separate claims as one.
- Rests on an assumption: The nine sampling sites adequately represent water quality along the studied section of the Turag River.
A conclusion the paper draws from its own results — it cites no other source for it, so there is none to check. The quote shows it is in the paper.
In the paper
“This temperature decline aligns with zones of elevated pollutant concentrations, suggesting that increased pollution loads may locally suppress surface heating.”
§ GIS-Based Evaluation of Pollution Sources and Water Quality Status in the Turag River, Bangladesh > 3.1. Spatial Mapping of Physicochemical Attributes in the Turag River Water
hedgedconditional- Asserted: passes — The authors put it forward as true.
- Checkable: passes — It can be checked against evidence.
- Load-bearing: fails — The paper’s conclusions may not depend on it.
- Based: passes — The paper gives a reason why it holds.
Probably not a substantial claim. The paper’s conclusions may not depend on it. It may state two separate claims as one.
In the paper
“Major pollution sources include consumer goods industries (soap and detergent manufacturers), garment factories, pharmaceutical companies, dyeing operations, textile mills, paint manufacturers, chemical factories, and steel workshops [20].”
§ GIS-Based Evaluation of Pollution Sources and Water Quality Status in the Turag River, Bangladesh > 1. Introduction
What the sources say
- Not matchedcites [20]
Couldn’t be matched to a paper in Crossref, so it can’t be checked.
plain- Asserted: passes — The authors put it forward as true.
- Checkable: passes — It can be checked against evidence.
- Load-bearing: passes — The paper’s conclusions depend on it.
- Based: passes — The paper gives a reason why it holds.
It may state two separate claims as one.
- Not matched
A conclusion the paper draws from its own results — it cites no other source for it, so there is none to check. The quote shows it is in the paper.
In the paper
“The consistently”
§ GIS-Based Evaluation of Pollution Sources and Water Quality Status in the Turag River, Bangladesh > 3.2. Spatial Mapping of the Water Quality Index (WQI) in the Turag River
plaindirect- Asserted: passes — The authors put it forward as true.
- Checkable: passes — It can be checked against evidence.
- Load-bearing: passes — The paper’s conclusions depend on it.
- Based: passes — The paper gives a reason why it holds.
The quote only partly states this claim.
- Rests on an assumption: The nine sampling sites adequately represent water quality along the studied section of the Turag River.
In the paper
“As noted by Thukral [39], a minimum of six parameters can be used for valid WQI calculation.”
§ GIS-Based Evaluation of Pollution Sources and Water Quality Status in the Turag River, Bangladesh > 2.4. Water Quality Index (WQI)
What the sources say
- Not matchedcites [39]
Couldn’t be matched to a paper in Crossref, so it can’t be checked.
plain- Asserted: passes — The authors put it forward as true.
- Checkable: passes — It can be checked against evidence.
- Load-bearing: fails — The paper’s conclusions may not depend on it.
- Based: passes — The paper gives a reason why it holds.
Probably not a substantial claim. The paper’s conclusions may not depend on it.
- Not matched
None of the sources cited for this claim could be matched to a paper in Crossref, so there is nothing to check it against.
In the paper
“Overall, the limitation of water usability to”
§ GIS-Based Evaluation of Pollution Sources and Water Quality Status in the Turag River, Bangladesh > 3.2. Spatial Mapping of the Water Quality Index (WQI) in the Turag River
What the sources say
- Not matchedcites [51]
Couldn’t be matched to a paper in Crossref, so it can’t be checked.
- Not matchedcites [52]
Couldn’t be matched to a paper in Crossref, so it can’t be checked.
- Not matchedcites [53]
Couldn’t be matched to a paper in Crossref, so it can’t be checked.
hedged- Asserted: passes — The authors put it forward as true.
- Checkable: passes — It can be checked against evidence.
- Load-bearing: passes — The paper’s conclusions depend on it.
- Based: passes — The paper gives a reason why it holds.
It may state two separate claims as one.
- Not matched
What the paper did — it cites no source for this, so there is none to check. The quote shows it is in the paper.
In the paper
“Bottles were immediately sealed to prevent atmospheric contamination and shielded with black polythene to protect against photochemical alterations.”
§ GIS-Based Evaluation of Pollution Sources and Water Quality Status in the Turag River, Bangladesh > 2.2. Sample Collection
plaindirect- Asserted: passes — The authors put it forward as true.
- Checkable: passes — It can be checked against evidence.
- Load-bearing: fails — The paper’s conclusions may not depend on it.
- Based: passes — The paper gives a reason why it holds.
Probably not a substantial claim. The paper’s conclusions may not depend on it. It may state two separate claims as one.
What the paper did — it cites no source for this, so there is none to check. The quote shows it is in the paper.
In the paper
“Finally, the study focused primarily on physicochemical parameters, excluding biological indicators such as fecal coliform, which could provide additional insights into ecological integrity and public health risks.”
§ GIS-Based Evaluation of Pollution Sources and Water Quality Status in the Turag River, Bangladesh > 3.3. Research Implications, Constraints and Future Pathways
plain- Asserted: passes — The authors put it forward as true.
- Checkable: passes — It can be checked against evidence.
- Load-bearing: fails — The paper’s conclusions may not depend on it.
- Based: passes — The paper gives a reason why it holds.
Probably not a substantial claim. The paper’s conclusions may not depend on it. It may state two separate claims as one.
None of the sources cited for this claim could be matched to a paper in Crossref, so there is nothing to check it against.
In the paper
“Beyond these acute effects, long-term ingestion of nitrate-laden water has been linked to thyroid dysfunction, adverse reproductive outcomes (e.g., neural-tube defects), and higher incidence of colorectal and bladder cancers in adults [48,49].”
§ GIS-Based Evaluation of Pollution Sources and Water Quality Status in the Turag River, Bangladesh > 3.1. Spatial Mapping of Physicochemical Attributes in the Turag River Water
What the sources say
- Not matchedcites [48]
Couldn’t be matched to a paper in Crossref, so it can’t be checked.
- Not matchedcites [49]
Couldn’t be matched to a paper in Crossref, so it can’t be checked.
plaincorrelational- Asserted: passes — The authors put it forward as true.
- Checkable: passes — It can be checked against evidence.
- Load-bearing: fails — The paper’s conclusions may not depend on it.
- Based: passes — The paper gives a reason why it holds.
Probably not a substantial claim. The paper’s conclusions may not depend on it. It may state two separate claims as one.
- Not matched
What the paper did — it cites no source for this, so there is none to check. The quote shows it is in the paper.
In the paper
“However, due to the absence of chlorophyll-a or light-use efficiency data, GPP and NPP estimation was not feasible in the current study.”
§ GIS-Based Evaluation of Pollution Sources and Water Quality Status in the Turag River, Bangladesh > 3.3. Research Implications, Constraints and Future Pathways
plaindirect- Asserted: passes — The authors put it forward as true.
- Checkable: passes — It can be checked against evidence.
- Load-bearing: fails — The paper’s conclusions may not depend on it.
- Based: passes — The paper gives a reason why it holds.
Probably not a substantial claim. The paper’s conclusions may not depend on it.
In the paper
“Excessive phosphate in irrigation waters can adversely affect crop health by reducing chlorophyll content in leaves and diminishing sugar content [46].”
§ GIS-Based Evaluation of Pollution Sources and Water Quality Status in the Turag River, Bangladesh > 3.1. Spatial Mapping of Physicochemical Attributes in the Turag River Water
What the sources say
- Not matchedcites [46]
Couldn’t be matched to a paper in Crossref, so it can’t be checked.
plaindirect- Asserted: passes — The authors put it forward as true.
- Checkable: passes — It can be checked against evidence.
- Load-bearing: fails — The paper’s conclusions may not depend on it.
- Based: passes — The paper gives a reason why it holds.
Probably not a substantial claim. The paper’s conclusions may not depend on it. It may state two separate claims as one.
- Not matched
A conclusion the paper draws from its own results — it cites no other source for it, so there is none to check. The quote shows it is in the paper.
In the paper
“The consistently low WQI values across all sampling sites reflect the cumulative impact of multiple pollutants exceeding permissible limits, as evidenced by the physicochemical parameter analysis.”
§ GIS-Based Evaluation of Pollution Sources and Water Quality Status in the Turag River, Bangladesh > 3.2. Spatial Mapping of the Water Quality Index (WQI) in the Turag River
plaindirect- Asserted: passes — The authors put it forward as true.
- Checkable: passes — It can be checked against evidence.
- Load-bearing: passes — The paper’s conclusions depend on it.
- Based: passes — The paper gives a reason why it holds.
It may state two separate claims as one.
- Rests on an assumption: The nine sampling sites adequately represent water quality along the studied section of the Turag River.
A conclusion the paper draws from its own results — it cites no other source for it, so there is none to check. The quote shows it is in the paper.
In the paper
“Such depleted oxygen levels (below 5.0 ppm) can place aquatic life under considerable stress and impair natural stream purification processes.”
§ GIS-Based Evaluation of Pollution Sources and Water Quality Status in the Turag River, Bangladesh > 3.1. Spatial Mapping of Physicochemical Attributes in the Turag River Water
plaindirect- Asserted: passes — The authors put it forward as true.
- Checkable: passes — It can be checked against evidence.
- Load-bearing: fails — The paper’s conclusions may not depend on it.
- Based: passes — The paper gives a reason why it holds.
Probably not a substantial claim. The paper’s conclusions may not depend on it. It may state two separate claims as one.
In the paper
“Most industries in this region discharge effluents directly or indirectly into the Turag River without adequate treatment, causing significant deterioration of surface water quality.”
- Also stated in: § 1. Introduction · plain
“Although the DoE has declared the Turag River an Ecologically Critical Area (ECA) and has conducted multiple water quality assessments [21], industrial facilities continue to discharge effluents and wastewater into the river, causing serious pollution [22].”
§ GIS-Based Evaluation of Pollution Sources and Water Quality Status in the Turag River, Bangladesh > 1. Introduction
What the sources say
- Not matchedcites [22]
Couldn’t be matched to a paper in Crossref, so it can’t be checked.
plaindirect- Asserted: passes — The authors put it forward as true.
- Checkable: passes — It can be checked against evidence.
- Load-bearing: passes — The paper’s conclusions depend on it.
- Based: passes — The paper gives a reason why it holds.
It may state two separate claims as one.
- Also stated in: § 1. Introduction · plain
In the paper
“In surface waters, sustained phosphate enrichment also accelerates eutrophication, triggering dense algal and cyanobacterial blooms that subsequently deplete dissolved oxygen, release harmful cyanotoxins (e.g., microcystins), and generate taste-andodour compounds, all of which degrade drinking-water quality and pose acute risks to fish, livestock, and human health [47].”
§ GIS-Based Evaluation of Pollution Sources and Water Quality Status in the Turag River, Bangladesh > 3.1. Spatial Mapping of Physicochemical Attributes in the Turag River Water
What the sources say
- Not matchedcites [47]
Couldn’t be matched to a paper in Crossref, so it can’t be checked.
plaindirect- Asserted: passes — The authors put it forward as true.
- Checkable: passes — It can be checked against evidence.
- Load-bearing: fails — The paper’s conclusions may not depend on it.
- Based: passes — The paper gives a reason why it holds.
Probably not a substantial claim. The paper’s conclusions may not depend on it. It may state two separate claims as one.
- Not matched
A conclusion the paper draws from its own results — it cites no other source for it, so there is none to check. The quote shows it is in the paper.
In the paper
“Overall, the spatial mapping of physicochemical parameters using GIS techniques (Fig. 3) effectively highlights pollution hotspots and reveals spatial trends in water quality degradation along the Turag River.”
§ GIS-Based Evaluation of Pollution Sources and Water Quality Status in the Turag River, Bangladesh > 3.1. Spatial Mapping of Physicochemical Attributes in the Turag River Water
plaindirect- Asserted: passes — The authors put it forward as true.
- Checkable: passes — It can be checked against evidence.
- Load-bearing: passes — The paper’s conclusions depend on it.
- Based: passes — The paper gives a reason why it holds.
It may state two separate claims as one.
- Rests on an assumption: The nine sampling sites adequately represent water quality along the studied section of the Turag River.
What the paper did — it cites no source for this, so there is none to check. The quote shows it is in the paper.
In the paper
“To ensure representative sampling and minimize bias, collection was conducted from the mid-stream at 8-10 inches depth, rather than from outlets or riverbanks.”
§ GIS-Based Evaluation of Pollution Sources and Water Quality Status in the Turag River, Bangladesh > 2.2. Sample Collection
plaindirect- Asserted: passes — The authors put it forward as true.
- Checkable: passes — It can be checked against evidence.
- Load-bearing: passes — The paper’s conclusions depend on it.
- Based: passes — The paper gives a reason why it holds.
Probably not a substantial claim. It may state two separate claims as one.
None of the sources cited for this claim could be matched to a paper in Crossref, so there is nothing to check it against.
In the paper
“The NSFWQI incorporates nine critical water quality parameters: DO, pH, BOD, Temperature, Total Phosphate, Nitrate, Turbidity, Total Suspended Solids, and Fecal Coliform [33,37].”
§ GIS-Based Evaluation of Pollution Sources and Water Quality Status in the Turag River, Bangladesh > 2.4. Water Quality Index (WQI)
What the sources say
- Not matchedcites [33]
Couldn’t be matched to a paper in Crossref, so it can’t be checked.
- Not matchedcites [37]
Couldn’t be matched to a paper in Crossref, so it can’t be checked.
plain- Asserted: passes — The authors put it forward as true.
- Checkable: passes — It can be checked against evidence.
- Load-bearing: passes — The paper’s conclusions depend on it.
- Based: passes — The paper gives a reason why it holds.
Probably not a substantial claim.
- Not matched
What the paper did — it cites no source for this, so there is none to check. The quote shows it is in the paper.
In the paper
“The selection of parameters was based on their significance in determining overall water quality and their suitability for the National Sanitation Foundation Water Quality Index (NSFWQI) methodology.”
§ GIS-Based Evaluation of Pollution Sources and Water Quality Status in the Turag River, Bangladesh > 2.3. Selected Water Quality Parameters
plaindirect- Asserted: passes — The authors put it forward as true.
- Checkable: passes — It can be checked against evidence.
- Load-bearing: passes — The paper’s conclusions depend on it.
- Based: passes — The paper gives a reason why it holds.
Probably not a substantial claim. It may state two separate claims as one.
In the paper
“The resulting WQI values range from 0 to 100, with higher values indicating superior water quality [40].”
§ GIS-Based Evaluation of Pollution Sources and Water Quality Status in the Turag River, Bangladesh > 2.4. Water Quality Index (WQI)
What the sources say
- Not matchedcites [40]
Couldn’t be matched to a paper in Crossref, so it can’t be checked.
plaincorrelational- Asserted: passes — The authors put it forward as true.
- Checkable: passes — It can be checked against evidence.
- Load-bearing: passes — The paper’s conclusions depend on it.
- Based: passes — The paper gives a reason why it holds.
Probably not a substantial claim. It may state two separate claims as one.
- Not matched
None of the sources cited for this claim could be matched to a paper in Crossref, so there is nothing to check it against.
In the paper
“These findings align with previous studies [16,22] that have documented the severe degradation of the Turag River due to industrial pollution, reinforcing the DoE's designation of the river as an ECA [21].”
§ GIS-Based Evaluation of Pollution Sources and Water Quality Status in the Turag River, Bangladesh > 3.2. Spatial Mapping of the Water Quality Index (WQI) in the Turag River
What the sources say
- Not matchedcites [16]
Couldn’t be matched to a paper in Crossref, so it can’t be checked.
- Not matchedcites [22]
Couldn’t be matched to a paper in Crossref, so it can’t be checked.
- Not matchedcites [21]
Couldn’t be matched to a paper in Crossref, so it can’t be checked.
plaindirect- Asserted: passes — The authors put it forward as true.
- Checkable: passes — It can be checked against evidence.
- Load-bearing: unclear — It is unclear whether the paper’s conclusions depend on it.
- Based: passes — The paper gives a reason why it holds.
It may state two separate claims as one.
- Not matched
None of the sources cited for this claim could be matched to a paper in Crossref, so there is nothing to check it against.
In the paper
“Previous water quality monitoring efforts have been inconsistent in parameter selection, making comparative analysis challenging [20,22,54].”
§ GIS-Based Evaluation of Pollution Sources and Water Quality Status in the Turag River, Bangladesh > 1. Introduction
What the sources say
- Not matchedcites [20]
Couldn’t be matched to a paper in Crossref, so it can’t be checked.
- Not matchedcites [22]
Couldn’t be matched to a paper in Crossref, so it can’t be checked.
- Not matchedcites [54]
Couldn’t be matched to a paper in Crossref, so it can’t be checked.
plaindirect- Asserted: passes — The authors put it forward as true.
- Checkable: passes — It can be checked against evidence.
- Load-bearing: passes — The paper’s conclusions depend on it.
- Based: passes — The paper gives a reason why it holds.
It may state two separate claims as one.
- Not matched
What the paper did — it cites no source for this, so there is none to check. The quote shows it is in the paper.
In the paper
“Physical and chemical analyses were conducted using standardized protocols and calibrated instrumentation as detailed in Table 2.”
§ GIS-Based Evaluation of Pollution Sources and Water Quality Status in the Turag River, Bangladesh > 2.3. Selected Water Quality Parameters
plain- Asserted: passes — The authors put it forward as true.
- Checkable: passes — It can be checked against evidence.
- Load-bearing: passes — The paper’s conclusions depend on it.
- Based: passes — The paper gives a reason why it holds.
Probably not a substantial claim. It may state two separate claims as one.
None of the sources cited for this claim could be matched to a paper in Crossref, so there is nothing to check it against.
In the paper
“This classification has significant implications for water usability, as water bodies with WQI values in this range have”
§ GIS-Based Evaluation of Pollution Sources and Water Quality Status in the Turag River, Bangladesh > 3.2. Spatial Mapping of the Water Quality Index (WQI) in the Turag River
What the sources say
- Not matchedcites [51]
Couldn’t be matched to a paper in Crossref, so it can’t be checked.
- Not matchedcites [52]
Couldn’t be matched to a paper in Crossref, so it can’t be checked.
- Not matchedcites [53]
Couldn’t be matched to a paper in Crossref, so it can’t be checked.
plaincorrelational- Asserted: passes — The authors put it forward as true.
- Checkable: passes — It can be checked against evidence.
- Load-bearing: passes — The paper’s conclusions depend on it.
- Based: passes — The paper gives a reason why it holds.
Probably not a substantial claim. It may state two separate claims as one.
- Not matched
A conclusion the paper draws from its own results — it cites no other source for it, so there is none to check. The quote shows it is in the paper.
In the paper
“This localized improvement may be attributed to potential dilution effects or relatively lower pollutant loading in this section.”
§ GIS-Based Evaluation of Pollution Sources and Water Quality Status in the Turag River, Bangladesh > 3.2. Spatial Mapping of the Water Quality Index (WQI) in the Turag River
hedgedconditional- Asserted: passes — The authors put it forward as true.
- Checkable: passes — It can be checked against evidence.
- Load-bearing: fails — The paper’s conclusions may not depend on it.
- Based: passes — The paper gives a reason why it holds.
Probably not a substantial claim. The paper’s conclusions may not depend on it.
A conclusion the paper draws from its own results — it cites no other source for it, so there is none to check. The quote shows it is in the paper.
In the paper
“However, even these”
§ GIS-Based Evaluation of Pollution Sources and Water Quality Status in the Turag River, Bangladesh > 3.2. Spatial Mapping of the Water Quality Index (WQI) in the Turag River
plain- Asserted: passes — The authors put it forward as true.
- Checkable: passes — It can be checked against evidence.
- Load-bearing: passes — The paper’s conclusions depend on it.
- Based: passes — The paper gives a reason why it holds.
It may state two separate claims as one.
- Rests on an assumption: The nine sampling sites adequately represent water quality along the studied section of the Turag River.
A conclusion the paper draws from its own results — it cites no other source for it, so there is none to check. The quote shows it is in the paper.
In the paper
“In contrast, the elevated northern region experiences DO depletion and turbidity, likely due to steep industrial outflows and limited vegetative buffers.”
§ GIS-Based Evaluation of Pollution Sources and Water Quality Status in the Turag River, Bangladesh > 3.1. Spatial Mapping of Physicochemical Attributes in the Turag River Water
hedgedconditional- Asserted: passes — The authors put it forward as true.
- Checkable: passes — It can be checked against evidence.
- Load-bearing: passes — The paper’s conclusions depend on it.
- Based: passes — The paper gives a reason why it holds.
It may state two separate claims as one.
- Rests on an assumption: Dense riparian vegetation reduces runoff and filters pollutants, and the basin's semi-funnel geomorphology promotes downstream accumulation.
A conclusion the paper draws from its own results — it cites no other source for it, so there is none to check. The quote shows it is in the paper.
In the paper
“The consistently poor water quality classification indicates severe degradation, limiting usability to agricultural irrigation purposes only.”
§ GIS-Based Evaluation of Pollution Sources and Water Quality Status in the Turag River, Bangladesh > Abstract
plaindirect- Asserted: passes — The authors put it forward as true.
- Checkable: passes — It can be checked against evidence.
- Load-bearing: passes — The paper’s conclusions depend on it.
- Based: passes — The paper gives a reason why it holds.
It may state two separate claims as one.
In the paper
“The relatively elevated temperatures observed at certain locations may be attributed to the decomposition of organic matter by coliform bacteria, which generates excess heat and subsequently raises water temperature [50].”
§ GIS-Based Evaluation of Pollution Sources and Water Quality Status in the Turag River, Bangladesh > 3.1. Spatial Mapping of Physicochemical Attributes in the Turag River Water
What the sources say
- Not matchedcites [50]
Couldn’t be matched to a paper in Crossref, so it can’t be checked.
hedgedconditional- Asserted: passes — The authors put it forward as true.
- Checkable: passes — It can be checked against evidence.
- Load-bearing: fails — The paper’s conclusions may not depend on it.
- Based: passes — The paper gives a reason why it holds.
Probably not a substantial claim. The paper’s conclusions may not depend on it.
- Not matched
A conclusion the paper draws from its own results — it cites no other source for it, so there is none to check. The quote shows it is in the paper.
In the paper
“This is likely due to differences in particle size and composition-finer colloids in the north increase turbidity, while coarser particles in the south contribute more to TSS but less to light scattering.”
§ GIS-Based Evaluation of Pollution Sources and Water Quality Status in the Turag River, Bangladesh > 3.1. Spatial Mapping of Physicochemical Attributes in the Turag River Water
hedgedconditional- Asserted: passes — The authors put it forward as true.
- Checkable: passes — It can be checked against evidence.
- Load-bearing: unclear — It is unclear whether the paper’s conclusions depend on it.
- Based: passes — The paper gives a reason why it holds.
It may state two separate claims as one.
- Rests on an assumption: Turbidity and TSS are generally positively correlated.
A conclusion the paper draws from its own results — it cites no other source for it, so there is none to check. The quote shows it is in the paper.
In the paper
“Elevated nitrate can also act synergistically with phosphate to intensify eutrophication, indirectly exacerbating oxygen depletion and toxin release in receiving waters.”
§ GIS-Based Evaluation of Pollution Sources and Water Quality Status in the Turag River, Bangladesh > 3.1. Spatial Mapping of Physicochemical Attributes in the Turag River Water
plaindirect- Asserted: passes — The authors put it forward as true.
- Checkable: passes — It can be checked against evidence.
- Load-bearing: fails — The paper’s conclusions may not depend on it.
- Based: fails — The paper may give no reason why it holds.
Probably not a substantial claim. The paper’s conclusions may not depend on it. The paper may give no reason why it holds.
None of the sources cited for this claim could be matched to a paper in Crossref, so there is nothing to check it against.
In the paper
“Despite the relatively low nitrate concentrations compared to regulatory standards, it is important to note that elevated nitrate levels in drinking water can lead to health issues such as methemoglobinemia in infants and increased risk of gastric cancer.”
§ GIS-Based Evaluation of Pollution Sources and Water Quality Status in the Turag River, Bangladesh > 3.1. Spatial Mapping of Physicochemical Attributes in the Turag River Water
What the sources say
- Not matchedcites [48]
Couldn’t be matched to a paper in Crossref, so it can’t be checked.
- Not matchedcites [49]
Couldn’t be matched to a paper in Crossref, so it can’t be checked.
plaindirect- Asserted: passes — The authors put it forward as true.
- Checkable: passes — It can be checked against evidence.
- Load-bearing: fails — The paper’s conclusions may not depend on it.
- Based: passes — The paper gives a reason why it holds.
Probably not a substantial claim. The paper’s conclusions may not depend on it. It may state two separate claims as one.
- Not matched
A conclusion the paper draws from its own results — it cites no other source for it, so there is none to check. The quote shows it is in the paper.
In the paper
“These patterns correspond to the distribution of industrial facilities, confirming their significant contribution to river pollution.”
§ GIS-Based Evaluation of Pollution Sources and Water Quality Status in the Turag River, Bangladesh > 4. Conclusion
boosteddirect- Asserted: passes — The authors put it forward as true.
- Checkable: passes — It can be checked against evidence.
- Load-bearing: passes — The paper’s conclusions depend on it.
- Based: passes — The paper gives a reason why it holds.
It may state two separate claims as one.
- Rests on an assumption: Spatial correspondence between pollutant patterns and the distribution of industrial facilities is sufficient to infer that those facilities significantly contribute to river pollution.
A conclusion the paper draws from its own results — it cites no other source for it, so there is none to check. The quote shows it is in the paper.
In the paper
“The limitation of water usability to”
§ GIS-Based Evaluation of Pollution Sources and Water Quality Status in the Turag River, Bangladesh > 3.2. Spatial Mapping of the Water Quality Index (WQI) in the Turag River
plaindirect- Asserted: passes — The authors put it forward as true.
- Checkable: passes — It can be checked against evidence.
- Load-bearing: passes — The paper’s conclusions depend on it.
- Based: passes — The paper gives a reason why it holds.
Probably not a substantial claim. The quote only partly states this claim.
The paper relies on this without support.
The nine sampling locations adequately represent water quality variations along the Turag River.
“Water samples were collected from nine strategic locations along the Turag River where industrial effluents discharge into the waterway (Table 1) on May 22, 2024.”
The paper relies on this without support.
The nine sampling sites adequately represent water quality along the studied section of the Turag River.
“nine strategically placed sampling points that capture water quality variations along the river”
The paper relies on this without support.
Sampling during the pre-monsoon season under low-flow conditions captures critical pollution loads.
“the sampling took place during the pre-monsoon season to capture critical pollution loads under low-flow conditions.”
The paper relies on this without support.
Spatial correspondence between pollutant patterns and the distribution of industrial facilities is sufficient to infer that those facilities significantly contribute to river pollution.
“These patterns correspond to the distribution of industrial facilities, confirming their significant contribution to river pollution.”
The paper relies on this without support.
Dense riparian vegetation reduces runoff and filters pollutants, and the basin's semi-funnel geomorphology promotes downstream accumulation.
“Dense riparian vegetation helps reduce runoff and filter pollutants, while the basin's semi-funnel geomorphology promotes downstream accumulation.”
The paper relies on this without support.
Turbidity and TSS are generally positively correlated.
“Although turbidity and TSS are generally positively correlated, their spatial trends diverge (Fig. 3d, 3g).”
Self-check
Percentages, sums and reported differences re-computed from the paper’s own numbers.
Each contradiction between two passages listed here was confirmed by an independent check.
Rated minor: it would not touch a result — a value no result rests on, a p-value that stays on the same side of the significance level, or a conflict that is clerical, resolved elsewhere in the paper, or outside its own findings.
In the paper
§ GIS-Based Evaluation of Pollution Sources and Water Quality Status in the Turag River, Bangladesh > 3.1. Spatial Mapping of Physicochemical Attributes in the Turag River Water
“Although the measured phosphate levels remained within the DoE standard range (5-8 ppm)”
§ GIS-Based Evaluation of Pollution Sources and Water Quality Status in the Turag River, Bangladesh > 3.1. Spatial Mapping of Physicochemical Attributes in the Turag River Water
“The phosphate content of the tested samples varied from 2.52 to 4.92 ppm”
Citations
Cites
A review of water quality index models and their use for assessing surface water quality
Uddin, M. G., Nash, S., & Olbert, A. I. (2020) · Ecological Indicators · doi:10.1016/j.ecolind.2020.107218 · Cited by 1,375
Water Quality Assessment in Terms of Water Quality Index
Tyagi, S., Sharma, B., Singh, P., & Dobhal, R. (2020) · American Journal of Water Resources · doi:10.12691/ajwr-1-3-3 · Cited by 908
Toxic Cyanobacteria in Water: A Guide to Their Public Health Consequences, Monitoring and Management
Chorus, I., & Welker, M. (2021) · doi:10.1201/9781003081449 · Cited by 643
A Review of Genesis and Evolution of Water Quality Index (WQI) and Some Future Directions
Lumb, A., Sharma, T. C., & Bibeault, J.-F. (2011) · Water Quality Exposure and Health · doi:10.1007/s12403-011-0040-0 · Cited by 505
Sundaray, S. K., Panda, U. C., Nayak, B. B., & Bhatta, D. (2006) · Environmental Geochemistry and Health · doi:10.1007/s10653-005-9001-5 · Cited by 190
Study of the seasonal variations in Turag river water quality parameters
Rahman, A. K. M. L. (2012) · African Journal of Pure and Applied Chemistry · doi:10.5897/ajpac12.023 · Cited by 88
Use of index analysis to evaluate the water quality of a stream receiving industrial effluents
Abrahão, R., Carvalho, M., Silva, W. D., Jr., Machado, T., Gadelha, C. L. M., & Hernández, M. I. M. (2010) · Water SA · doi:10.4314/wsa.v33i4.52940 · Cited by 74
Spatial and temporal characterizations of water quality in Kuwait Bay
Al-Mutairi, N., Abahussain, A. A., & El-Battay, A. (2014) · Marine Pollution Bulletin · doi:10.1016/j.marpolbul.2014.04.009 · Cited by 69
Mishra, A. P., Singh, S., Jani, M., Singh, K. A., Pande, C. B., & Varade, A. M. (2022) · International Journal of Environmental & Analytical Chemistry · doi:10.1080/03067319.2022.2032015 · Cited by 66
Latif, M., Nasir, N., Nawaz, R., Nasim, I., Sultan, K., Irshad, M. A., Irfan, A., Dawoud, T. M. S., Younous, Y. A., Ahmed, Z., et al. (2024) · Scientific Reports · doi:10.1038/s41598-024-63296-1 · Cited by 66
García-Torres, E., Pérez–Morales, R., González‐Zamora, A., Ríos–Sánchez, E., Calderón, E. H. O., Alba-Romero, J. D. J., & Calleros-Rincón, E. Y. (2020) · International Journal of Environmental Health Research · doi:10.1080/09603123.2020.1815664 · Cited by 65
NSF-Water Quality Index: Does It Represent the Experts’ Opinion?
Kumar, D., & Alappat, B. J. (2008) · Practice Periodical of Hazardous Toxic and Radioactive Waste Management · doi:10.1061/(asce)1090-025x(2009)13:1(75 · Cited by 61
WATER QUALITY INDICES - METHODS FOR EVALUATING THE QUALITY OF DRINKING WATER
Paun, I. C., Cruceru, L. V., Chiriac, F. L., Niculescu, M., Vasile, G. G., & Marin, N. M. (2016) · International Symposium 'The Environment and the Industry' (SIMI) · doi:10.21698/simi.2016.0055 · Cited by 61
Pande, C. B., Tolche, A. D., Egbueri, J. C., Sidek, L. M., Singh, R., Mishra, A. P., Agbasi, J. C., Refadah, S. S., Alshehri, F., Khan, M. Y. A., et al. (2025) · Applied Water Science · doi:10.1007/s13201-025-02387-4 · Cited by 57
Das, A. (2024) · Innovative Infrastructure Solutions · doi:10.1007/s41062-024-01780-3 · Cited by 51
Analysis of Physicochemical Properties of the Turag River Water, Tongi, Gazipur in Bangladesh
Mobin, M., Islam, M., Mia, M., & Bakali, B. (2015) · Journal of Environmental Science and Natural Resources · doi:10.3329/jesnr.v7i1.22140 · Cited by 50
Self-citationYasmin, G., Islam, D., Islam, M. T., Shariot-Ullah, M., & Adham, A. K. M. (2018) · Fundamental and applied agriculture · doi:10.5455/faa.301258 · Cited by 34
Self-citationElwood, M., & van der Werf, B. (2022) · Cancer Epidemiology · doi:10.1016/j.canep.2022.102148 · Cited by 30
Zhang, L. (2017) · International Review for Spatial Planning and Sustainable Development · doi:10.14246/irspsd.5.4_4 · Cited by 29
Problems of Using Wastewater on Vegetable Crops
Kirkham, M. B. (1986) · HortScience · doi:10.21273/hortsci.21.1.24 · Cited by 29
Kumar, P. (2018) · Heliyon · doi:10.1016/j.heliyon.2018.e01074 · Cited by 27
Islam, M. T., AKASH, Khatun, M. R., Jahan, N., ISLAM, M. R., PARTHO, D. K., Kibria, M. G., & Adham, A. K. M. (2024) · Results in Engineering · doi:10.1016/j.rineng.2024.103667 · Cited by 27
Self-citationMukherjee, S., & Nelliyat, P. (2007) · SSRN Electronic Journal · doi:10.2139/ssrn.1021153 · Cited by 25
Ghasemian, M., Poursafa, P., Amin, M. M., Ziarati, M., Ghoddousi, H., Momeni, S. A., & Rezaei, A. H. (2012) · Journal of Environmental and Public Health · doi:10.1155/2012/407162 · Cited by 18
Islam, M. T., Das, N., Jahan, N., Siddik, M. S., Mahmud, K., & Adham, A. K. M. (2023) · Archives of Agriculture and Environmental Science · doi:10.26832/24566632.2023.0803017 · Cited by 13
Self-citationDas, N., Rahman, M., Islam, M. T., & Adham, A. (2019) · Fundamental and applied agriculture · doi:10.5455/faa.45057 · Cited by 6
Self-citationJahan, N., Khan, M. B., Ali, M. A., Islam, M. T., & Siddik, M. S. (2020) · Fundamental and applied agriculture · doi:10.5455/faa.129984 · Cited by 4
Self-citationDeRamus, H. A., Clement, T. J., Jeong, C. Y., & Berry, J. C. (2015) · Global Journal of Agricultural Innovation Research & Development · doi:10.15377/2409-9813.2015.02.01.1 · Cited by 3
Survey of the Water Quality of the Bahar County Streams (Iran) by NSFWQI
Habib, A. G., & Khatami, S. H. (2015) · Environment Conservation Journal · doi:10.36953/ecj.2015.se1646 · Cited by 2
Impact of Urban Wastes on Water Quality of Turag River
Sadiqa, H., Al-Amin, M., & Sarker, M. M. H. (2021) · Zenodo (CERN European Organization for Nuclear Research) · doi:10.5281/zenodo.5655205 · Cited by 2
Adham, A. K. M., & Islam, M. T. (2024) · AgroEnvironmental Sustainability · doi:10.59983/s2024020202 · Cited by 2
Self-citationTuli, D. H., Islam, M. T., Jahan, N., Das, N., Rahman, M. M., & Adham, A. K. M. (2024) · Asian Journal of Water Environment and Pollution · doi:10.3233/ajw240076
Self-citation
Research works printed but not linked: 14
- Tahmina B, Sujan D, Karabi R, Hena MKB, Amin KR, Sharmin S. Assessment of surface water quality of the Turag River in Bangladesh. Res J Chem Environ. 2018; 22(2): 49-56.
- Poonam T, Tanushree B, Sukalyan C. Water quality indices-important tools for water quality assessment: A review. Int J Adv Chem. 2013; 1(1): 15-28.
- Uddin HM. Initial environmental impact assessment of the Turag-Buriganga naval transport [master's thesis]. Dhaka: Department of Geography and Environment, Jahangirnagar University; 2005.
- Akoto O, Bruce TN, Darko G. Heavy metals pollution profiles in streams serving the Owabi reservoir. Afr J Environ Sci Technol. 2008; 2(11): 354-59.
- Ahmad MK, Islam S, Rahman S, Haque MR, Islam MM. Heavy metals in water, sediment and some fishes of Buriganga River, Bangladesh. Int J Environ Res. 2010; 4(2): 321-32.
- Ladwani KD, Manik VS, Ramteke DS. Impact of industrial effluent discharge on physico-chemical characteristics of agricultural soil. Int Res J Environ Sci. 2012; 1(3): 32-6.
- Khan SA, Ahammed SS, Rabbani KA, Khaleque MA. Water quality assessment of Turag River using selected parameters. IOSR J Environ Sci Toxicol Food Technol. 2020; 14(1): 61-6.
- Brown RM, McClelland NI, Deininger RA, Tozer RG. A water quality index---Do we dare? Water & Sewage Works. 1970; 117(10): 339-43.
- Lumb A, Sharma TC, Bibeault JF. A review of genesis and evolution of water quality index (WQI) and some future directions. Water Qual Expo Health. 2011; 3: 11-24. https://doi.org/10.1007/s12403-011-0040-0 · DOI
- Rao BK, Panchaksharjah S, Patil BN, Narayana A, Kaiker DLS. Chemical composition of irrigation waters from selected parts of Bijpur district, Karnataka. Mysore J Agric Sci. 1982; 16(4): 426-32.
- Taiwo AM. Environmental impact of poultry farm operations on Alakata stream at Isolu in Abeokuta, Nigeria [master's thesis]. Abeokuta: Department of Environmental Management and Toxicology, University of Agriculture; 2010.
- Shokuhi R, Hosinzadeh E, Roshanaei G, Alipour M, Hoseinzadeh S. Evaluation of Aydughmush Dam reservoir water quality by National Sanitation Foundation Water Quality Index (NSF-WQI) and water quality parameter changes. J Health Environ. 2012; 4(4): 439-50.
- Uddin MG, Nash S, Olbert AI. A review of water quality index models and their use for assessing surface water quality. Ecol Indic. 2021; 122: 1-21. https://doi.org/10.1016/j.ecolind.2020.107218 · DOI
- Meghla NT, Islam MS, Ali MA, Suravi, Sultana N. Assessment of physicochemical properties of water from the Turag River in Dhaka City, Bangladesh. Int J Curr Microbiol Appl Sci. 2013; 2(5): 110-22.
Cited by
Sorted by citations
Olagunju, T. E., Olopade, T., & Mustapha, M. (2026) · African Journal of Aquatic Science · doi:10.2989/16085914.2026.2630907
Metadata
- Authors
- Rony, M. M. H., Islam, M. T., Muyen, Z., Godhuli, M., Sultana, M. N., & Adham, A. K. M.
- Affiliations
- Bangladesh Agricultural University (BD)
- Venue
- The Global Environmental Engineers
- Publisher
- Avanti Publishers
- Published
- 2025-07-02
- Volume
- 12
- Pages
- 5-21
- ISSN
- 2410-3624 (ISSN-L)
- OpenAlex
- W4411939895
- Semantic Scholar
- 6e5f1c191553401038ee9a072f6d2ac3f10a9f40
- Cited by
- 1
- References
- 28
- Citations by year
- 2026: 1
- FWCI
- 0.24
- Type
- journal article
- Language
- en
- Open access
- diamond
- doi.org
- Licence
- Locations
- The Global Environmental Engineers (publishedVersion, cc-by-nc)
- Funders
- Bangladesh Fisheries Research Institute
- Topics
- Physical Sciences › Environmental Science › Water Science and Technology › Water Quality and Pollution Assessment
- Physical Sciences › Environmental Science › Water Science and Technology › Water Quality and Resources Studies
- Physical Sciences › Environmental Science › Water Science and Technology › Environmental Science and Water Management
- Keywords
- Turag River, river water quality, pollution sources, water quality index, industrial wastewater, pharmaceutical pollution, textile mill effluent, biochemical oxygen demand, turbidity, dissolved oxygen, total suspended solids, phosphate, nitrate, watershed management, pollution control
About these checks
Registry, retraction, Cites and statistics results are computed, not judged, with one exception: a printed reference that no index lists is read once by a model before it counts as a citation error. Claims are extracted by a model and kept only when their quote appears verbatim in the text; each cited source is then checked, with a model’s help, for whether it says what the claim relies on. Those verdicts can be wrong — read the claim’s quote and the cited source before relying on one.
A language model drew the claims from the paper on 2026-11-08, under version 3 of the claim definition (model deepseek-v4.1-flash, prompt extract-v3).
A second model labelled each claim on 2026-11-08 (model jev-1.13-20260917, definition revision gold-guideline-v0.2).
Statistics and arithmetic are recomputed, not judged.
Confidence bands are shown only for fields calibrated on our annotated test set. None is calibrated yet, so no band is shown.
What counts as a claim ›How we measure confidence ›How we check this ›
Are you an author, or do you see a problem with this page? Request a review
