

The DOI matches its Crossref record; 29 of the 31 references it cites were found in a registry or an index.
Socioeconomic factors increase the risk of teenage pregnancy: spatial and temporal analysis in a Brazilian municipality
Open accessAbstract
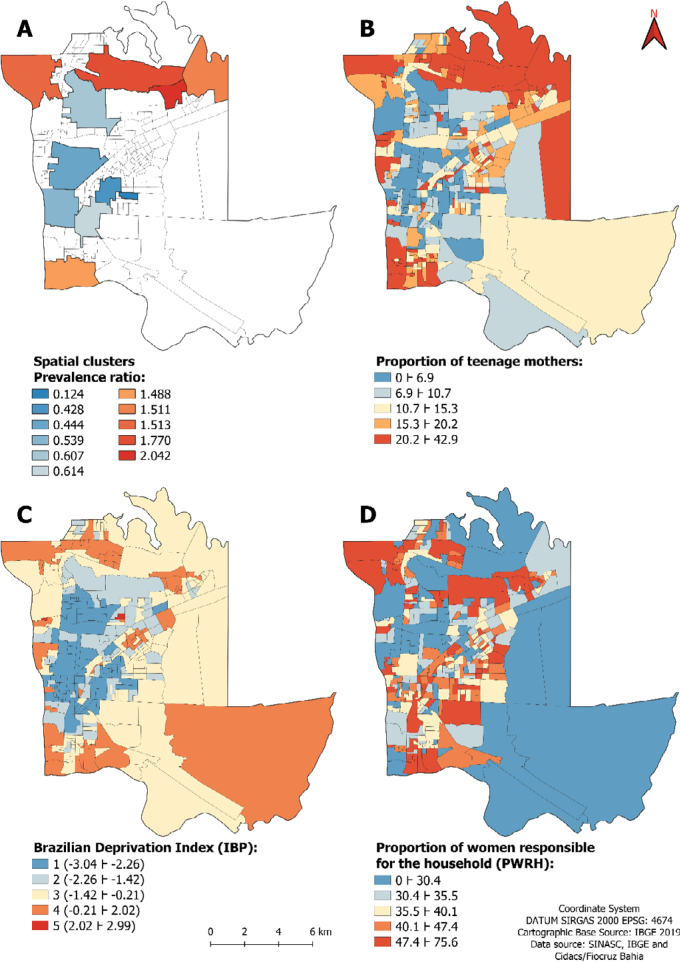
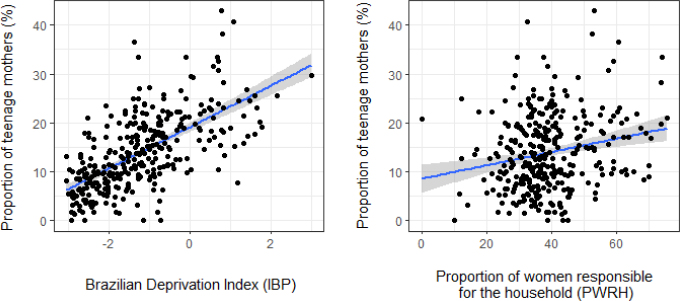
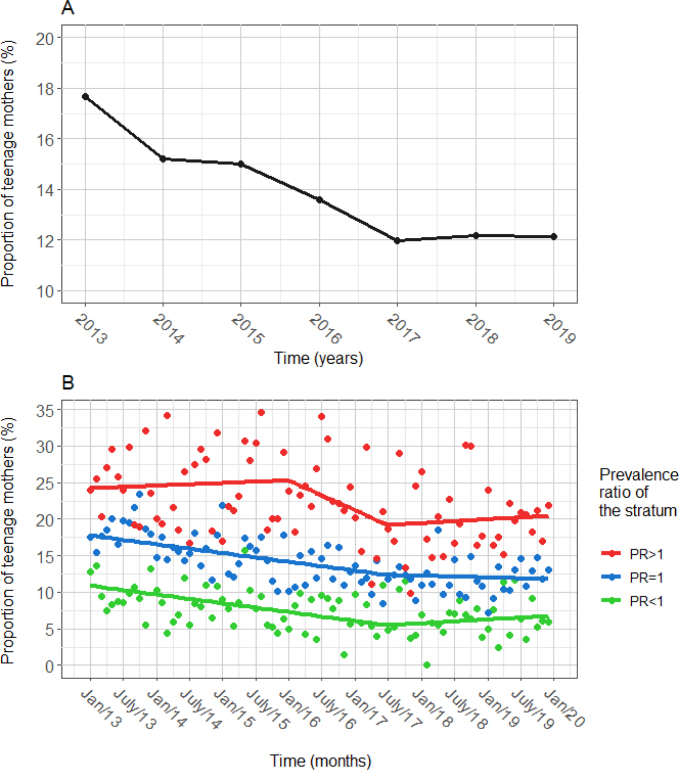
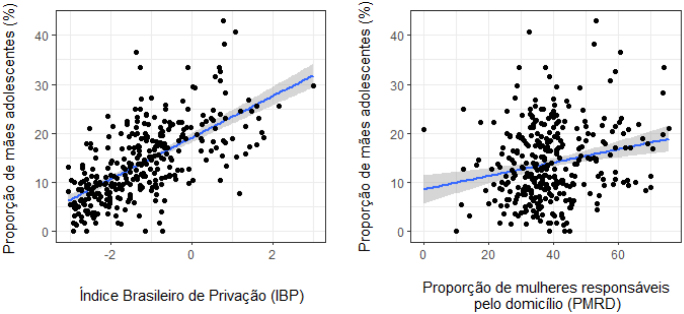
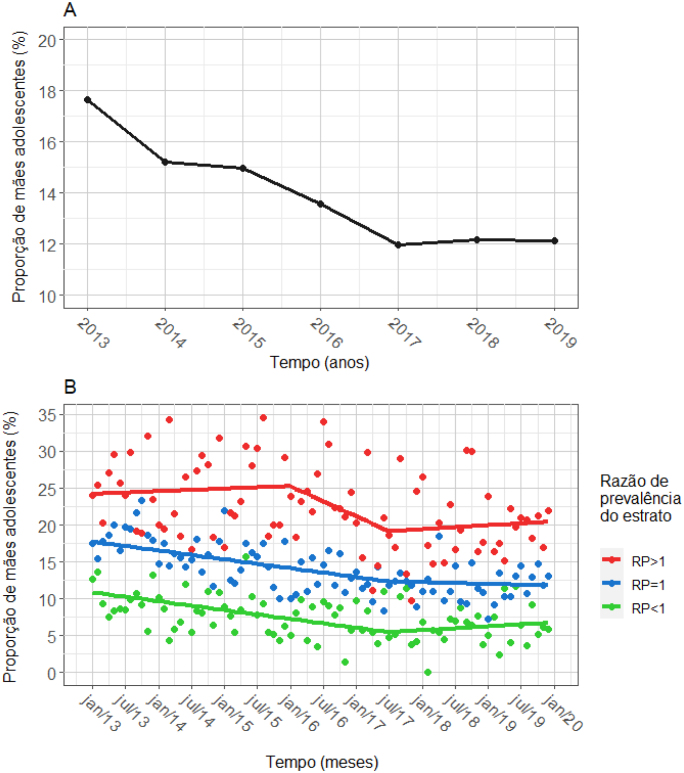
ABSTRACT Objective: To evaluate the distribution of the proportion of teenage mothers (PTM) in time and space and its relationship with socioeconomic indicators and social vulnerability. Methods: An ecological study was carried out with teenage mothers living in 322 census tracts in Foz do Iguaçu (state of Paraná, Brazil) between 2013 and 2019. Spatial clusters of teenage mothers were identified by spatial scanning and grouped into strata with different prevalence. The association between these strata and the individual social vulnerability of the mothers was evaluated using the Pearson's Chi-square test. Linear regression models were adjusted to evaluate the association between PTM and socioeconomic factors by census tract and temporal trend in PTM in different strata. Results: We identified five high prevalence clusters in peripheral regions and six with low prevalence in the central region of the municipality. Proportionally, there were more teenage mothers with a worse vulnerability index in the high prevalence stratum than in the low prevalence stratum. Places with worse socioeconomic conditions present higher PTM, a profile that did not change over time. For the increase of one unit in the Brazilian Deprivation Index and proportion of women responsible for the household, the PTM increased, respectively, by 3.8 (95%CI 3.1–4.4) and 0.086% (95%CI 0.03–0.14). There was a reduction in the global PTM in part of the period, which occurred later in the higher prevalence strata, but the proportions were stable again in the last years of study. Conclusion: Teenage pregnancy is concentrated in regions with worse socioeconomic conditions and greater maternal vulnerability and its behavior over time occurred differently in these areas.
Overview
The claims and statistics of this paper haven’t been checked yet.
Run the check — free, no account needed. It reads the open-access text and checks the sources it cites.
Integrity signals
Registry
Cites
Statistics
Figures
Verification
Claims the paper makes
The claims and statistics of this paper haven’t been checked yet.
Run the check — free, no account needed. It reads the open-access text and checks the sources it cites.
Claims other papers make about this one
Each is checked against this paper’s own text: does it say what the citing paper says it does?
The cited source says what the claim attributes to it.
In the citing paper
“Structural inequalities—including limited access to comprehensive sexual education, contraceptive services [11], and economic opportunities—shape both the likelihood of adolescent pregnancy and the resources available for navigating early motherhood [12].”
From Motherhood in adolescence: a qualitative study of the lived experience of participants in a perinatal home-visiting intervention (2026) · cites this paper as [12]
Self-check
Percentages, sums and reported differences re-computed from the paper’s own numbers.
The self-check needs the paper’s full text.
Citations
Cites
Classical and Modern Regression With Applications.
Steinhorst, R. K., & Myers, R. H. (1988) · Journal of the American Statistical Association · doi:10.2307/2288958 · Cited by 3,691
do Carmo, M. E., & Guizardi, F. L. (2018) · Cadernos de Saúde Pública · doi:10.1590/0102-311x00101417 · Cited by 385
The State of Adolescent Sexual and Reproductive Health
Liang, M., Simelane, S., Fillo, G. F., Chalasani, S., Weny, K., Canelos, P. S., Jenkins, L., Moller, A., Chandra‐Mouli, V., Say, L., et al. (2019) · Journal of Adolescent Health · doi:10.1016/j.jadohealth.2019.09.015 · Cited by 347
Maternal mortality in adolescents compared with women of other ages: evidence from 144 countries
Nove, A., Matthews, Z., Neal, S., & Camacho, A. V. (2014) · The Lancet Global Health · doi:10.1016/s2214-109x(13)70179-7 · Cited by 344
Risk Factors and Birth Outcomes Associated with Teenage Pregnancy: A Canadian Sample
Wong, S. P. W., Twynstra, J., Gilliland, J., Cook, J. L., & Seabrook, J. A. (2019) · Journal of Pediatric and Adolescent Gynecology · doi:10.1016/j.jpag.2019.10.006 · Cited by 158
Using Gini coefficient to determining optimal cluster reporting sizes for spatial scan statistics
Han, J., Zhu, L., Kulldorff, M., Hostovich, S., Stinchcomb, D. G., Tatalovich, Z., Lewis, D. R., & Feuer, E. J. (2016) · International Journal of Health Geographics · doi:10.1186/s12942-016-0056-6 · Cited by 154
Análise de dados espaciais em saúde pública: métodos, problemas, perspectivas
Carvalho, M. S., & Souza‐Santos, R. (2005) · Cadernos de Saúde Pública · doi:10.1590/s0102-311x2005000200003 · Cited by 150
Santelli, J. S., Song, X., Garbers, S., Sharma, V., & Viner, R. (2016) · Journal of Adolescent Health · doi:10.1016/j.jadohealth.2016.08.026 · Cited by 78
Martínez, E. Z., da Roza, D. L., Guimarães, M. D. C. M., Achcar, J. A., & Dal-Fabbro, A. L. (2011) · Cadernos de Saúde Pública · doi:10.1590/s0102-311x2011000500004 · Cited by 75
Teenage Pregnancy: Obstetric and Perinatal Outcome in a Tertiary Centre in Indonesia
Indarti, J., Fattah, A. N. A., Dewi, Z., Hasani, R. D. K., Mahdi, F. A. N., & Surya, R. (2020) · Obstetrics and Gynecology International · doi:10.1155/2020/2787602 · Cited by 67
Cited by
Chiang, S. S., Campbell, J. R., Pelissari, D. M., de Oliveira, M. C. B., Carvalho, A. C. C., LaCourse, S. M., & Sant’Anna, C. C. (2025) · Clinical Infectious Diseases · doi:10.1093/cid/ciaf233 · Cited by 6
Ortiz, D. A., Dundas, R., Olsen, J., Ster, I. C., & SEDHI Project (2026) · International Journal for Population Data Science · doi:10.23889/ijpds.v10i3.2970 · Cited by 1
Chou, D. T., Neto, E. A., Fracolli, L. A., Fatori, D., Becker, N., Caye, A., Soares, V. N., Osorio, A. A. C., Guimarães-Fernandes, F., Polanczyk, G. V., et al. (2026) · Child and Adolescent Psychiatry and Mental Health · doi:10.1186/s13034-026-01039-y
de Morais, M. F. S., de Lima, M. V. P., Costa, J. R., Orsi, A. L., Furlanetto, C. P., Bueno, L. M. M. R., Sousa, D. D. R., D’Alessandro, A. A. B., & Herrera, S. D. S. C. (2025) · Contribuciones a las Ciencias Sociales · doi:10.55905/revconv.18n.6-189
Factores sociales y biológicos en las complicaciones obstétricas de gestantes adolescentes
Quijije, E. M. M., Velásquez, M. G., Reina, R. M. C., & López, D. A. D. (2025) · Revista Científica Arbitrada Multidisciplinaria PENTACIENCIAS · doi:10.59169/pentaciencias.v7i4.1595
A influência dos fatores socioeconômicos na incidência da gravidez na adolescência
Pereira, D. A. C., Cirilo, T. D. S., Monteiro, J. M. D. S., de Souza, M. P., & Bezerra, A. M. F. (2025) · Revista Coopex · doi:10.61223/coopex.v16i02.6748
REPERCUSSÕES DA GRAVIDEZ E DO PUERPÉRIO NA SAÚDE MENTAL DE MÃES ADOLESCENTES
dos Santos, K. C. B., Teixeira, A. L. M., Araújo, M. S. M., & dos Santos, J. F. (2026) · Revista Multidisciplinar do Nordeste Mineiro · doi:10.61164/q03tny94
Baykemagn, N. D., Gebiru, A. M., Getnet, M., Mengistie, B. A., Getahun, A. B., Asmamaw, D. B., Tassew, W. C., Tilahun, M. M., Bizuneh, Y. B., Bitew, D. A., et al. (2026) · Scientific Reports · doi:10.1038/s41598-026-43004-x
Conceição, G. M. D. S., Bermudi, P. M. M., Palasio, R. G. S., Barbosa, G. L., Fernandes, C. M., Santana, L. M. R., Barrozo, L. V., da Roza, D. L., Quintanilha, J. A., & Neto, F. C. (2026) · Revista Brasileira de Epidemiologia · doi:10.1590/1980-549720260018
Self-citationRangel, A. U. M., Frota, M. A., Pinto, N. V., Domeneguetti, J. C., Martins, M. C., Albuquerque, M. E. D. P., & Brilhante, A. V. M. (2026) · Revista Multidisciplinar do Nordeste Mineiro · doi:10.66104/qhdgar15
Rocha, M. F., Figueredo, A. S., Marques, M. C. P., de Andrade, Y. N. L., dos Santos, L. O., Firmo, W. D. C. A., & Austríaco-Teixeira, P. (2026) · Journal of Law and Sustainable Development · doi:10.55908/sdgs.v14i7.4680
Conhecimento e valoração de conceitos bioéticos entre adolescentes
de Oliveira, A. F., de Oliveira, E. F., Duarte, I., & Nunes, R. (2026) · Revista Bioética · doi:10.1590/1983-803420264079pt
Knowledge and valuation of bioethical concepts among adolescents
de Oliveira, A. F., de Oliveira, E. F., Duarte, I., & Nunes, R. (2026) · Revista Bioética · doi:10.1590/1983-803420264079en
Conocimiento y valoración de conceptos bioéticos entre adolescentes
de Oliveira, A. F., de Oliveira, E. F., Duarte, I., & Nunes, R. (2026) · Revista Bioética · doi:10.1590/1983-803420264079es
Rosaneli, C. F., Gomes, M. E., Gonçalves, L. S., & Karasinski, M. (2026) · Revista Inclusiones · doi:10.58210/rie3883
de Souza, B. N., & CASTRO, A. A. D. D. S. (2026) · REVISTA MULTIDISCIPLINAR INTEGRADA - REMI · doi:10.61164/ej47xd94
de Paula, M. E. R., & Martins, M. D. N. R. P. (2026) · Pará Research Medical Journal · doi:10.5327/prmj.1036
Adolescent Pregnancy and Perinatal Outcomes: A Hospital‐Based Cross‐Sectional Study
Simplício, A. C. P., Fonseca, A. L. H., Camargo, J. D. D. A. S., de Souza, A. T. B., de Freitas, G. S. O., Freitas, R. A. S. D. O., Cobucci, R. N., Camargo, S. F., & Freitas, A. K. M. S. D. O. (2026) · Paediatric and Perinatal Epidemiology · doi:10.1111/ppe.70210
Fenomena Kejadian Kehamilan Berisiko Berdasarkan Faktor Layanan Kesehatan dan Pendampingan Suami
Akbariandi, R., & Fauzi, L. (2025) · HIGEIA (Journal of Public Health Research and Development) · doi:10.15294/higeia.v9i2.21745
Parrales-Pincay, I. G., Chávez, L. C. L., & Anchundia-Piloso, M. N. (2026) · Innova Science Journal · doi:10.63618/omd/isj/v4/n4/438
Qualidade da assistência pré-natal em comunidades ribeirinhas da Amazônia brasileira
do Nascimento, E. S., da Silva, A. L. C., Parreira, B. D. M., Silva, M. M. D. J., Barbosa, N. G., Faisal‐Cury, A., & Gomes-Sponholz, F. A. (2026) · Revista Brasileira de Enfermagem · doi:10.1590/0034-7167-2025-0204pt
Quality of prenatal care in riverside communities of the Brazilian Amazon
do Nascimento, E. S., da Silva, A. L. C., Parreira, B. D. M., Silva, M. M. D. J., Barbosa, N. G., Faisal‐Cury, A., & Gomes-Sponholz, F. A. (2026) · Revista Brasileira de Enfermagem · doi:10.1590/0034-7167-2025-0204
Metadata
- Authors
- Fernandes, C. M., Conceição, G. M. D. S., Silva, Z. P. D., Nampo, F. K., & Chiaravalloti Neto, F.
- Affiliations
- Universidade de São Paulo (BR)
- Universidade de São Paulo, Brazil
- Universidade Federal da Integração Latino-Americana (BR)
- Corresponding author
- Fernandes, Camila Meireles
- ORCID
- Venue
- Revista Brasileira de Epidemiologia
- Publisher
- FapUNIFESP (SciELO)
- Published
- 2024
- Volume
- 27
- Pages
- e240040-e240040
- ISSN
- 1415-790X (ISSN-L)
- 1980-5497
- PMC
- PMC11290768
- OpenAlex
- W4401088370
- Cited by
- 16
- References
- 31
- Citations by year
- 2026: 11 · 2025: 5
- FWCI
- 7.59
- Type
- journal article
- Language
- en
- Open access
- diamond
- doi.org
- Licence
- Locations
- Revista Brasileira de Epidemiologia (publishedVersion, cc-by)
- PubMed Central (publishedVersion, cc-by)
- PubMed (publishedVersion)
- DOAJ (DOAJ: Directory of Open Access Journals) (submittedVersion)
- Topics
- Health Sciences › Medicine › Public Health, Environmental and Occupational Health › Adolescent Sexual and Reproductive Health
- Health Sciences › Medicine › Public Health, Environmental and Occupational Health › Reproductive Health and Contraception
- Health Sciences › Medicine › Public Health, Environmental and Occupational Health › Adolescent Health and Behaviors
- Keywords
- adolescent pregnancy, adolescent mothers, socioeconomic factors, social vulnerability, spatial clustering, temporal trends, Foz do Iguaçu
- MeSH terms
- Social Vulnerability, Adolescent, Brazil, Female, Humans, Pregnancy, Pregnancy in Adolescence, Residence Characteristics, Risk Factors, Socioeconomic Factors, Time Factors, Prevalence, Young Adult, Spatio-Temporal Analysis
About these checks
Registry, retraction, Cites and statistics results are computed, not judged, with one exception: a printed reference that no index lists is read once by a model before it counts as a citation error. Claims are extracted by a model and kept only when their quote appears verbatim in the text; each cited source is then checked, with a model’s help, for whether it says what the claim relies on. Those verdicts can be wrong — read the claim’s quote and the cited source before relying on one.
Statistics and arithmetic are recomputed, not judged.
Confidence bands are shown only for fields calibrated on our annotated test set. None is calibrated yet, so no band is shown.
What counts as a claim ›How we measure confidence ›How we check this ›
Are you an author, or do you see a problem with this page? Request a review
Data sources
Bibliographic data: Semantic Scholar, OpenAlex, Crossref.
Contains information from the Semantic Scholar Academic Graph Datasets, made available under the ODC Attribution License (ODC-BY 1.0).
Semantic Scholar’s data is described in: Kinney, R., et al. (2023). The Semantic Scholar Open Data Platform. arXiv:2301.10140.
