PreprintCited by 13S100 Proteins and AnnexinsBiomarkers in Disease MechanismsCytokine Signaling Pathways and Interactions

The DOI matches its Crossref record; 1 of the 1 references it cites were found in a registry or an index.

Binding of Specific S100 Proteins Inhibits Activity of Tumor Necrosis Factor

Open access
Kazakov, Alexey S., Zemskova, Marina Y., Rystsov, Gleb K., Vologzhannikova, Alisa A., Deryusheva, Evgenia I., Rastrygina, Victoria A., Sokolov, Andrey S., Permyakova, Maria E., Litus, Ekaterina A., Uversky, Vladimir N., Permyakov, Eugene A., Permyakov, Sergei E.·2022·International Journal of Molecular Sciences

Preprint — published as 10.3390/ijms232415956 · Paper page

Abstract

Tumor necrosis factor (TNF) inhibitors (anti-TNFs) represent a cornerstone of the treatment of various immune-mediated inflammatory diseases and are among the most commercially successful therapeutic agents. Knowledge of TNF binding partners is critical for identification of the factors able to affect clinical efficacy of the anti-TNFs. Here we report that among eighteen representatives of the multifunctional S100 protein family only S100A11, S100A12 and S100A13 interact with the soluble form of TNF (sTNF) in vitro. The lowest equilibrium dissociation constants (Kd) for the complexes with monomeric sTNF determined using surface plasmon resonance spectroscopy range from 2 nM to 28 nM. The apparent Kd values for the complexes of multimeric sTNF with S100A11/A12 estimated from fluorimetric titrations are 0.1-0.3 µM. S100A12/A13 suppress the cytotoxic activity of sTNF against Huh-7 cells, as evidenced by the MTT assay. Structural modeling indicates that the sTNF-S100 interactions may interfere with the sTNF recognition by the therapeutic anti-TNFs. Bioinformatic analysis reveals dysregulation of TNF and S100A11/A12/A13 in numerous disorders. Overall, we have shown a novel potential regulatory role of the extracellular forms of specific S100 proteins that may affect efficacy of anti-TNF treatment in various diseases.

Overview

The claims and statistics of this paper haven’t been checked yet.

Run the check — free, no account needed. It reads the open-access text and checks the sources it cites.

A few free checks a day · papers already verified open instantly · results are public

Integrity signals

Registry

Crossref · 10.20944/preprints202211.0313.v1

Cites

1 of 1 references verified0 citation errors · 0 not checkable

Statistics

Figures

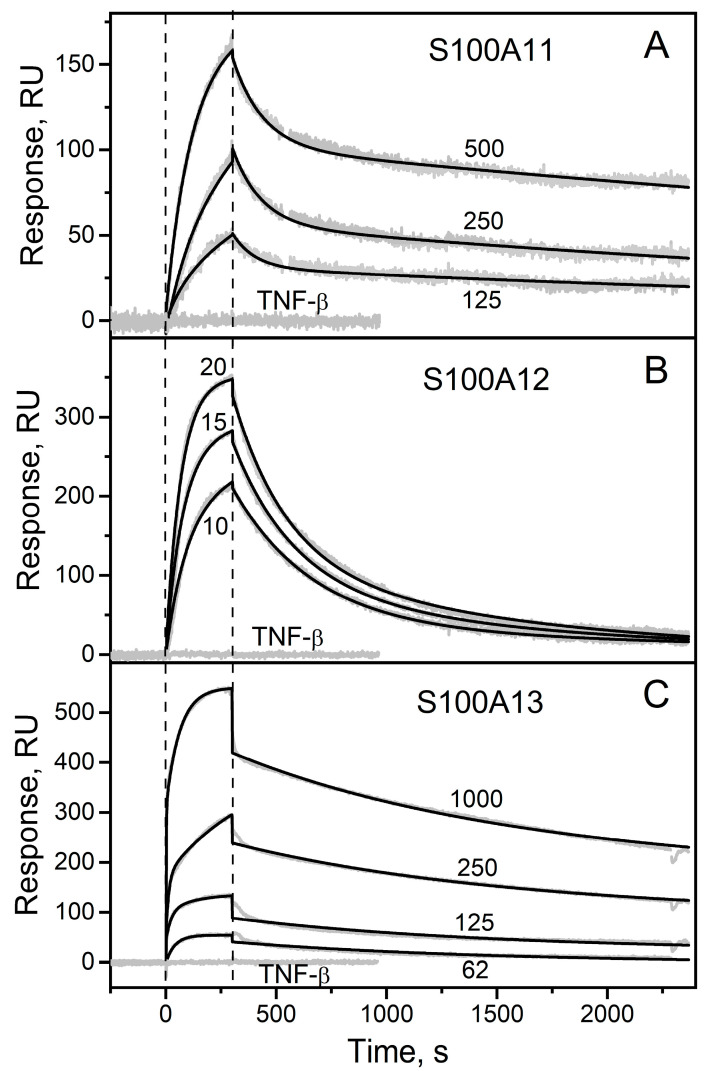
Figure 1 Kinetics of the interaction of sTNF with Ca2+-loaded proteins S100A11 (panel (A)), S100A12 (B) or S100A13 (C) at 25 °C, monitored by SPR spectroscopy (10 mM HEPES, 150 mM NaCl, 1 mM CaCl2, 0.05% TWEEN 20, pH 7.4). sTNF is immobilized on the sensor chip surface by amine coupling. The S100 protein concentrations in nM are indicated for the sensograms. The sensograms for TNF-β used as a ligand and S100 protein concentration of 2 µM are shown. The grey curves are experimental, while the black curves are calculated according to the heterogeneous ligand model (see Section 3.2) (see Table 1). The vertical dotted lines mark the association phase, followed by the dissociation phase.
Figure 1 Kinetics of the interaction of sTNF with Ca2+-loaded proteins S100A11 (panel (A)), S100A12 (B) or S100A13 (C) at 25 °C, monitored by SPR spectroscopy (10 mM HEPES, 150 mM NaCl, 1 mM CaCl2, 0.05% TWEEN 20, pH 7.4). sTNF is immobilized on the sensor chip surface by amine coupling. The S100 protein concentrations in nM are indicated for the sensograms. The sensograms for TNF-β used as a ligand and S100 protein concentration of 2 µM are shown. The grey curves are experimental, while the black curves are calculated according to the heterogeneous ligand model (see Section 3.2) (see Table 1). The vertical dotted lines mark the association phase, followed by the dissociation phase.CC BY · PubMed Central
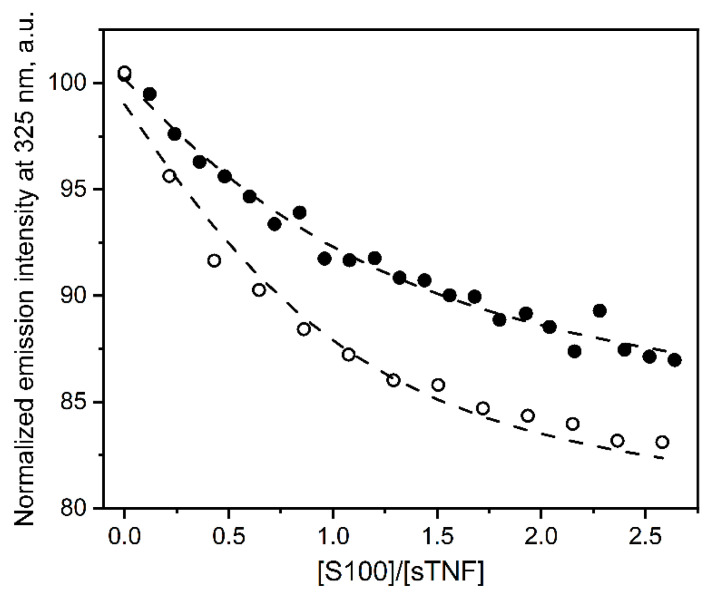
Figure 2 The interaction of sTNF with Ca2+-bound S100A11 (open circles) or S100A12 (solid circles) at 25 °C, followed by fluorescence emission of Trp residues of sTNF (10 mM HEPES-NaOH, 150 mM NaCl, 1 mM CaCl2, pH 7.4). sTNF concentration of 280 nM or 0.5 µM for the titrations by S100A11 and S100A12, respectively. The excitation wavelength was 295/298 nm. The circles denote the experimental data, while the dashed curves are fits according to a single site binding model.
Figure 2 The interaction of sTNF with Ca2+-bound S100A11 (open circles) or S100A12 (solid circles) at 25 °C, followed by fluorescence emission of Trp residues of sTNF (10 mM HEPES-NaOH, 150 mM NaCl, 1 mM CaCl2, pH 7.4). sTNF concentration of 280 nM or 0.5 µM for the titrations by S100A11 and S100A12, respectively. The excitation wavelength was 295/298 nm. The circles denote the experimental data, while the dashed curves are fits according to a single site binding model.CC BY · PubMed Central
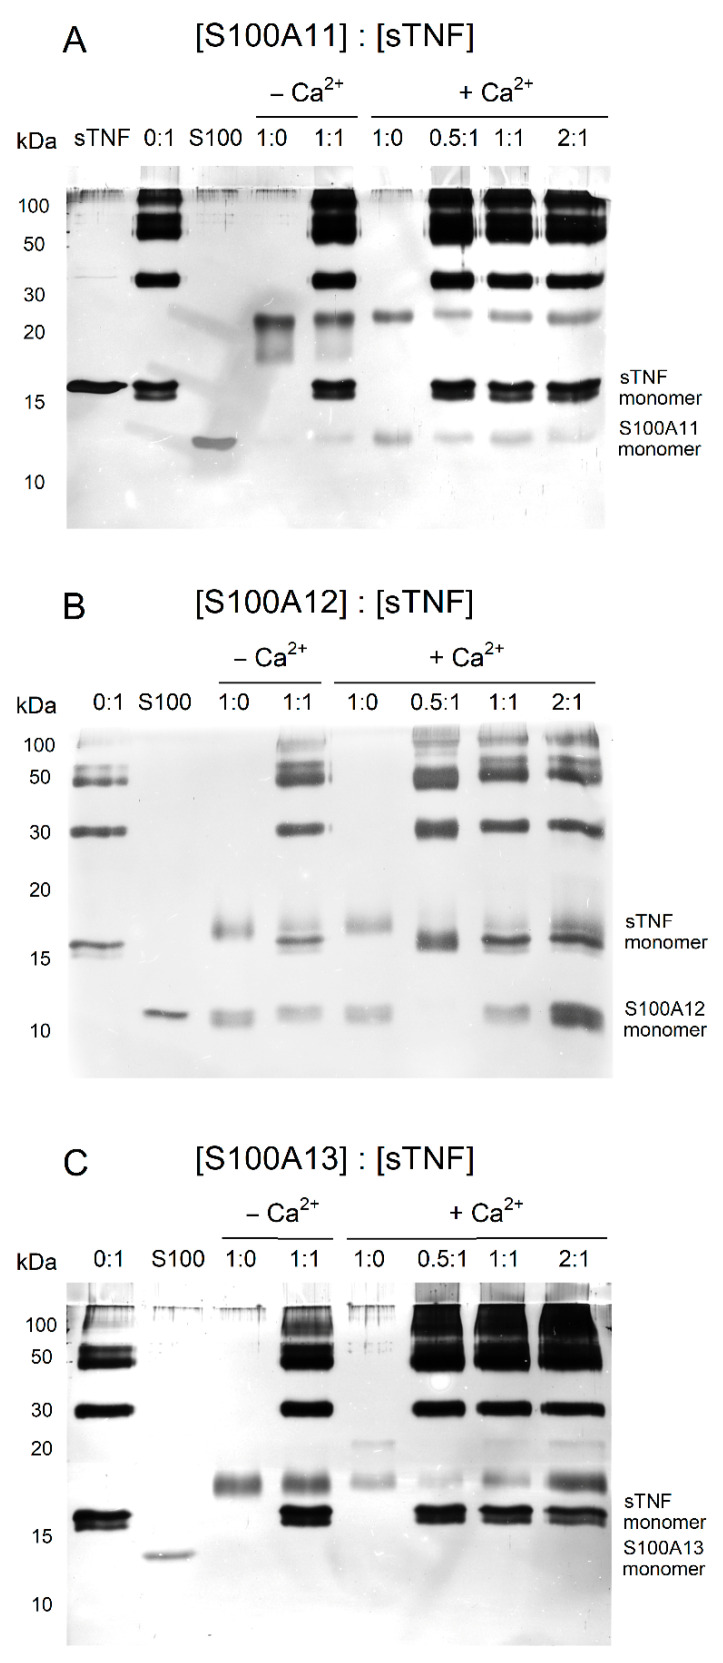
Figure 3 The results of SDS-PAGE for 4 µM sTNF with S100A11 (panel (A)), S100A12 (B) or S100A13 (C) (S100 to sTNF molar ratios are indicated), after crosslinking with EDAC/sulfo-NHS at 25 °C for 1.5 h (10 mM HEPES, 150 mM NaCl, pH 7.4 buffer with/without 1 mM CaCl2). The control lanes for the proteins without crosslinking are marked as ‘sTNF’ and ‘S100’.
Figure 3 The results of SDS-PAGE for 4 µM sTNF with S100A11 (panel (A)), S100A12 (B) or S100A13 (C) (S100 to sTNF molar ratios are indicated), after crosslinking with EDAC/sulfo-NHS at 25 °C for 1.5 h (10 mM HEPES, 150 mM NaCl, pH 7.4 buffer with/without 1 mM CaCl2). The control lanes for the proteins without crosslinking are marked as ‘sTNF’ and ‘S100’.CC BY · PubMed Central
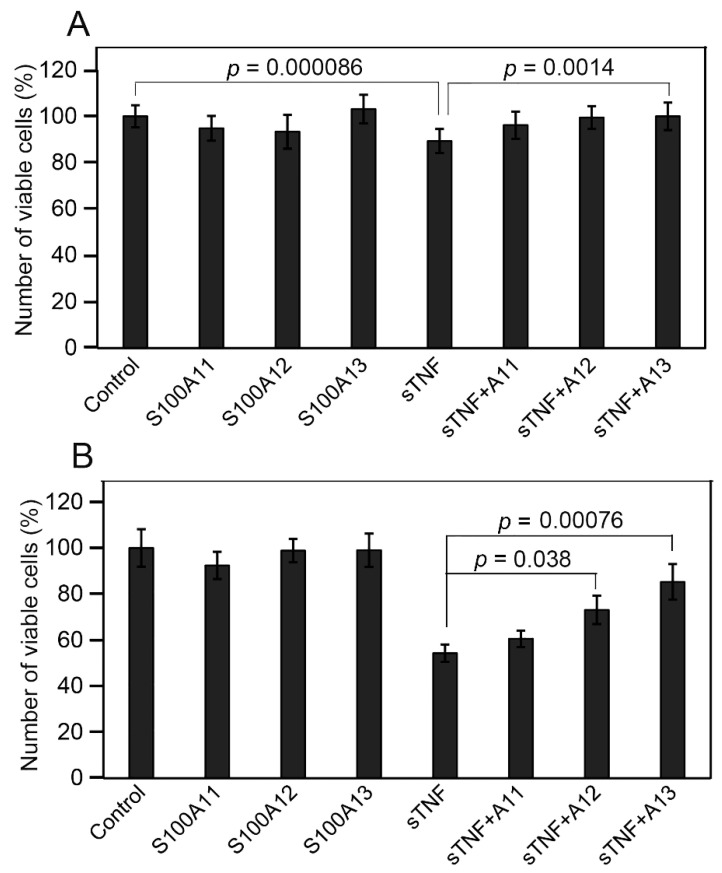
Figure 4 The effect of extracellular sTNF/S100A11/A12/A13 (6 nM and 9 nM for sTNF and S100, respectively) and their combinations on the viability of Huh-7 cells, measured by MTT assay. The untreated cells served as a control. (A) The cells were cultured with the S100 proteins either in the absence or presence of sTNF, as indicated. (B) The same experiments performed in the presence of 10 µg/mL CHX to block the sTNF-induced survival pathways. The data represent the mean values from at least four independent experiments performed in quadruplicates. The errors correspond to standard deviations. The p-values were calculated according to Student’s t-test.
Figure 4 The effect of extracellular sTNF/S100A11/A12/A13 (6 nM and 9 nM for sTNF and S100, respectively) and their combinations on the viability of Huh-7 cells, measured by MTT assay. The untreated cells served as a control. (A) The cells were cultured with the S100 proteins either in the absence or presence of sTNF, as indicated. (B) The same experiments performed in the presence of 10 µg/mL CHX to block the sTNF-induced survival pathways. The data represent the mean values from at least four independent experiments performed in quadruplicates. The errors correspond to standard deviations. The p-values were calculated according to Student’s t-test.CC BY · PubMed Central
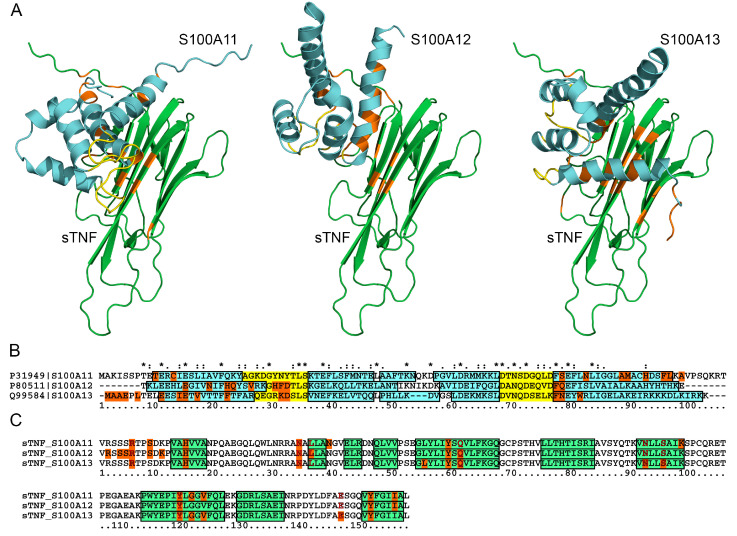
Figure 5 (A) The models of quaternary structures of the complexes between monomeric sTNF (taken from PDB [83] entry 3WD5; shown in green) and S100A11/A12/A13 monomer (predicted using AlphaFold [84]; shown in cyan), built using the ClusPro docking server [81]. The Ca2+-binding loops and the contact residues are shown in yellow and orange, respectively. The same color scheme is used in the panels (B,C). (B) Mapping of the predicted contact residues of the S100 proteins onto their aligned amino acid sequence (Clustal Omega algorithm [85]). The helical regions are marked by the cyan boxes. The identical and similar residues are marked with “*” and “.”/”:”, respectively. (C) The predicted contact residues of sTNF for its complexes with S100A11/A12/A13. The beta strands are marked by the green boxes according to PDB entry 3WD5. The contact residues of sTNF involved in interaction with Adalimumab Fab fragment (PDB entry 3WD5) or Infliximab Fab fragments (PDB entry 4G3Y) are highlighted in bold red.
Figure 5 (A) The models of quaternary structures of the complexes between monomeric sTNF (taken from PDB [83] entry 3WD5; shown in green) and S100A11/A12/A13 monomer (predicted using AlphaFold [84]; shown in cyan), built using the ClusPro docking server [81]. The Ca2+-binding loops and the contact residues are shown in yellow and orange, respectively. The same color scheme is used in the panels (B,C). (B) Mapping of the predicted contact residues of the S100 proteins onto their aligned amino acid sequence (Clustal Omega algorithm [85]). The helical regions are marked by the cyan boxes. The identical and similar residues are marked with “*” and “.”/”:”, respectively. (C) The predicted contact residues of sTNF for its complexes with S100A11/A12/A13. The beta strands are marked by the green boxes according to PDB entry 3WD5. The contact residues of sTNF involved in interaction with Adalimumab Fab fragment (PDB entry 3WD5) or Infliximab Fab fragments (PDB entry 4G3Y) are highlighted in bold red.CC BY · PubMed Central

Verification

Claims the paper makes

The claims and statistics of this paper haven’t been checked yet.

Run the check — free, no account needed. It reads the open-access text and checks the sources it cites.

A few free checks a day · papers already verified open instantly · results are public

Self-check

Percentages, sums and reported differences re-computed from the paper’s own numbers.

The self-check needs the paper’s full text.

Citations

Cites

Metadata

Authors
Kazakov, A. S., Zemskova, M. Y., Rystsov, G. K., Vologzhannikova, A. A., Deryusheva, E. I., Rastrygina, V. A., Sokolov, A. S., Permyakova, M. E., Litus, E. A., Uversky, V. N., Permyakov, E. A., & Permyakov, S. E.
Affiliations
  • Russian Academy of Sciences (RU)
  • University of South Florida (US)
Corresponding author
  • Uversky, Vladimir N.
  • Permyakov, Sergei E.
Venue
International Journal of Molecular Sciences
Publisher
MDPI AG
Published
2022-11-16
Volume
23
Issue
24
Pages
15956-15956
ISSN
1422-0067 (ISSN-L)
OpenAlex
W4311788100
Cited by
13
References
1
Citations by year
2026: 5 · 2025: 2 · 2024: 3 · 2023: 2 · 2022: 1
FWCI
0.65
Type
journal article
Language
en
Open access
Locations
  • International Journal of Molecular Sciences (publishedVersion, cc-by)
  • Preprints.org (acceptedVersion, cc-by)
  • PubMed Central (publishedVersion, cc-by)
  • PubMed (publishedVersion)
  • Digital Commons - University of South Florida (University of South Florida) (submittedVersion, cc-by)
  • DOAJ (DOAJ: Directory of Open Access Journals) (submittedVersion, cc-by-sa)
Funders
Russian Science Foundation (№19-14-00289)
Topics
  • Life Sciences › Biochemistry, Genetics and Molecular Biology › Molecular Biology › S100 Proteins and Annexins
  • Life Sciences › Immunology and Microbiology › Immunology › Biomarkers in Disease Mechanisms
  • Life Sciences › Immunology and Microbiology › Immunology › Cytokine Signaling Pathways and Interactions
Keywords
S-100 protein, S100A11, S100A12, S100A13, TNF-α, soluble TNF, TNF-alpha inhibitors, anti-TNF therapy, protein-protein interaction, Huh7 cells, immune-mediated inflammatory diseases
MeSH terms
S100A12 Protein, Tumor Necrosis Factor Inhibitors, S100 Proteins, Tumor Necrosis Factor-alpha, Receptors, Tumor Necrosis Factor

About these checks

Registry, retraction, Cites and statistics results are computed, not judged, with one exception: a printed reference that no index lists is read once by a model before it counts as a citation error. Claims are extracted by a model and kept only when their quote appears verbatim in the text; each cited source is then checked, with a model’s help, for whether it says what the claim relies on. Those verdicts can be wrong — read the claim’s quote and the cited source before relying on one.

Statistics and arithmetic are recomputed, not judged.

Confidence bands are shown only for fields calibrated on our annotated test set. None is calibrated yet, so no band is shown.

What counts as a claim ›How we measure confidence ›How we check this ›

Are you an author, or do you see a problem with this page? Request a review