

The DOI matches its Crossref record; 1 of the 1 references it cites were found in a registry or an index.
A Shortcut From Genome to Drug: The Employment of Bioinformatic Tools to Find New Targets for Gastric Cancer Treatment
Open accessPreprint — published as 10.3390/pharmaceutics15092303 · Paper page
Abstract
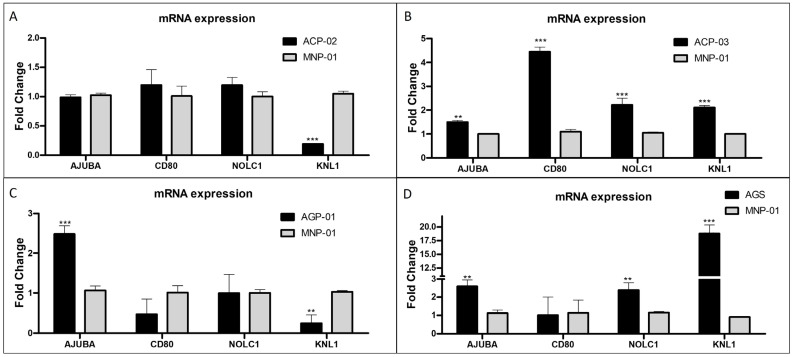
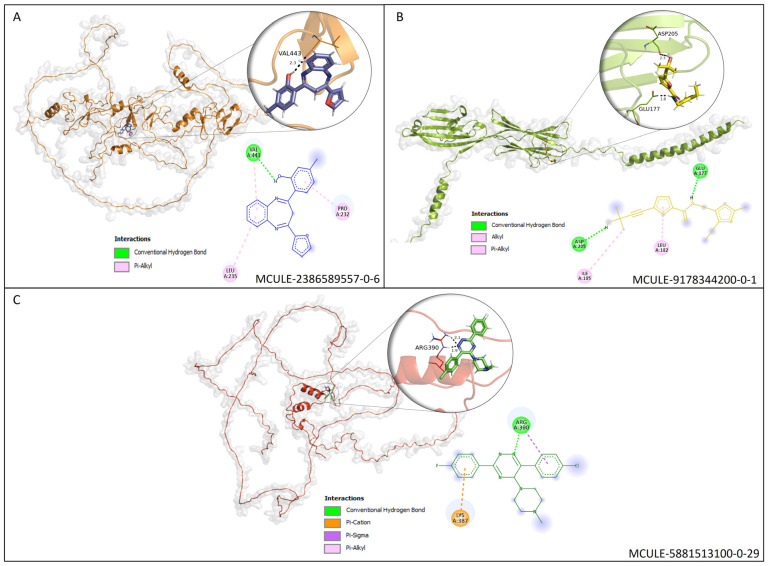
Gastric cancer (GC) is a highly heterogeneous, complex disease and the fifth most common cancer worldwide (about one million cases and 784 000 deaths worldwide in 2018). CG is lately diagnosed and guarantees a poor prognosis for GC (the 5-year survival rate is less than 20%, but in early detection can reach 90%). This study evaluated the transcriptional profile in tumor gastric samples to find genes highly expressed during tumor establishment and use the related proteins as targets to find new anticancer molecules. Data was collected at Gene Expression Omnibus (GEO) bank to obtain 3 dataset matrices that analyze gastric tumor tissue versus normal gastric tissue, performed microarray using GPL570 platform, and from different sources. The genes found in silico analysis were confirmed in several lines of GC cells by RT-qPCR. The protein data bank was used to find the correspondent proteins. Then a structural-based virtual screening was done to find molecules, and docking analysis was done using the DockThor server. Our results of transcriptomic analysis, together with RT-qPCR, confirm the high expression of the genes AJUBA, FBXL13, CCDC69, CD80 and NOLC1 in GC lines. Based on that, the correspondent proteins were used in SBVS analysis. Five molecules, one each target, MCULE-2386589557-0-6, MCULE-7343047040-0-1, MCULE-5230409338-0-3, MCULE-9178344200-0-1 and MCULE -5881513100-0-29. All molecules have favorable pharmacokinetic, pharmacodynamic and toxicological properties. Molecular docking analysis revealed that the molecules interact with proteins in critical sites for their activity. Using a virtual screening approach, a molecular docking study was performed for proteins encoded by genes that play important roles in cellular functions for carcinogenesis. Combining a systematic collection of public microarray data with a comparative meta-profiling, RT-qPCR, SBVS, and molecular docking analysis provided a suitable approach to find genes involved in GC and work the correspondent protein to strive for new molecules with anticancer properties.
Overview
The claims and statistics of this paper haven’t been checked yet.
Run the check — free, no account needed. It reads the open-access text and checks the sources it cites.
Integrity signals
Registry
Cites
Statistics
Figures
Verification
Claims the paper makes
The claims and statistics of this paper haven’t been checked yet.
Run the check — free, no account needed. It reads the open-access text and checks the sources it cites.
Self-check
Percentages, sums and reported differences re-computed from the paper’s own numbers.
The self-check needs the paper’s full text.
Citations
Cites
Highly accurate protein structure prediction with AlphaFold
Jumper, J., Evans, R., Pritzel, A., Green, T., Figurnov, M., Ronneberger, O., Tunyasuvunakool, K., Bates, R., Žídek, A., Potapenko, A., et al. (2021) · Nature · doi:10.1038/s41586-021-03819-2 · Cited by 43,764
Metadata
- Authors
- Brito, D. M. S., Lima, O. G., Mesquita, F. P., Silva, E. L. D., Moraes, M. E. A. D., Burbano, R. M. R., Montenegro, R. C., & Souza, P. F. N.
- Affiliations
- Universidade Federal do Ceará (BR)
- Universidade Federal do Pará (BR)
- Corresponding author
- Souza, Pedro F.N.
- Venue
- Pharmaceutics
- Publisher
- MDPI AG
- Published
- 2023-08-15
- Volume
- 15
- Issue
- 9
- Pages
- 2303-2303
- ISSN
- 1999-4923 (ISSN-L)
- PMC
- PMC10535099
- OpenAlex
- W4386638888
- Cited by
- 5
- References
- 1
- Citations by year
- 2026: 1 · 2025: 1 · 2024: 3
- FWCI
- 0.71
- Type
- journal article
- Language
- en
- Open access
- gold
- doi.org
- Locations
- Pharmaceutics (publishedVersion, cc-by)
- Preprints.org (acceptedVersion, cc-by)
- PubMed Central (publishedVersion, cc-by)
- PubMed (publishedVersion)
- DOAJ (DOAJ: Directory of Open Access Journals) (submittedVersion, cc-by-sa)
- Funders
- Coordenação de Aperfeiçoamento de Pessoal de Nível Superior
- Conselho Nacional de Desenvolvimento Científico e Tecnológico (305459/2019-8, 403493/2021-8, 2019-8, 305003/2022-4, /2022-9, 151388/2022-9)
- Fundação Cearense de Apoio ao Desenvolvimento Científico e Tecnológico
- Universidade Federal do Pará
- Pró-Reitoria de Pesquisa e Pós-Graduação, Universidade Federal do Pará
- Topics
- Life Sciences › Pharmacology, Toxicology and Pharmaceutics › Drug Discovery › Computational Drug Discovery Methods
- Health Sciences › Medicine › Oncology › Gastric Cancer Management and Outcomes
- Life Sciences › Biochemistry, Genetics and Molecular Biology › Molecular Biology › Gene expression and cancer classification
- Keywords
- gastric cancer, drug target identification, differentially expressed genes, Ajuba, CD80, NOLC1, structure-based virtual screening, molecular docking, anticancer drug discovery, gene expression profiling, prognostic factors
About these checks
Registry, retraction, Cites and statistics results are computed, not judged, with one exception: a printed reference that no index lists is read once by a model before it counts as a citation error. Claims are extracted by a model and kept only when their quote appears verbatim in the text; each cited source is then checked, with a model’s help, for whether it says what the claim relies on. Those verdicts can be wrong — read the claim’s quote and the cited source before relying on one.
Statistics and arithmetic are recomputed, not judged.
Confidence bands are shown only for fields calibrated on our annotated test set. None is calibrated yet, so no band is shown.
What counts as a claim ›How we measure confidence ›How we check this ›
Are you an author, or do you see a problem with this page? Request a review
How to cite
Cite CoChat for the checks on this page, and the paper for its own findings.
- This page
- CoChat. (2026). Citation check: A Shortcut From Genome to Drug: The Employment of Bioinformatic Tools to Find New Targets for Gastric Cancer Treatment. https://app.cochat.ai/papers/10.20944/preprints202308.1098.v1
- The paper
- Brito, D. M. S., Lima, O. G., Mesquita, F. P., Silva, E. L. D., Moraes, M. E. A. D., Burbano, R. M. R., Montenegro, R. C., & Souza, P. F. N. (2023). A Shortcut From Genome to Drug: The Employment of Bioinformatic Tools to Find New Targets for Gastric Cancer Treatment. Pharmaceutics. https://doi.org/10.20944/preprints202308.1098.v1
