

The DOI matches its Crossref record; 2 of the 2 references it cites were found in a registry or an index.
Application of machine learning in the quantitative analysis of surface characteristics of highly abundant cytoplasmic proteins: Toward AI-based biomimetics
Open accessPreprint — published as 10.3390/biomimetics9030162
Abstract
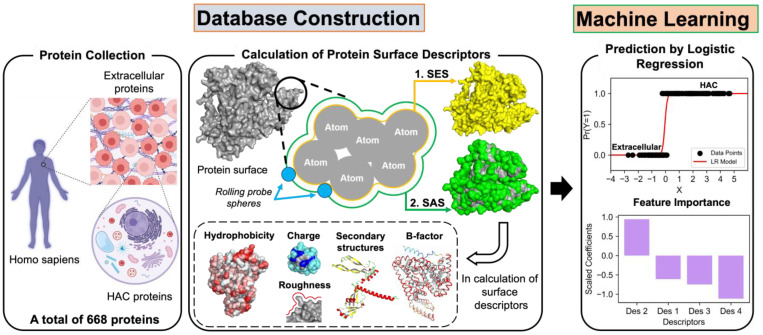
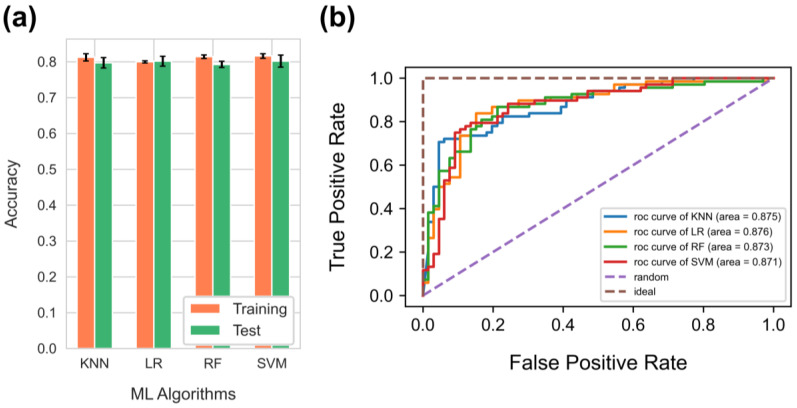
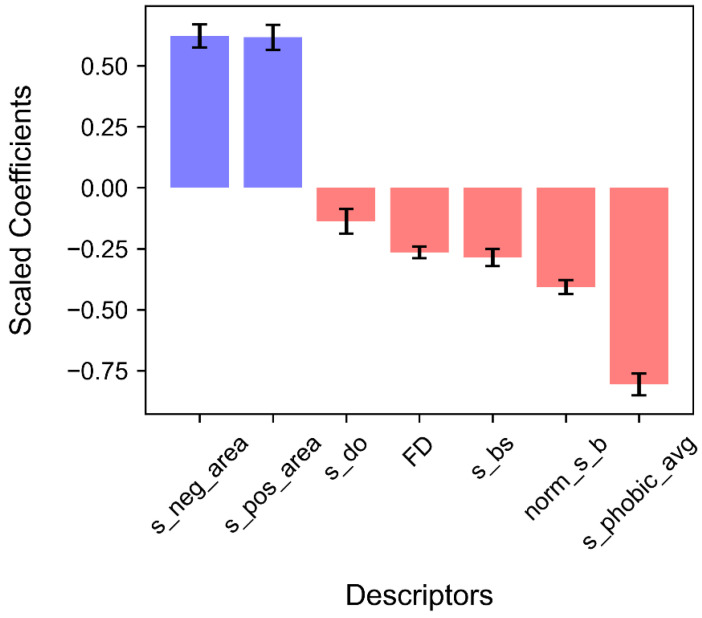
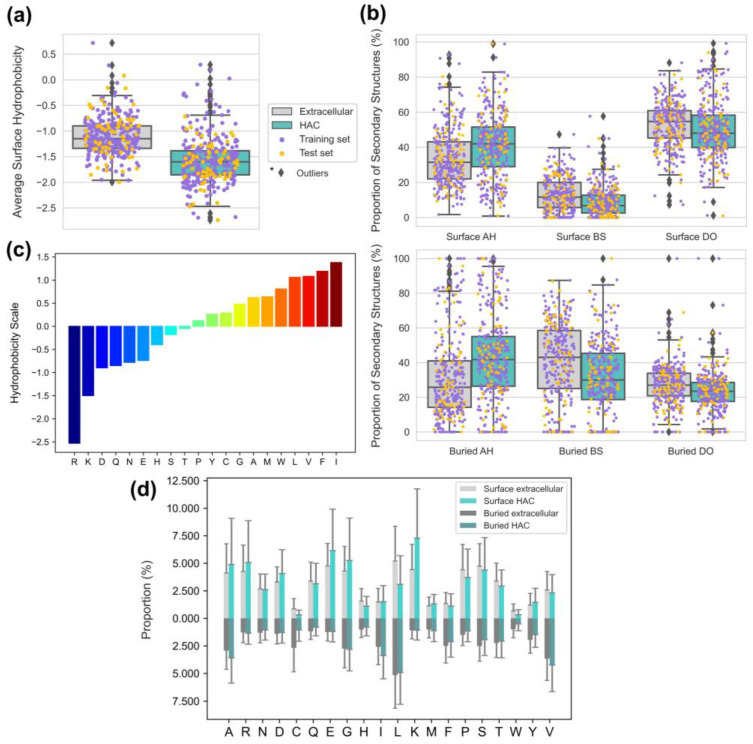
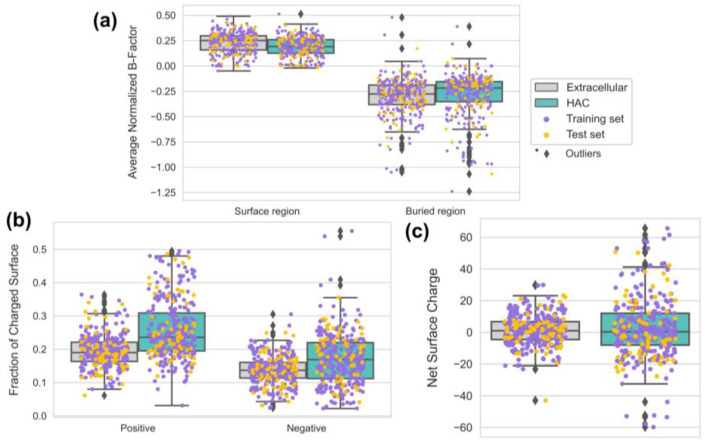
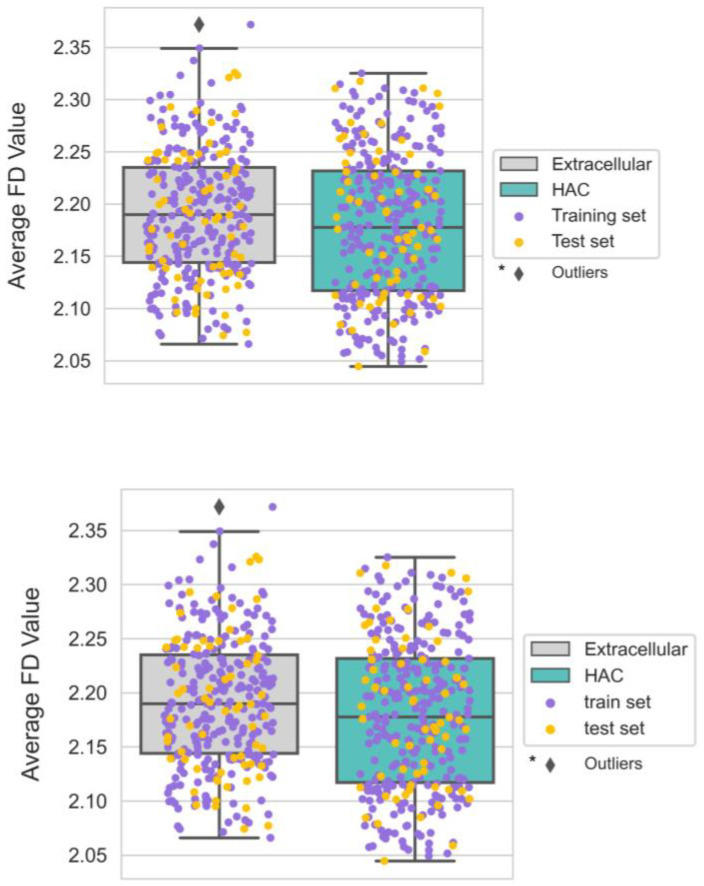
Proteins in the crowded environment of human cells have often been studied regarding nonspecific interactions, misfolding, and aggregation, which may cause cellular malfunction and disease. Specifically, proteins with high abundance are more susceptible to these issues due to the law of mass action. Therefore, the surfaces of highly abundant cytoplasmic (HAC) proteins directly exposed to the environment can exhibit specific physicochemical, structural, and geometrical characteristics that reduce nonspecific interactions and adapt to the environment. However, the quantitative relationships between the overall surface descriptors still need clarification. Here, we used machine learning to identify HAC proteins using hydrophobicity, charge, roughness, secondary structures, and B-factor from the protein surfaces and quantify the contribution of each descriptor. First, several supervised learning algorithms were compared to solve binary classification problems for the surfaces of HAC and extracellular proteins. Then, logistic regression was adopted for the feature importance analysis of descriptors considering model performance (80.2% accuracy and 87.6% AUC) and interpretability. The HAC proteins showed positive correlations with negatively and positively charged areas but negative correlations with hydrophobicity, B-factor, beta structure proportion, roughness, and disordered regions proportion. Finally, the details of each descriptor could be explained concerning adaptative surface strategies of HAC proteins to regulate nonspecific interactions, protein folding, flexibility, stability, and adsorption. This study presented a novel approach using various surface descriptors to identify HAC proteins and provided quantitative design rules for the surfaces well-suited to human cellular crowded environments.
Overview
The claims and statistics of this paper haven’t been checked yet.
Run the check — free, no account needed. It reads the open-access text and checks the sources it cites.
Integrity signals
Registry
Cites
Statistics
Figures
Verification
Claims the paper makes
The claims and statistics of this paper haven’t been checked yet.
Run the check — free, no account needed. It reads the open-access text and checks the sources it cites.
Self-check
Percentages, sums and reported differences re-computed from the paper’s own numbers.
The self-check needs the paper’s full text.
Citations
Cites
Highly accurate protein structure prediction with AlphaFold
Jumper, J., Evans, R., Pritzel, A., Green, T., Figurnov, M., Ronneberger, O., Tunyasuvunakool, K., Bates, R., Žídek, A., Potapenko, A., et al. (2021) · Nature · doi:10.1038/s41586-021-03819-2 · Cited by 43,764
AlphaFold and Implications for Intrinsically Disordered Proteins
Ruff, K. M., & Pappu, R. V. (2021) · Journal of Molecular Biology · doi:10.1016/j.jmb.2021.167208 · Cited by 635
Metadata
- Authors
- Moon, J., Hu, G., & Hayashi, T.
- Affiliations
- Tokyo Institute of Technology (JP)
- Corresponding author
- Hayashi, Tomohiro
- Venue
- Biomimetics
- Publisher
- MDPI AG
- Published
- 2023-12-15
- Volume
- 9
- Issue
- 3
- Pages
- 162-162
- ISSN
- 2313-7673 (ISSN-L)
- PMC
- PMC10967800
- OpenAlex
- W4392518014
- Cited by
- 7
- References
- 2
- Citations by year
- 2026: 2 · 2025: 3 · 2024: 2
- FWCI
- 0.95
- Type
- journal article
- Language
- en
- Open access
- gold
- doi.org
- Locations
- Biomimetics (publishedVersion, cc-by)
- Preprints.org (acceptedVersion, cc-by)
- PubMed Central (publishedVersion, cc-by)
- PubMed (publishedVersion)
- DOAJ (DOAJ: Directory of Open Access Journals) (submittedVersion, cc-by-sa)
- Tokyo Tech Research Repository (Tokyo Institute of Technology) (submittedVersion)
- Funders
- Japan Society for the Promotion of Science (JP 22H04530, JP23H04059, 23H04059)
- Topics
- Life Sciences › Biochemistry, Genetics and Molecular Biology › Molecular Biology › Protein Structure and Dynamics
- Life Sciences › Biochemistry, Genetics and Molecular Biology › Molecular Biology › Machine Learning in Bioinformatics
- Life Sciences › Pharmacology, Toxicology and Pharmaceutics › Drug Discovery › Computational Drug Discovery Methods
- Keywords
- surface descriptors, protein hydrophobicity, protein charge, surface roughness, Debye-Waller factor, protein secondary structure, intrinsically disordered regions, protein folding, protein stability, protein adsorption, protein crowding, extracellular proteins, feature importance
About these checks
Registry, retraction, Cites and statistics results are computed, not judged, with one exception: a printed reference that no index lists is read once by a model before it counts as a citation error. Claims are extracted by a model and kept only when their quote appears verbatim in the text; each cited source is then checked, with a model’s help, for whether it says what the claim relies on. Those verdicts can be wrong — read the claim’s quote and the cited source before relying on one.
Statistics and arithmetic are recomputed, not judged.
Confidence bands are shown only for fields calibrated on our annotated test set. None is calibrated yet, so no band is shown.
What counts as a claim ›How we measure confidence ›How we check this ›
Are you an author, or do you see a problem with this page? Request a review
