Student or educator? Sign up with your school email and get 6 months of Pro free.
PreprintCited by 7Microbial Natural Products and BiosynthesisFungal Plant Pathogen ControlPlant biochemistry and biosynthesis

The DOI matches its Crossref record; 1 of the 1 references it cites were found in a registry or an index.

Unravelling the Function of the Sesquiterpene Cyclase STC3 in the Life Cycle of Botrytis cinerea

Open access
Coca-Ruiz, Víctor, Suárez, Ivonne, Aleu, Josefina, Cantoral, Jesús M., González, Celedonio, Garrido, Carlos, Brito, Nélida, Collado, and Isidro G.·2024·International Journal of Molecular Sciences

Preprint — published as 10.3390/ijms25105125 · Paper page

Abstract

The genome sequencing of Botrytis cinerea has supplied a general overview of the map of genes involved in secondary metabolite synthesis. B. cinerea genomic data have revealed that this phytopathogenic fungus has seven sesquiterpene cyclase (Bcstc) genes that encode proteins involved in the farnesyl diphosphate cyclization. Three sesquiterpene cyclases (BcStc1, BcStc5 and BcStc7) have been characterized, related to the biosynthesis of botrydial, abscisic acid and (+)-4-epi-eremophilenol, respectively. However, the role of the other four sesquiterpene cyclases (BcStc2, BcStc3, BcStc4 and BcStc6) remains unknown. BcStc3 is a well-conserved protein with homologues in many fungal species, and here, we have undertaken its functional characterization in the life cycle of the fungus. A null mutant ΔBcstc3 and an overexpressed–Bcstc3 transformant (OvBcstc3) were generated, and both strains show deregulation of those other sesquiterpene cyclase-encoding genes (Bcstc1, Bcstc5, Bcstc7). These results suggest a co-regulation of the expression of the sesquiterpene cyclase gene family in B. cinerea. Phenotypic characterization of both transformants revealed that BcStc3 is involved in oxidative stress tolerance, production of reactive oxygen species and virulence. The metabolomic analysis allowed the isolation of characteristic polyketides and eremophilenols from the secondary metabolism of B. cinerea, although no sesquiterpenes different from those already described were identified.

Overview

The claims and statistics of this paper haven’t been checked yet.

Run the check — free, no account needed. It reads the open-access text and checks the sources it cites.

A few free checks a day · papers already verified open instantly · results are public

Integrity signals

Registry

Crossref · 10.20944/preprints202403.1652.v1

Cites

1 of 1 references verified0 citation errors · 0 not checkable

Statistics

Figures

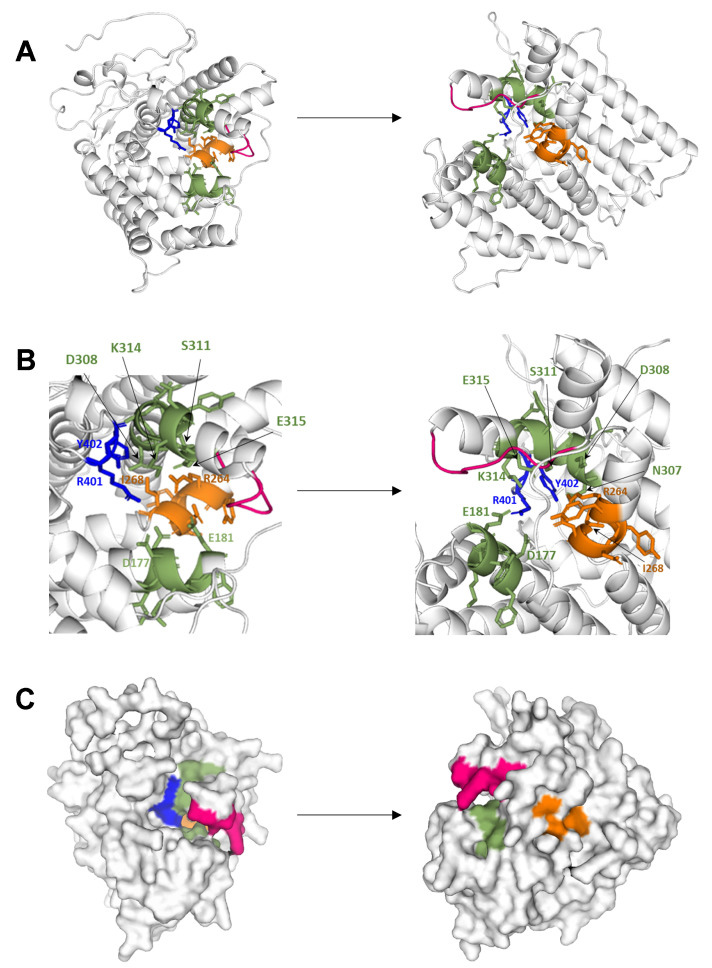
Figure 1 Tertiary structure of the protein BcStc3 via AlphaFold modeling. (A) Cartoon representations highlighting the two magnesium binding motifs (green), the effector triad (orange) and the H1α-loop (red). The R401 and Y402 residues, involved in substrate binding, are shown as sticks (blue). (B) Close-up view of the active site of BcStc3. The canonical conserved residues are shown as sticks. (C) Surface views of BcStc3; the conserved motifs are colored as in (A).
Figure 1 Tertiary structure of the protein BcStc3 via AlphaFold modeling. (A) Cartoon representations highlighting the two magnesium binding motifs (green), the effector triad (orange) and the H1α-loop (red). The R401 and Y402 residues, involved in substrate binding, are shown as sticks (blue). (B) Close-up view of the active site of BcStc3. The canonical conserved residues are shown as sticks. (C) Surface views of BcStc3; the conserved motifs are colored as in (A).CC BY · PubMed Central
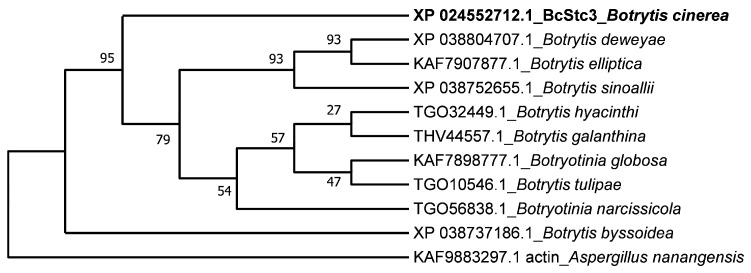
Figure 2 Phylogenetic tree of BcStc3 and homologous protein sequences of other Botrytis species. The phylogenetic tree was inferred using the neighbor-joining method via MEGA11 software (version v11.0) with bootstrap values for 1000 replicates which are indicated. Protein sequences were selected after running similarity search by BlastP (https://blast.ncbi.nlm.nih.gov/Blast.cgi?PAGE=Proteins (accessed on 26 January 2024)) using BcStc3 as query sequence. NCBI accession number of each sequence is shown. Actin (KAF9883297.1) of A. nanangensis was used as outgroup.
Figure 2 Phylogenetic tree of BcStc3 and homologous protein sequences of other Botrytis species. The phylogenetic tree was inferred using the neighbor-joining method via MEGA11 software (version v11.0) with bootstrap values for 1000 replicates which are indicated. Protein sequences were selected after running similarity search by BlastP (https://blast.ncbi.nlm.nih.gov/Blast.cgi?PAGE=Proteins (accessed on 26 January 2024)) using BcStc3 as query sequence. NCBI accession number of each sequence is shown. Actin (KAF9883297.1) of A. nanangensis was used as outgroup.CC BY · PubMed Central
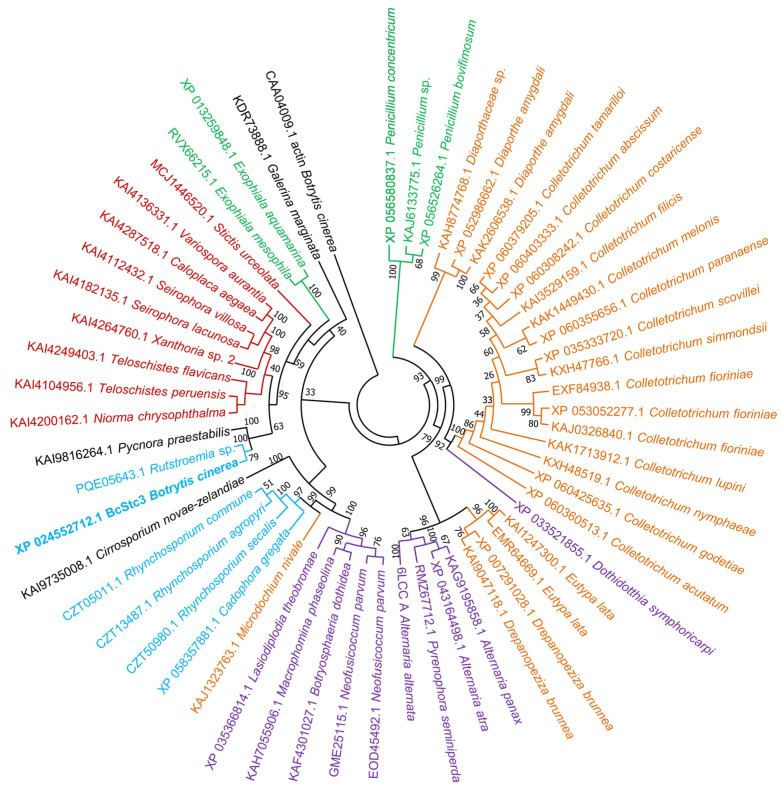
Figure 3 Phylogenetic tree of BcStc3 and homologous protein sequences of other fungi species. The phylogenetic tree was inferred using the neighbor-joining method via MEGA11 software (version v11.0) and bootstrap values from 1000 trials are indicated at each branch node. Protein sequences were selected after running similarity search by BlastP (https://blast.ncbi.nlm.nih.gov/Blast.cgi?PAGE=Proteins (accessed on 26 January 2024)) using BcStc3 as query sequence, excluding the Botrytis and Botryotinia taxids (33196 and 40558, respectively), and filtering the results based on percent identity >30%, coverage >70% and the bit-score >50. The top 55 hits were retrieved for sequence alignment and phylogenetic analysis. NCBI accession number of each sequence is shown. Actin (CAA04009.1) of B. cinerea was used as outgroup. Taxonomic distribution is highlighted by different colors: Eurotiomycetes (green), Sordariomycetes (orange), Dothideomycetes (violet), Leotiomycetes (blue) and Lecanoromycetes (red). The only members of the Xylobotryomycetes, Candelariomycetes and Agaricomycetes (Basidiomycota) classes are highlighted in black.
Figure 3 Phylogenetic tree of BcStc3 and homologous protein sequences of other fungi species. The phylogenetic tree was inferred using the neighbor-joining method via MEGA11 software (version v11.0) and bootstrap values from 1000 trials are indicated at each branch node. Protein sequences were selected after running similarity search by BlastP (https://blast.ncbi.nlm.nih.gov/Blast.cgi?PAGE=Proteins (accessed on 26 January 2024)) using BcStc3 as query sequence, excluding the Botrytis and Botryotinia taxids (33196 and 40558, respectively), and filtering the results based on percent identity >30%, coverage >70% and the bit-score >50. The top 55 hits were retrieved for sequence alignment and phylogenetic analysis. NCBI accession number of each sequence is shown. Actin (CAA04009.1) of B. cinerea was used as outgroup. Taxonomic distribution is highlighted by different colors: Eurotiomycetes (green), Sordariomycetes (orange), Dothideomycetes (violet), Leotiomycetes (blue) and Lecanoromycetes (red). The only members of the Xylobotryomycetes, Candelariomycetes and Agaricomycetes (Basidiomycota) classes are highlighted in black.CC BY · PubMed Central
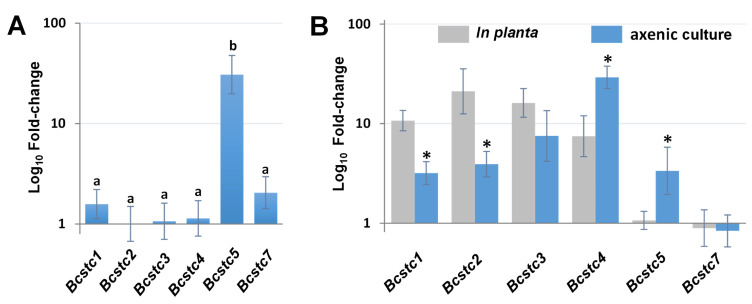
Figure 4 Gene expression of the Bcstc gene family in the B. cinerea UCA992 strain. (A) Relative expression levels in non-germinated conidia. mRNA levels were quantified by qRT-PCR, normalized to actA and B-tub mRNA levels, and expressed as a fold change over Bcstc2 expression. (B) Relative expression levels in planta and axenic culture. mRNA levels were quantified by qRT-PCR in mycelium grown in YGG medium (axenic culture) and leaves of N. tabaccum infected with a conidial suspension (in planta). Values were normalized to actA and B-tub mRNA levels and expressed as a fold change over mRNA levels of each gene in non-germinated conidia. Error bars show standard deviation of three biological replicates (n = 3). Different letters above the bars in (A) mean that there are significant differences between n fold changes in the six genes (p-value < 0.05). * in (B) indicates significant differences between mRNA levels in in planta and axenic culture for each gene (p-value < 0.05).
Figure 4 Gene expression of the Bcstc gene family in the B. cinerea UCA992 strain. (A) Relative expression levels in non-germinated conidia. mRNA levels were quantified by qRT-PCR, normalized to actA and B-tub mRNA levels, and expressed as a fold change over Bcstc2 expression. (B) Relative expression levels in planta and axenic culture. mRNA levels were quantified by qRT-PCR in mycelium grown in YGG medium (axenic culture) and leaves of N. tabaccum infected with a conidial suspension (in planta). Values were normalized to actA and B-tub mRNA levels and expressed as a fold change over mRNA levels of each gene in non-germinated conidia. Error bars show standard deviation of three biological replicates (n = 3). Different letters above the bars in (A) mean that there are significant differences between n fold changes in the six genes (p-value < 0.05). * in (B) indicates significant differences between mRNA levels in in planta and axenic culture for each gene (p-value < 0.05).CC BY · PubMed Central
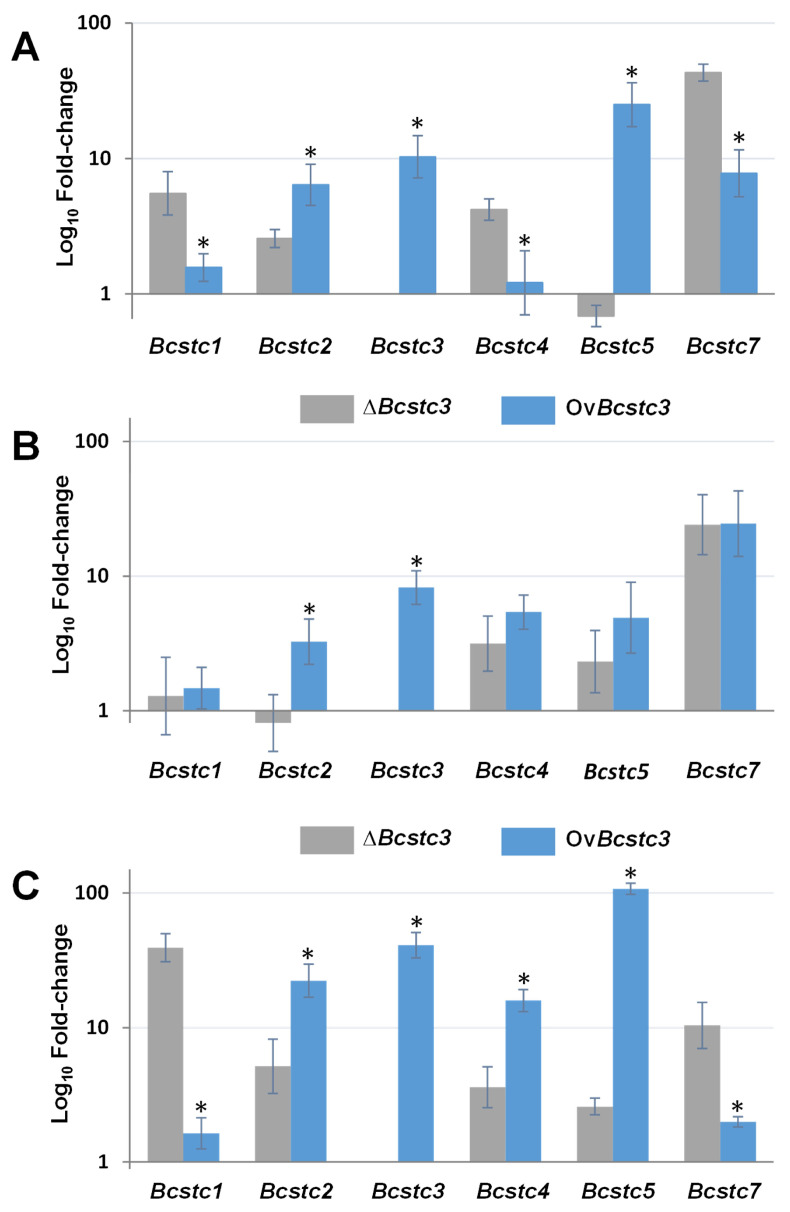
Figure 5 Gene expression of the Bstc gene family in the ∆Bcstc3 and OvBcstc3 strains. (A) Relative expression levels in non-germinated conidia. mRNA levels were quantified by qRT-PCR, normalized to actA and B-tub mRNA levels, and expressed as a fold change over mRNA levels of each gene in non-germinated conidia of the UCA992 strain, set as 1. (B) Relative expression levels in axenic culture. mRNA levels were quantified by qRT-PCR in mycelium grown in YGG medium for 96 h (axenic culture). Values were normalized to actA and B-tub mRNA levels and expressed as a fold change over mRNA levels of each gene in the UCA992 strain grown in the same conditions, set as 1. (C) Relative expression levels of the Bcstc genes in planta. mRNA levels were quantified by qRT-PCR in infected tissue of N. tabaccum leaves 96 h post inoculation with a conidial suspension of each strain. Values were normalized to actA and B-tub mRNA levels and expressed as a fold change over mRNA levels of each gene in the UCA992 strain under the same infection conditions. Error bars show standard deviation of three biological replicates (n = 3). * means significant differences between the n-fold change in mRNA levels of each gene in each condition assessed in the ∆Bcstc3 and OvBcstc3 strains (p-value < 0.05).
Figure 5 Gene expression of the Bstc gene family in the ∆Bcstc3 and OvBcstc3 strains. (A) Relative expression levels in non-germinated conidia. mRNA levels were quantified by qRT-PCR, normalized to actA and B-tub mRNA levels, and expressed as a fold change over mRNA levels of each gene in non-germinated conidia of the UCA992 strain, set as 1. (B) Relative expression levels in axenic culture. mRNA levels were quantified by qRT-PCR in mycelium grown in YGG medium for 96 h (axenic culture). Values were normalized to actA and B-tub mRNA levels and expressed as a fold change over mRNA levels of each gene in the UCA992 strain grown in the same conditions, set as 1. (C) Relative expression levels of the Bcstc genes in planta. mRNA levels were quantified by qRT-PCR in infected tissue of N. tabaccum leaves 96 h post inoculation with a conidial suspension of each strain. Values were normalized to actA and B-tub mRNA levels and expressed as a fold change over mRNA levels of each gene in the UCA992 strain under the same infection conditions. Error bars show standard deviation of three biological replicates (n = 3). * means significant differences between the n-fold change in mRNA levels of each gene in each condition assessed in the ∆Bcstc3 and OvBcstc3 strains (p-value < 0.05).CC BY · PubMed Central
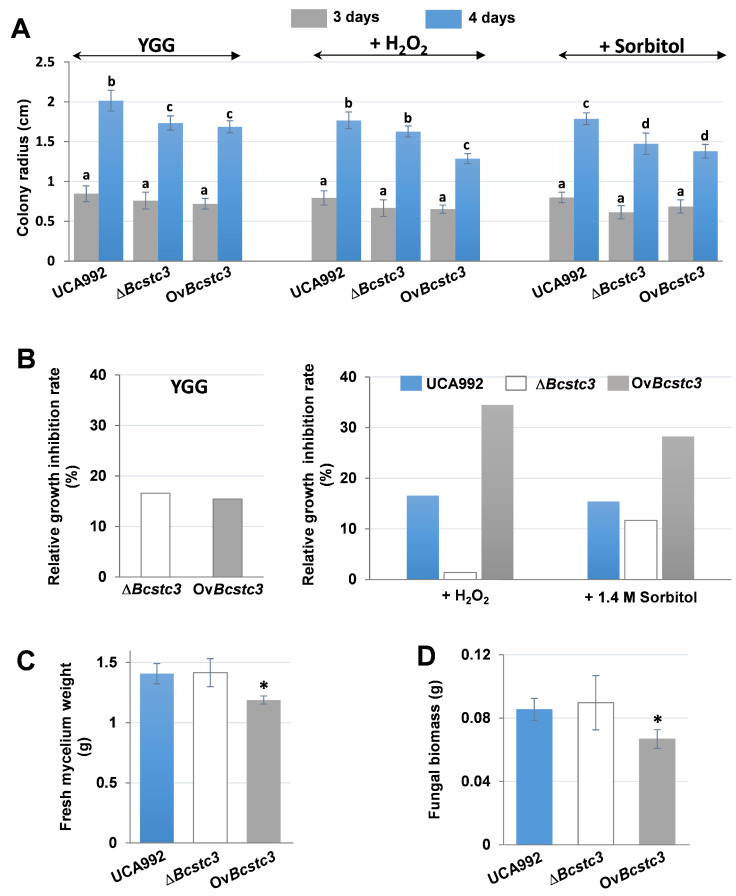
Figure 6 BcStc3 is involved in fungal growth and tolerance to stress agents. (A) Colony growth of the indicated fungal strains under different stressing conditions. It is represented the colony radius of the indicated strains grown in YGG medium (YGG) and YGG supplemented with 1.5 mM hydrogen peroxide (+H2O2) or 1.4 M sorbitol (+sorbitol) after 3 and 4 days of incubation at 20 °C. The results are presented as the mean value ± standard deviation of fifteen biological replicates (n = 15). (B) Relative growth inhibition of the transformants against the UC992 strain and of each fungal strain under different abiotic stresses. It is represented the relative growth inhibition rate of the ΔBcstc3 and OvBcstc3 strains grown in YGG solid medium, with respect to the UCA992 strain (YGG), and the relative growth inhibition rates of the three fungal strains grown in YGG solid medium supplemented with 1.5 mM hydrogen peroxide (+H2O2) or 1.4 M sorbitol (+1.4 M sorbitol) compared to the growth of each strain in the same medium without the stress agents. (C) Fresh mycelium weight and (D) fungal biomass of the indicated strains after fungal growth in YGG liquid medium for 96 h at 20 °C (n = 3 biological replicates). Statistical significance is denoted by different letters above the bars in A (p < 0.05). * in (C,D) means statistical significance between UCA992 and ΔBcstc3 or OvBcstc3 strains.
Figure 6 BcStc3 is involved in fungal growth and tolerance to stress agents. (A) Colony growth of the indicated fungal strains under different stressing conditions. It is represented the colony radius of the indicated strains grown in YGG medium (YGG) and YGG supplemented with 1.5 mM hydrogen peroxide (+H2O2) or 1.4 M sorbitol (+sorbitol) after 3 and 4 days of incubation at 20 °C. The results are presented as the mean value ± standard deviation of fifteen biological replicates (n = 15). (B) Relative growth inhibition of the transformants against the UC992 strain and of each fungal strain under different abiotic stresses. It is represented the relative growth inhibition rate of the ΔBcstc3 and OvBcstc3 strains grown in YGG solid medium, with respect to the UCA992 strain (YGG), and the relative growth inhibition rates of the three fungal strains grown in YGG solid medium supplemented with 1.5 mM hydrogen peroxide (+H2O2) or 1.4 M sorbitol (+1.4 M sorbitol) compared to the growth of each strain in the same medium without the stress agents. (C) Fresh mycelium weight and (D) fungal biomass of the indicated strains after fungal growth in YGG liquid medium for 96 h at 20 °C (n = 3 biological replicates). Statistical significance is denoted by different letters above the bars in A (p < 0.05). * in (C,D) means statistical significance between UCA992 and ΔBcstc3 or OvBcstc3 strains.CC BY · PubMed Central
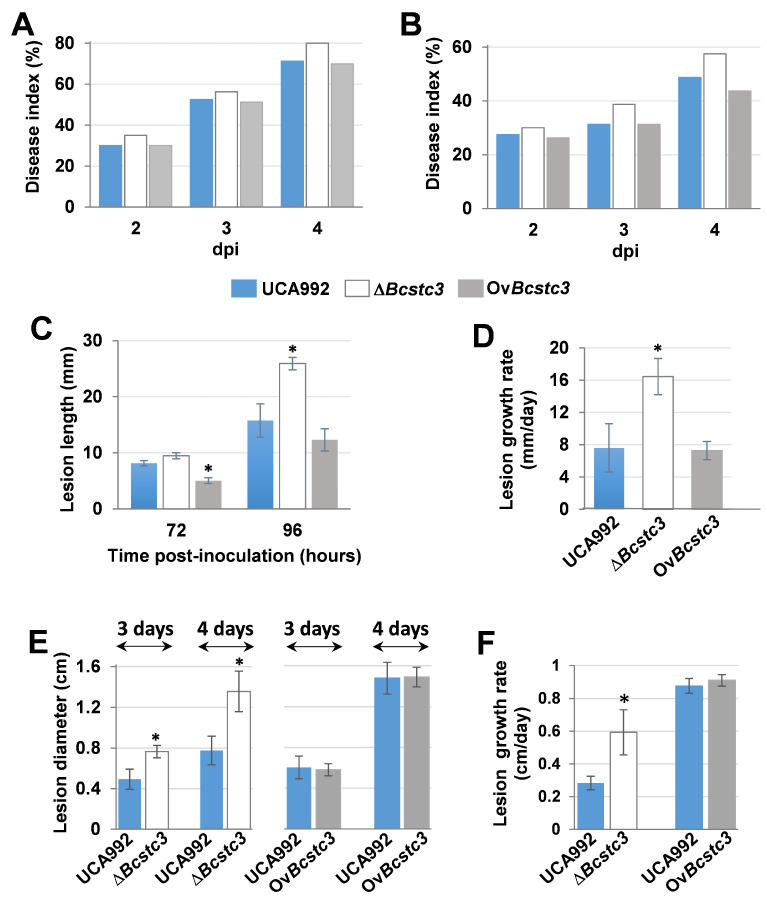
Figure 7 Deletion of the Bcstc3 gene leads to increased virulence of B. cinerea. Different hosts were inoculated with 5 µL droplets containing 2500 conidia of the indicated strain in TGGK solution, incubated in the dark at 20 °C under high humidity conditions and the degree of damage was estimated. (A) Disease index (%) of tomato fruits at 2, 3 and 4 dpi estimated with a qualitative scale (Supplementary Figure S3A). (B) Disease index (%) of grapefruits at 2, 3 and 4 dpi estimated with a qualitative scale (Supplementary Figure S3). (C) Length and (D) growth rate (mm/day) of the lesions produced in gerbera petals estimated at days 3 and 4 after inoculation. (E) Diameter and (F) growth rate (cm/day) of the lesions produced in detached tobacco leaves 3 and 4 dpi. Fruit decay in tomatoes and grapefruits was determined for more than 30 fruits per fungal strain. The total number of inoculations on gerbera petals and tobacco leaves was greater than 15 per fungal strain and the results show the mean values ± SD. * means statistical significance between UCA992 and ΔBcstc3 or OvBcstc3 strains.
Figure 7 Deletion of the Bcstc3 gene leads to increased virulence of B. cinerea. Different hosts were inoculated with 5 µL droplets containing 2500 conidia of the indicated strain in TGGK solution, incubated in the dark at 20 °C under high humidity conditions and the degree of damage was estimated. (A) Disease index (%) of tomato fruits at 2, 3 and 4 dpi estimated with a qualitative scale (Supplementary Figure S3A). (B) Disease index (%) of grapefruits at 2, 3 and 4 dpi estimated with a qualitative scale (Supplementary Figure S3). (C) Length and (D) growth rate (mm/day) of the lesions produced in gerbera petals estimated at days 3 and 4 after inoculation. (E) Diameter and (F) growth rate (cm/day) of the lesions produced in detached tobacco leaves 3 and 4 dpi. Fruit decay in tomatoes and grapefruits was determined for more than 30 fruits per fungal strain. The total number of inoculations on gerbera petals and tobacco leaves was greater than 15 per fungal strain and the results show the mean values ± SD. * means statistical significance between UCA992 and ΔBcstc3 or OvBcstc3 strains.CC BY · PubMed Central
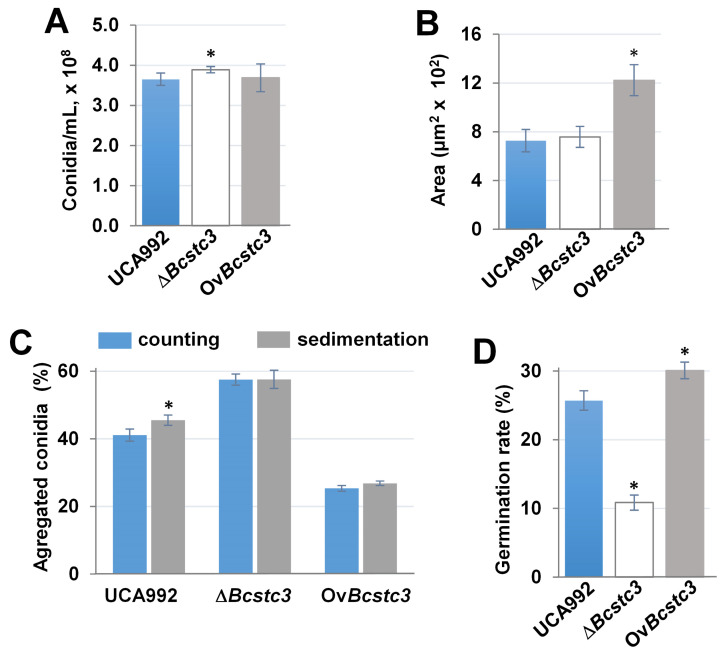
Figure 8 Involvement of BcStc3 in conidial morphogenesis and germination. (A) Conidial production of the indicated strain in tomato agar plates inoculated with agar plugs containing young mycelium exposed for 16 h to near-UV light for three days of inoculation and incubated at 20 °C for seven more days. (B) Bright-field pictures of conidia were taken with an Olympus BX-50 microscope and were used to measure the conidial area with the ImageJ software (version v1.54h, National Institutes of Health, USA) (n > 100). (C) The percentage of conidia clustered in groups of two or more was calculated from random bright-field pictures of 10,000 conidia in YGG incubated on a sterile glass slide for 6 h at 20 °C (counting), and the conidial sedimentation out of the suspension was estimated calculating the percentage of conidia that was sediment after 2 h at room temperature (sedimentation). (D) Conidial germination rate was calculated taking bright-field pictures of conidia incubated in YGG medium for 6 h with the microscope and counting conidia with elongating germ tube longer than the conidial longitudinal diameter (germinated conidia) and expressed as a percentage related to the total conidia counted (n > 100). * means statistical significance between UCA992 and ΔBcstc3 or OvBcstc3 strains.
Figure 8 Involvement of BcStc3 in conidial morphogenesis and germination. (A) Conidial production of the indicated strain in tomato agar plates inoculated with agar plugs containing young mycelium exposed for 16 h to near-UV light for three days of inoculation and incubated at 20 °C for seven more days. (B) Bright-field pictures of conidia were taken with an Olympus BX-50 microscope and were used to measure the conidial area with the ImageJ software (version v1.54h, National Institutes of Health, USA) (n > 100). (C) The percentage of conidia clustered in groups of two or more was calculated from random bright-field pictures of 10,000 conidia in YGG incubated on a sterile glass slide for 6 h at 20 °C (counting), and the conidial sedimentation out of the suspension was estimated calculating the percentage of conidia that was sediment after 2 h at room temperature (sedimentation). (D) Conidial germination rate was calculated taking bright-field pictures of conidia incubated in YGG medium for 6 h with the microscope and counting conidia with elongating germ tube longer than the conidial longitudinal diameter (germinated conidia) and expressed as a percentage related to the total conidia counted (n > 100). * means statistical significance between UCA992 and ΔBcstc3 or OvBcstc3 strains.CC BY · PubMed Central
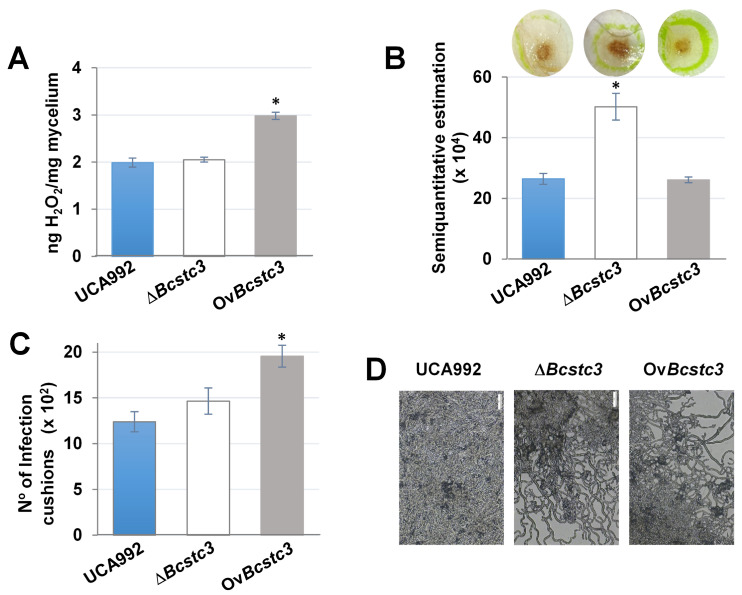
Figure 9 ROS production and BcStc3 are related. (A) ROS production in axenic culture by the indicated fungal strain incubating 24 mg of fresh mycelium with 1 mL of DAB solution for 5 h and measuring the absorbance at 417 nm after discarding the mycelium. (B) ROS production in the infected area of tobacco leaves by the indicated fungal strain 48 h after inoculation and vacuum-infiltrated for 1 h with 1 mg/mL DAB solution. ROS production was measured by ImageJ software (version v1.54h, National Institutes of Health, New York, NY, USA), and values were expressed as the percentage of brown pixels detected around the infection point. (Δ) Infection cushion production on one-quarter PDA plates after 48 h of incubation at 20 °C and quantified following the semiquantitative method described by [42]. (D) Pictures representative of the infection cushions of (C). * means statistical significance between UCA992 and ΔBcstc3 or OvBcstc3 strains.
Figure 9 ROS production and BcStc3 are related. (A) ROS production in axenic culture by the indicated fungal strain incubating 24 mg of fresh mycelium with 1 mL of DAB solution for 5 h and measuring the absorbance at 417 nm after discarding the mycelium. (B) ROS production in the infected area of tobacco leaves by the indicated fungal strain 48 h after inoculation and vacuum-infiltrated for 1 h with 1 mg/mL DAB solution. ROS production was measured by ImageJ software (version v1.54h, National Institutes of Health, New York, NY, USA), and values were expressed as the percentage of brown pixels detected around the infection point. (Δ) Infection cushion production on one-quarter PDA plates after 48 h of incubation at 20 °C and quantified following the semiquantitative method described by [42]. (D) Pictures representative of the infection cushions of (C). * means statistical significance between UCA992 and ΔBcstc3 or OvBcstc3 strains.CC BY · PubMed Central

Verification

Claims the paper makes

The claims and statistics of this paper haven’t been checked yet.

Run the check — free, no account needed. It reads the open-access text and checks the sources it cites.

A few free checks a day · papers already verified open instantly · results are public

Self-check

Percentages, sums and reported differences re-computed from the paper’s own numbers.

The self-check needs the paper’s full text.

Citations

Cites

Metadata

Authors
Coca-Ruiz, V., Suárez, I., Aleu, J., Cantoral, J. M., González, C., Garrido, C., Brito, N., & Collado, A. I. G.
Affiliations
  • Universidad de Cádiz (ES)
  • Universidad de La Laguna (ES)
Corresponding author
Brito, Nélida
Venue
International Journal of Molecular Sciences
Publisher
MDPI AG
Published
2024-03-27
Volume
25
Issue
10
Pages
5125-5125
ISSN
1422-0067 (ISSN-L)
OpenAlex
W4396750468
Cited by
7
References
1
Citations by year
2026: 5 · 2025: 1 · 2024: 1
FWCI
1.99
Type
journal article
Language
en
Open access
Locations
  • International Journal of Molecular Sciences (publishedVersion, cc-by)
  • Preprints.org (acceptedVersion, cc-by)
  • PubMed Central (publishedVersion, cc-by)
  • PubMed (publishedVersion)
  • RODIN (Universidad de Cádiz) (submittedVersion, cc-by)
Funders
  • Ministerio de Ciencia e Innovación (PID2021-122899OB-C21, C-22, PID2021-122899OB-C21)
  • European Regional Development Fund (MCIN/AEI/10)
  • Agencia Estatal de Investigación (13039, 10.13039, AEI/10)
Topics
  • Life Sciences › Immunology and Microbiology › Applied Microbiology and Biotechnology › Microbial Natural Products and Biosynthesis
  • Life Sciences › Agricultural and Biological Sciences › Plant Science › Fungal Plant Pathogen Control
  • Life Sciences › Biochemistry, Genetics and Molecular Biology › Molecular Biology › Plant biochemistry and biosynthesis
Keywords
Botrytis cinerea, sesquiterpene cyclase, fungal secondary metabolism, gene co-regulation, oxidative stress resistance, reactive oxygen species, virulence, polyketides, abscisic acid, knockout mutants
MeSH terms
Fungal Proteins, Sesquiterpenes, Gene Expression Regulation, Fungal, Oxidative Stress, Carbon-Carbon Lyases, Botrytis

About these checks

Registry, retraction, Cites and statistics results are computed, not judged, with one exception: a printed reference that no index lists is read once by a model before it counts as a citation error. Claims are extracted by a model and kept only when their quote appears verbatim in the text; each cited source is then checked, with a model’s help, for whether it says what the claim relies on. Those verdicts can be wrong — read the claim’s quote and the cited source before relying on one.

Statistics and arithmetic are recomputed, not judged.

Confidence bands are shown only for fields calibrated on our annotated test set. None is calibrated yet, so no band is shown.

What counts as a claim ›How we measure confidence ›How we check this ›

Are you an author, or do you see a problem with this page? Request a review

Data sources

Bibliographic data: Semantic Scholar, OpenAlex, Crossref.

Contains information from the Semantic Scholar Academic Graph Datasets, made available under the ODC Attribution License (ODC-BY 1.0).

Semantic Scholar’s data is described in: Kinney, R., et al. (2023). The Semantic Scholar Open Data Platform. arXiv:2301.10140.