PreprintCited by 6SARS-CoV-2 and COVID-19 ResearchProtein Structure and Dynamicsvaccines and immunoinformatics approaches

The DOI matches its Crossref record; 2 of the 2 references it cites were found in a registry or an index.

AlphaFold2 Reveals Structural Patterns of Seasonal Haplotype Diversification in SARS-CoV-2 Nucleocapsid Protein Variants

Open access
Ali, Muhammad Asif, Anollés, Gustavo Caetano-·2024·Viruses

Preprint — published as 10.3390/v16091358 · Paper page

Abstract

The COVID 19 pandemic saw the emergence of various Variants of Concern (VOCs) that took the world by storm, often replacing the ones that preceded them. The characteristic mutant constellations of these VOCs increased viral transmissibility and infectivity. Their origin and evolution remain puzzling. With the help of data mining efforts and the GISAID database, a chronology of 22 haplotypes described viral evolution up until July 23, 2023. Since the 3-dimensional atomic structures of proteins corresponding to the identified haplotypes are not available, ab initio methods were here utilized. Regions of intrinsic disorder proved to be important for viral evolution, as evidenced by the targeted change to the nucleocapsid (N) protein at the sequence, structure, and biochemical levels. The linker region of the N-protein, which binds to the RNA genome and self-oligomerizes for efficient genome packaging, was greatly impacted by mutations throughout the pandemic, followed by changes in structure and intrinsic disorder. Remarkably, VOC constellations acted cooperatively to balance the more extreme effects of individual haplotypes. Our strategy of mapping the dynamic evolutionary landscape of genetically linked mutations to the N-protein structure demonstrates the utility of ab initio modeling and deep learning tools for therapeutic intervention.

Overview

The claims and statistics of this paper haven’t been checked yet.

Run the check — free, no account needed. It reads the open-access text and checks the sources it cites.

A few free checks a day · papers already verified open instantly · results are public

Integrity signals

Registry

Crossref · 10.20944/preprints202407.0591.v1

Cites

2 of 2 references verified0 citation errors · 0 not checkable

Statistics

Figures

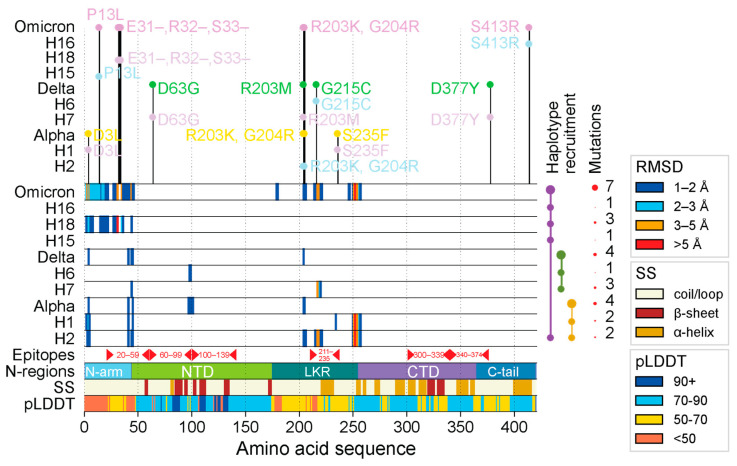
Figure 1 Regions of structural deviation. The vertical axis represents each of the haplotypes and variants, impacting the N-protein, arranged in chronological order from earliest to latest, up until the rise of VOC Omicron. The horizontal axis represents the amino acid positions along the length of each of the N-protein molecules. The horizontal bars representing the haplotypes and VOC constellations are colored in hues of light blue and thistle in an alternating fashion whereas VOCs Alpha, Delta, and Omicron are colored yellow, green, and purple, respectively. When a residue along the length of any of these protein molecules crosses the 1 Å, 2 Å, 3 Å, and 5 Å RMSD, then that position is colored in dark blue, light blue, orange, and red, respectively. The area labeled ‘epitopes’ includes residue ranges for important epitopes found along the length of the N-protein as reported by Smith et al. [58]. The horizontal bar labeled ‘N-regions’ indicates all positions of important regions/domains along the N-protein: N-arm (1–43), NTD (44–174), LKR (175–254), CTD (255–364), and C-tail (365–419). The horizontal bar labeled SS indicates the position of alpha helices (brown), beta sheets (dark red), and coils (beige). The horizontal bar labeled pLDDT represents the confidence level of AlphaFold2 for each residue along the S-protein. On top of the graph are the individual mutations that comprise each haplotype and variant.
Figure 1 Regions of structural deviation. The vertical axis represents each of the haplotypes and variants, impacting the N-protein, arranged in chronological order from earliest to latest, up until the rise of VOC Omicron. The horizontal axis represents the amino acid positions along the length of each of the N-protein molecules. The horizontal bars representing the haplotypes and VOC constellations are colored in hues of light blue and thistle in an alternating fashion whereas VOCs Alpha, Delta, and Omicron are colored yellow, green, and purple, respectively. When a residue along the length of any of these protein molecules crosses the 1 Å, 2 Å, 3 Å, and 5 Å RMSD, then that position is colored in dark blue, light blue, orange, and red, respectively. The area labeled ‘epitopes’ includes residue ranges for important epitopes found along the length of the N-protein as reported by Smith et al. [58]. The horizontal bar labeled ‘N-regions’ indicates all positions of important regions/domains along the N-protein: N-arm (1–43), NTD (44–174), LKR (175–254), CTD (255–364), and C-tail (365–419). The horizontal bar labeled SS indicates the position of alpha helices (brown), beta sheets (dark red), and coils (beige). The horizontal bar labeled pLDDT represents the confidence level of AlphaFold2 for each residue along the S-protein. On top of the graph are the individual mutations that comprise each haplotype and variant.CC BY · PubMed Central
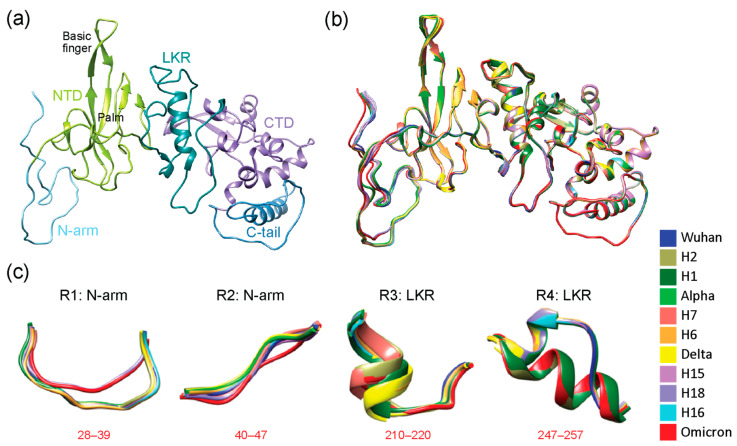
Figure 2 Three-dimensional (3D) models of molecular change at the atomic level in regions of structural deviation. (a) The N-protein modeled by local ColabFold for the Wuhan strain with its 5 structural domains color-coded as N-arm (light blue), NTD (lime green), LKR (teal), CTD (purple), and C-tail (steel blue), the same color scheme as the N-regions bar in Figure 1. Areas that saw structural deviation crossing the 3 Å threshold for each haplotype and VOC have been highlighted in red. (b) All haplotypes and VOCs were superimposed onto the Wuhan structure using Chimera and are color-coded according to the bottom-right index. (c) Using data from Figure 1, all residues that surpassed the 3 Å threshold and other regions from further inspection in Chimera were translated into 4 regions of structural deviation (R1 to R4). Model snapshots of these regions were taken in Chimera to ensure all of the superimposed structures, and their corresponding residues were adequately captured for each region. The location of regions in the amino acid sequence is indicated in red. Each variant and haplotype structure are color-coded according to the index.
Figure 2 Three-dimensional (3D) models of molecular change at the atomic level in regions of structural deviation. (a) The N-protein modeled by local ColabFold for the Wuhan strain with its 5 structural domains color-coded as N-arm (light blue), NTD (lime green), LKR (teal), CTD (purple), and C-tail (steel blue), the same color scheme as the N-regions bar in Figure 1. Areas that saw structural deviation crossing the 3 Å threshold for each haplotype and VOC have been highlighted in red. (b) All haplotypes and VOCs were superimposed onto the Wuhan structure using Chimera and are color-coded according to the bottom-right index. (c) Using data from Figure 1, all residues that surpassed the 3 Å threshold and other regions from further inspection in Chimera were translated into 4 regions of structural deviation (R1 to R4). Model snapshots of these regions were taken in Chimera to ensure all of the superimposed structures, and their corresponding residues were adequately captured for each region. The location of regions in the amino acid sequence is indicated in red. Each variant and haplotype structure are color-coded according to the index.CC BY · PubMed Central
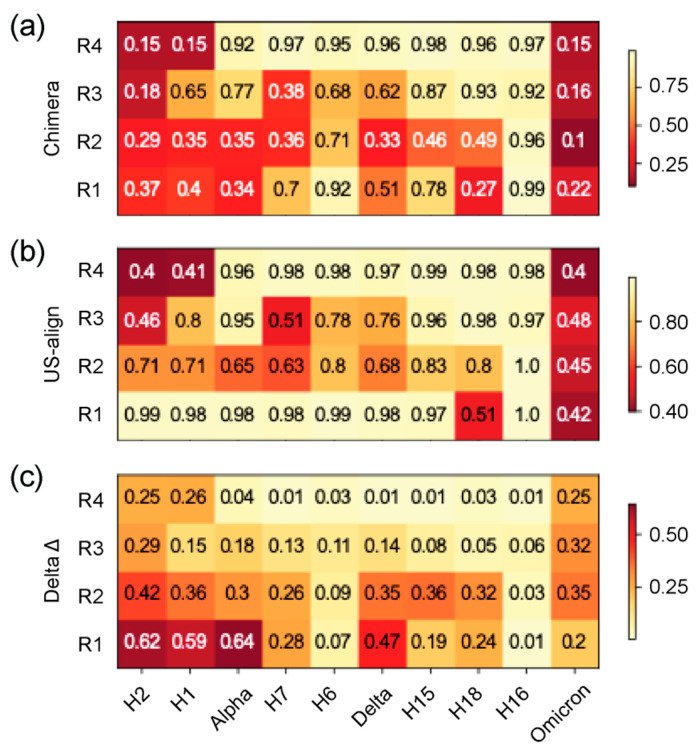
Figure 3 Heatmap of TM scores (ranging 0–1) of regions of structural domains. The 4 regions of structural deviation (R1–R4) were used to slice the corresponding regions from each file and obtain TM scores for each VOC and haplotype with US-align, using the Wuhan reference molecule as the template. The horizontal axis is arranged in chronological order depicting changes across the timeline of the pandemic, and the vertical axis represents the 5 structural domains described in Figure 3. All TM scores falling under the TM threshold of 0.5 are colored in light cream. (a) TM scores using alignments from Chimera superimposition. (b) TM scores using US-align alignments. (c) Difference between heatmaps in (a,b).
Figure 3 Heatmap of TM scores (ranging 0–1) of regions of structural domains. The 4 regions of structural deviation (R1–R4) were used to slice the corresponding regions from each file and obtain TM scores for each VOC and haplotype with US-align, using the Wuhan reference molecule as the template. The horizontal axis is arranged in chronological order depicting changes across the timeline of the pandemic, and the vertical axis represents the 5 structural domains described in Figure 3. All TM scores falling under the TM threshold of 0.5 are colored in light cream. (a) TM scores using alignments from Chimera superimposition. (b) TM scores using US-align alignments. (c) Difference between heatmaps in (a,b).CC BY · PubMed Central
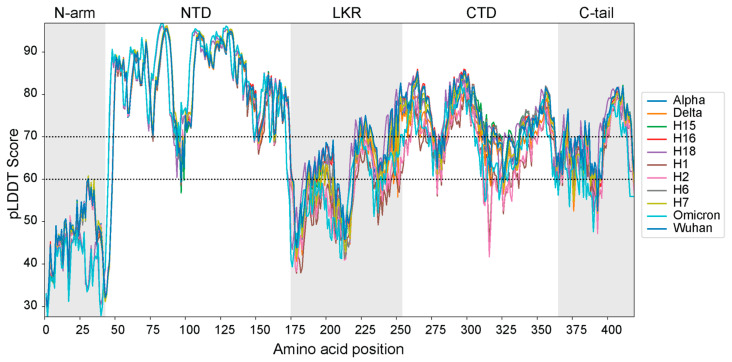
Figure 4 Per-residue pLDDT scores of each AlphaFold2 top-ranked modeled 3D structure.
Figure 4 Per-residue pLDDT scores of each AlphaFold2 top-ranked modeled 3D structure.CC BY · PubMed Central
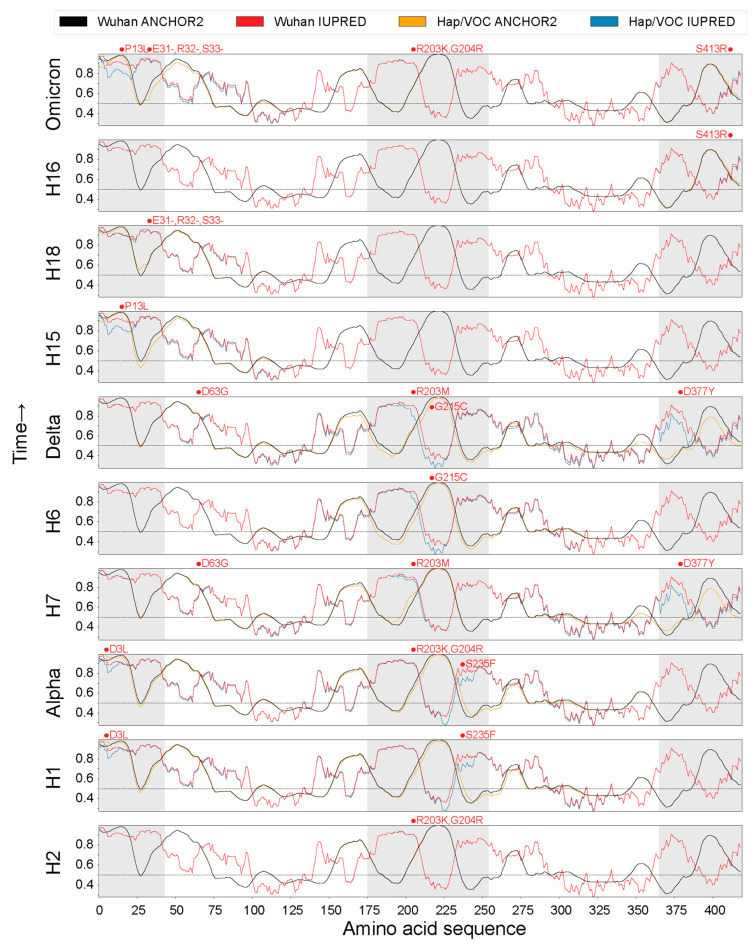
Figure 5 Intrinsic disorder and binding capability across the pandemic.
Figure 5 Intrinsic disorder and binding capability across the pandemic.CC BY · PubMed Central
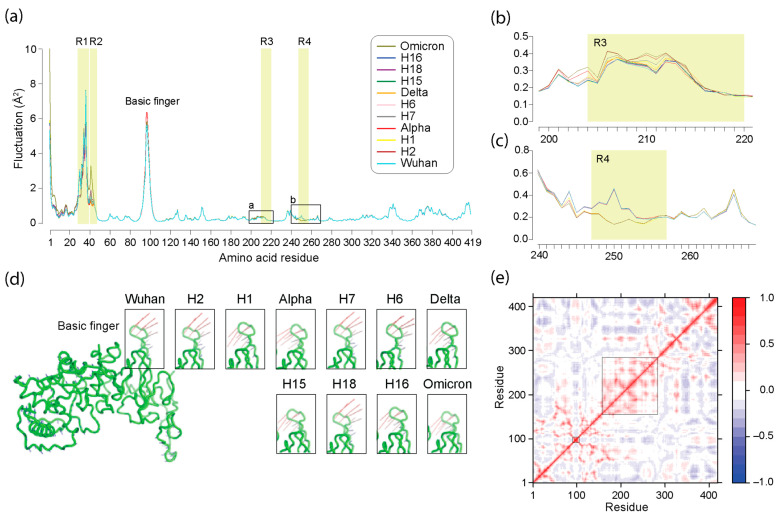
Figure 6 Normal mode analysis (NMA) of the N-protein across the pandemic. (a) Atomic fluctuation of residues mapped along the amino acid sequence of the N-protein for haplotypes and VOCs. Regions of structural change (R1, R2, R3, and R4) are shaded in light yellow, and the location of the nucleic acid-binding ‘basic finger’ is identified. (b,c) Details of plots in regions surrounding the R3 and R4 regions. (d) Visualization of the first non-trivial mode (mode 7) of the Wuhan N-protein molecule reflecting optimal energy states using a vector field representation. The most salient motion pattern in the ‘basic finger’ is highlighted and unfolded for all haplotypes and VOCs, showing notable changes in motion directionality. (e) A dynamic cross-correlation heat map for the Wuhan molecule averaged over all modes show correlated (red hues) and anti-correlated (blue hues) regions in the protein structure. Big and small boxes highlight the positively correlated LKR sequence embedding the R1 and R2 regions and the ‘basic finger’, respectively.
Figure 6 Normal mode analysis (NMA) of the N-protein across the pandemic. (a) Atomic fluctuation of residues mapped along the amino acid sequence of the N-protein for haplotypes and VOCs. Regions of structural change (R1, R2, R3, and R4) are shaded in light yellow, and the location of the nucleic acid-binding ‘basic finger’ is identified. (b,c) Details of plots in regions surrounding the R3 and R4 regions. (d) Visualization of the first non-trivial mode (mode 7) of the Wuhan N-protein molecule reflecting optimal energy states using a vector field representation. The most salient motion pattern in the ‘basic finger’ is highlighted and unfolded for all haplotypes and VOCs, showing notable changes in motion directionality. (e) A dynamic cross-correlation heat map for the Wuhan molecule averaged over all modes show correlated (red hues) and anti-correlated (blue hues) regions in the protein structure. Big and small boxes highlight the positively correlated LKR sequence embedding the R1 and R2 regions and the ‘basic finger’, respectively.CC BY · PubMed Central
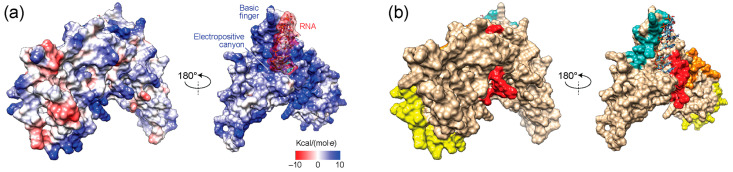
Figure 7 Electrostatic surface potentials of the modeled Wuhan reference N-protein bound to a 7 mer RNA molecule (5′-CUAAACG-3′). (a) The electrostatic (Coulomb) potential surface representation of two sides of the molecule reveals a largely electropositive molecular face with basic region largely matching the colored RNA-binding regions described in the other panels. (b) Surface representation with known RNA-binding structural elements colored in teal (basic finger of the NTD), red (SR-region of the LKR), orange (N-terminal region of the CTD embedding R3), and yellow (C-terminal region of the C-tail).
Figure 7 Electrostatic surface potentials of the modeled Wuhan reference N-protein bound to a 7 mer RNA molecule (5′-CUAAACG-3′). (a) The electrostatic (Coulomb) potential surface representation of two sides of the molecule reveals a largely electropositive molecular face with basic region largely matching the colored RNA-binding regions described in the other panels. (b) Surface representation with known RNA-binding structural elements colored in teal (basic finger of the NTD), red (SR-region of the LKR), orange (N-terminal region of the CTD embedding R3), and yellow (C-terminal region of the C-tail).CC BY · PubMed Central
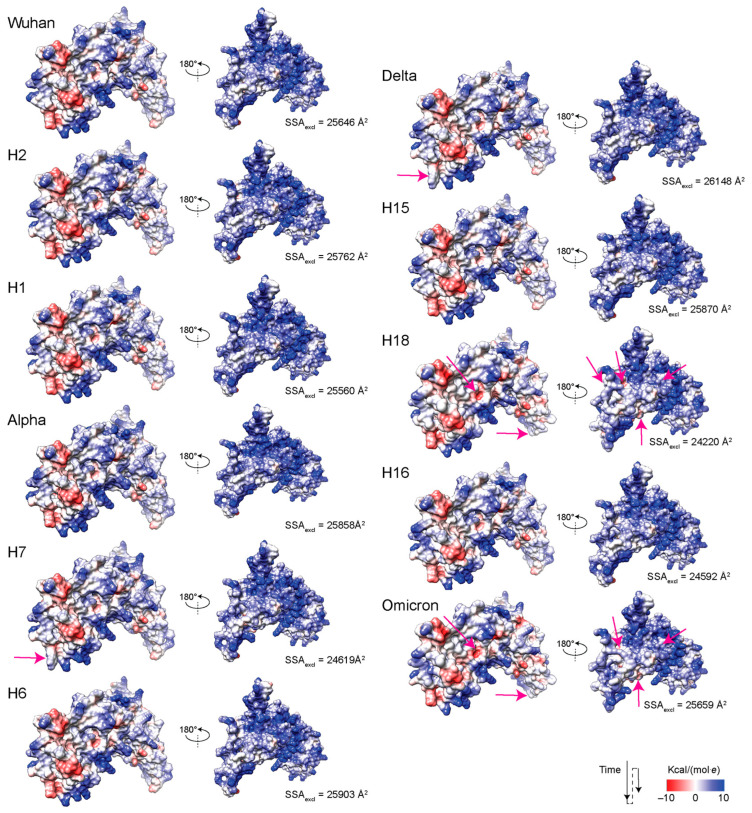
Figure 8 Electrostatic surface potentials of the N-protein from haplotypes and VOCs. Areas exhibiting electrostatic change are indicated with pink arrows. SSAexcl, solvent excluded surface area.
Figure 8 Electrostatic surface potentials of the N-protein from haplotypes and VOCs. Areas exhibiting electrostatic change are indicated with pink arrows. SSAexcl, solvent excluded surface area.CC BY · PubMed Central

Verification

Claims the paper makes

The claims and statistics of this paper haven’t been checked yet.

Run the check — free, no account needed. It reads the open-access text and checks the sources it cites.

A few free checks a day · papers already verified open instantly · results are public

Self-check

Percentages, sums and reported differences re-computed from the paper’s own numbers.

The self-check needs the paper’s full text.

Citations

Cites

Show all 2 references

Metadata

Authors
Ali, M. A., & Anollés, G. C.
Affiliations
University of Illinois Urbana-Champaign (US)
Venue
Viruses
Publisher
MDPI AG
Published
2024-07-08
Volume
16
Issue
9
Pages
1358-1358
ISSN
1999-4915 (ISSN-L)
OpenAlex
W4401868813
Cited by
6
References
2
Citations by year
2026: 1 · 2025: 3 · 2024: 2
FWCI
2.08
Type
journal article
Language
en
Open access
Locations
  • Viruses (publishedVersion, cc-by)
  • Preprints.org (acceptedVersion, cc-by)
  • PubMed Central (publishedVersion, cc-by)
  • PubMed (publishedVersion)
  • DOAJ (DOAJ: Directory of Open Access Journals) (submittedVersion)
Funders
  • National Centre for Supercomputing Applications
  • University of Illinois at Urbana-Champaign
  • National Institute of Food and Agriculture (ILLU-802-909, ILLU-483-625)
  • College of Agricultural, Consumer and Environmental Sciences, University of Illinois at Urbana-Champaign
Topics
  • Health Sciences › Medicine › Infectious Diseases › SARS-CoV-2 and COVID-19 Research
  • Life Sciences › Biochemistry, Genetics and Molecular Biology › Molecular Biology › Protein Structure and Dynamics
  • Life Sciences › Biochemistry, Genetics and Molecular Biology › Molecular Biology › vaccines and immunoinformatics approaches
Keywords
SARS-CoV-2, nucleocapsid protein, variants of concern, seasonal evolution, intrinsically disordered regions, protein structure, ab initio protein structure prediction, AlphaFold2, viral evolution, genome packaging, therapeutic target
MeSH terms
COVID-19, SARS-CoV-2, Coronavirus Nucleocapsid Proteins, Haplotypes, Humans, Models, Molecular, Mutation, Phosphoproteins, Protein Conformation, Seasons, Evolution, Molecular, Nucleocapsid Proteins

About these checks

Registry, retraction, Cites and statistics results are computed, not judged, with one exception: a printed reference that no index lists is read once by a model before it counts as a citation error. Claims are extracted by a model and kept only when their quote appears verbatim in the text; each cited source is then checked, with a model’s help, for whether it says what the claim relies on. Those verdicts can be wrong — read the claim’s quote and the cited source before relying on one.

Statistics and arithmetic are recomputed, not judged.

Confidence bands are shown only for fields calibrated on our annotated test set. None is calibrated yet, so no band is shown.

What counts as a claim ›How we measure confidence ›How we check this ›

Are you an author, or do you see a problem with this page? Request a review

How to cite

Cite CoChat for the checks on this page, and the paper for its own findings.

This page
CoChat. (2026). Citation check: AlphaFold2 Reveals Structural Patterns of Seasonal Haplotype Diversification in SARS-CoV-2 Nucleocapsid Protein Variants. https://app.cochat.ai/papers/10.20944/preprints202407.0591.v1
The paper
Ali, M. A., & Anollés, G. C. (2024). AlphaFold2 Reveals Structural Patterns of Seasonal Haplotype Diversification in SARS-CoV-2 Nucleocapsid Protein Variants. Viruses. https://doi.org/10.20944/preprints202407.0591.v1