Student or educator? Sign up with your school email and get 6 months of Pro free.
PreprintCited by 7Galectins and Cancer BiologyGlycosylation and Glycoproteins ResearchMarine Sponges and Natural Products

The DOI matches its Crossref record; 1 of the 1 references it cites were found in a registry or an index.

Novel Galectins Purified from the Sponge Chondrilla australiensis: Unique Structural Features and Cytotoxic Effects on Colorectal Cancer Cells Mediated by TF-Antigen Binding

Open access

Preprint — published as 10.3390/md22090400 · Paper page

Abstract

We here report the purification of a novel member of the galectin family, the β-Galactoside-binding lectin hRTL, from the marine sponge Chondrilla australiensis. The hRTL lectin is a tetrameric proto-type galectin with a subunit molecular weight of 15.5 kDa, consisting of 141 amino acids and sharing 92% primary sequence identity with the galectin CCL from the congeneric species C. caribensis. Transcriptome analysis allowed the identification of additional sequences belonging to the same family, bringing the total number of hRTLs to six. Unlike most other galectins, hRTLs display a 23 amino acids long signal peptide that, according to Erdman degradation, is post-translationally cleaved, leaving a N-terminal end devoid of acetylated modifications, unlike most other galectins. Moreover, two hRTLs display an internal insertion, which determines the presence of an unusual loop region that may have important functional implications. The characterization of the glycan binding properties of hRTL revealed that it had high affinity to-wards TF-antigen, sialyl TF, and type-1 N-acetyl lactosamine with a Galβ1-3 structure. When administered to DLD-1 cells, a colorectal carcinoma cell line expressing mucin-associated TF-antigen, hRTL could induce glycan-dependent cell death by activating MAP kinases, thereby inhibiting cancer cell proliferation.

Overview

The claims and statistics of this paper haven’t been checked yet.

Run the check — free, no account needed. It reads the open-access text and checks the sources it cites.

A few free checks a day · papers already verified open instantly · results are public

Integrity signals

Registry

Crossref · 10.20944/preprints202408.1474.v1

Cites

1 of 1 references verified0 citation errors · 0 not checkable

Statistics

Figures

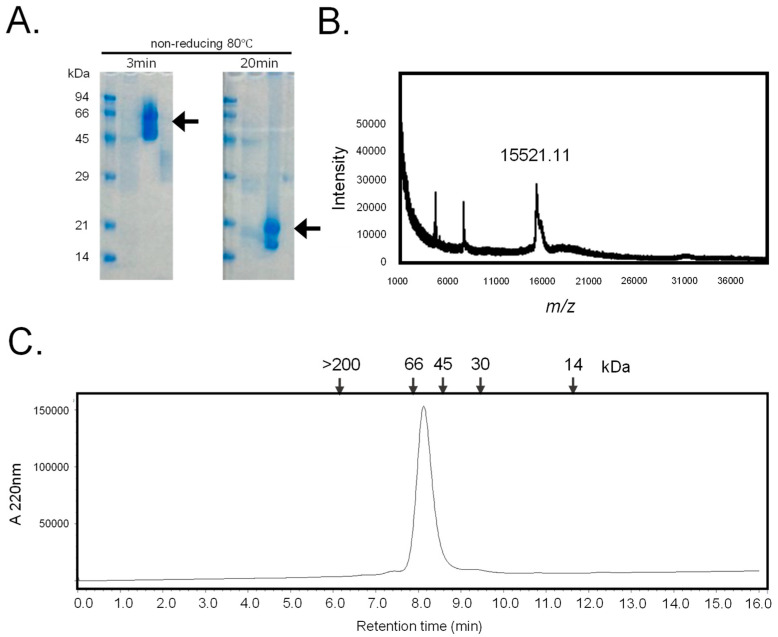
Figure 1 Purification of hRTL. (A) The SDS-PAGE pattern obtained after 3 min and 20 min of heating under non-reducing conditions. Numbers on the left indicate the molecular mass (kDa) of marker proteins. Arrows mark the positions of the lectins. (B) Mass spectrometry of hRTL. The MALDI–TOF-MS spectrum showed a molecular mass of 15,521.11 Da. One hundred laser shots measured the signal. (C) The gel permeation chromatography pattern. The purified lectin was applied on a Shodex KW 402.5-4F column connected to an HPLC pump at a flow rate of 0.33 mL/min. Numbers in the upper part indicate the following standard molecular markers: blue dextran (>200 kDa); bovine serum albumin (66 kDa); ovalbumin (45 kDa); carbonic anhydrase (30 kDa); horse myoglobin (14 kDa). The absorbance was detected at 220 nm.
Figure 1 Purification of hRTL. (A) The SDS-PAGE pattern obtained after 3 min and 20 min of heating under non-reducing conditions. Numbers on the left indicate the molecular mass (kDa) of marker proteins. Arrows mark the positions of the lectins. (B) Mass spectrometry of hRTL. The MALDI–TOF-MS spectrum showed a molecular mass of 15,521.11 Da. One hundred laser shots measured the signal. (C) The gel permeation chromatography pattern. The purified lectin was applied on a Shodex KW 402.5-4F column connected to an HPLC pump at a flow rate of 0.33 mL/min. Numbers in the upper part indicate the following standard molecular markers: blue dextran (>200 kDa); bovine serum albumin (66 kDa); ovalbumin (45 kDa); carbonic anhydrase (30 kDa); horse myoglobin (14 kDa). The absorbance was detected at 220 nm.CC BY · PubMed Central
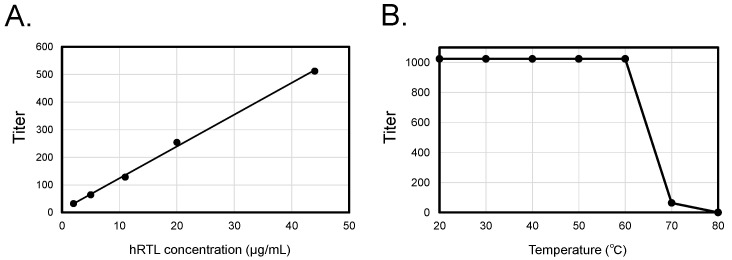
Figure 2 Concentration-dependent enhancement and thermal stability of hRTL hemagglutination activity. Co-relationship between concentrations, hemagglutination (A), and thermotolerance (B) of hRTL.
Figure 2 Concentration-dependent enhancement and thermal stability of hRTL hemagglutination activity. Co-relationship between concentrations, hemagglutination (A), and thermotolerance (B) of hRTL.CC BY · PubMed Central
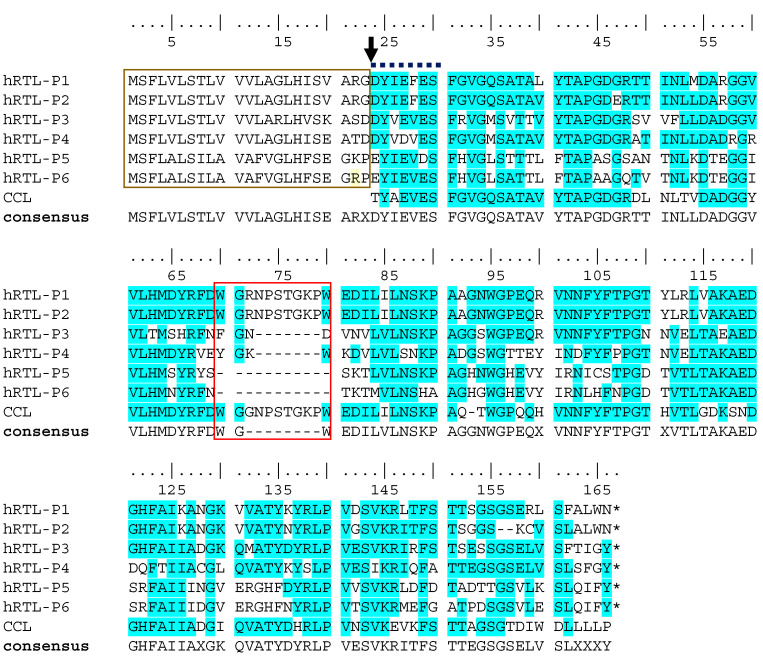
Figure 3 Multiple sequence alignment of the six hRTLs identified in the C. australiensis transcriptome. CCL indicates the lectin previously described in C. calibensis [10]. Two peculiar sequence features of hRTLs are marked with a gold box (the extension located upstream of the N-terminal end determined by Edman degradation) and a red box (the hRTL-P1-, hRTL-P2-, and CCL-specific insertion). An arrow indicates the position of the N-terminal end of the mature protein determined by Edman degradation. A bold dashed line indicates the partial sequence determined by Edman degradation. Conserved amino acids in the multiple sequence alignment are highlighted with a blue background. The numbering of amino acids starts from the N-terminus at the top. Sequence gaps are indicated by dashes (-). X indicates the presence of any amino acid in the sequence consensus.
Figure 3 Multiple sequence alignment of the six hRTLs identified in the C. australiensis transcriptome. CCL indicates the lectin previously described in C. calibensis [10]. Two peculiar sequence features of hRTLs are marked with a gold box (the extension located upstream of the N-terminal end determined by Edman degradation) and a red box (the hRTL-P1-, hRTL-P2-, and CCL-specific insertion). An arrow indicates the position of the N-terminal end of the mature protein determined by Edman degradation. A bold dashed line indicates the partial sequence determined by Edman degradation. Conserved amino acids in the multiple sequence alignment are highlighted with a blue background. The numbering of amino acids starts from the N-terminus at the top. Sequence gaps are indicated by dashes (-). X indicates the presence of any amino acid in the sequence consensus.CC BY · PubMed Central
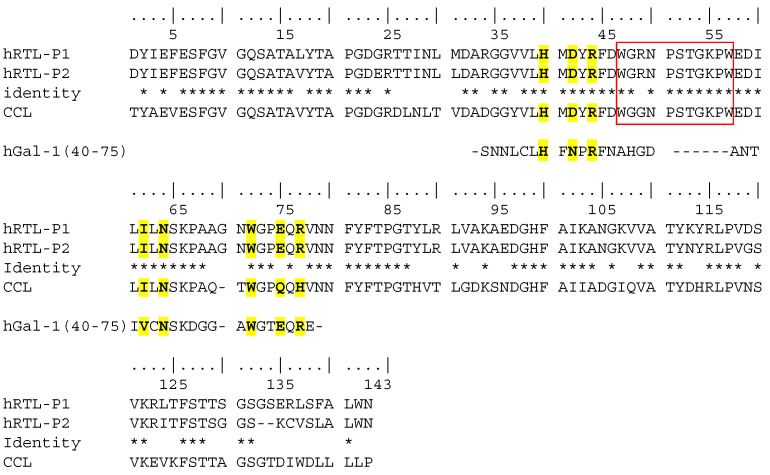
Figure 4 Comparison among the primary sequences of hRTL-P1, P2, and the proto-type C. caribensis galectin CCL represents the mature protein sequence only (i.e., after proteolytic cleavage of the signal peptide). Deduced conserved glycan-binding sites are marked in yellow compared to human galectin-1 (hGal-1) [26]. Identical amino acids among hRTL-P1, hRTL-P2 and CCL are indicated by *.
Figure 4 Comparison among the primary sequences of hRTL-P1, P2, and the proto-type C. caribensis galectin CCL represents the mature protein sequence only (i.e., after proteolytic cleavage of the signal peptide). Deduced conserved glycan-binding sites are marked in yellow compared to human galectin-1 (hGal-1) [26]. Identical amino acids among hRTL-P1, hRTL-P2 and CCL are indicated by *.CC BY · PubMed Central
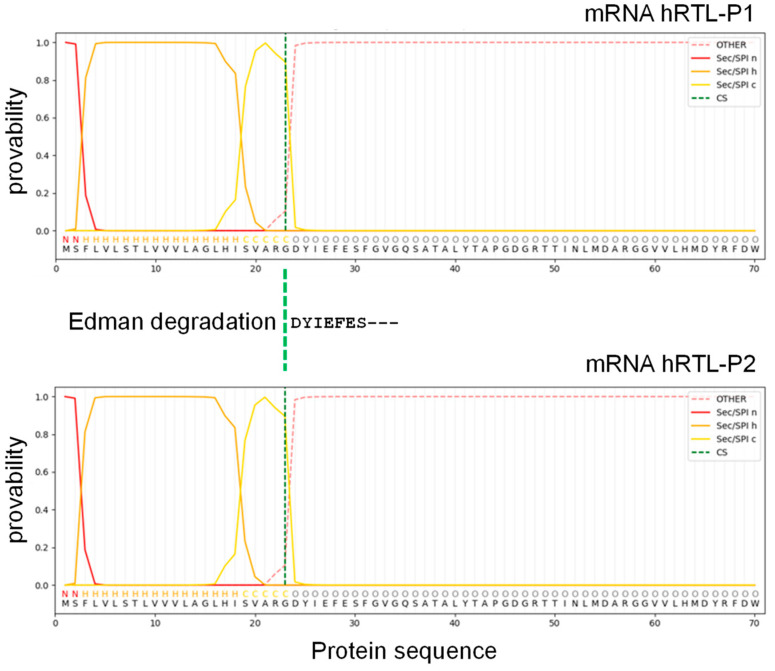
Figure 5 Signal peptide sequence prediction of hRTL. The mRNA sequence was assigned to SignalP 6.0 software. N (red), H (orange), and C (yellow) mean N-region, H-region, and C-region of the signal sequence, respectively.
Figure 5 Signal peptide sequence prediction of hRTL. The mRNA sequence was assigned to SignalP 6.0 software. N (red), H (orange), and C (yellow) mean N-region, H-region, and C-region of the signal sequence, respectively.CC BY · PubMed Central
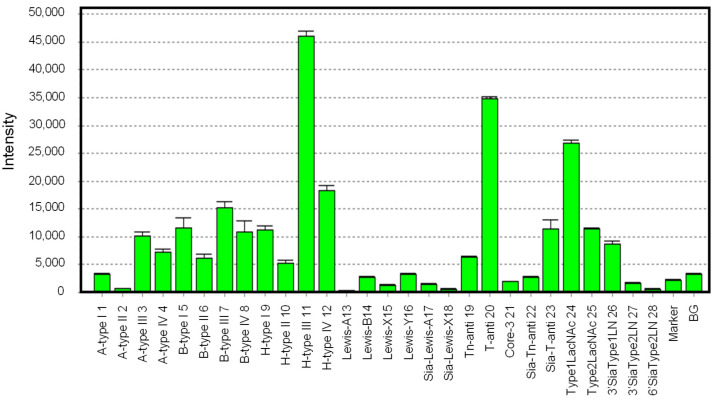
Figure 6 Glycan-binding profile of hRTL. Cy3-labeled hRTL was subjected to glycan array analysis combining a glycan-conjugated array with 28 immobilized glycan structures and a surface plasmon resonance scanning detector (the numbering in the X-axis is the same as in Supplementary Table S1). The evanescent-field fluorescence occurring by the binding between Cy3-hRTL and the glycans is represented as a net intensity (Y-axis of the graph). BG: background.
Figure 6 Glycan-binding profile of hRTL. Cy3-labeled hRTL was subjected to glycan array analysis combining a glycan-conjugated array with 28 immobilized glycan structures and a surface plasmon resonance scanning detector (the numbering in the X-axis is the same as in Supplementary Table S1). The evanescent-field fluorescence occurring by the binding between Cy3-hRTL and the glycans is represented as a net intensity (Y-axis of the graph). BG: background.CC BY · PubMed Central
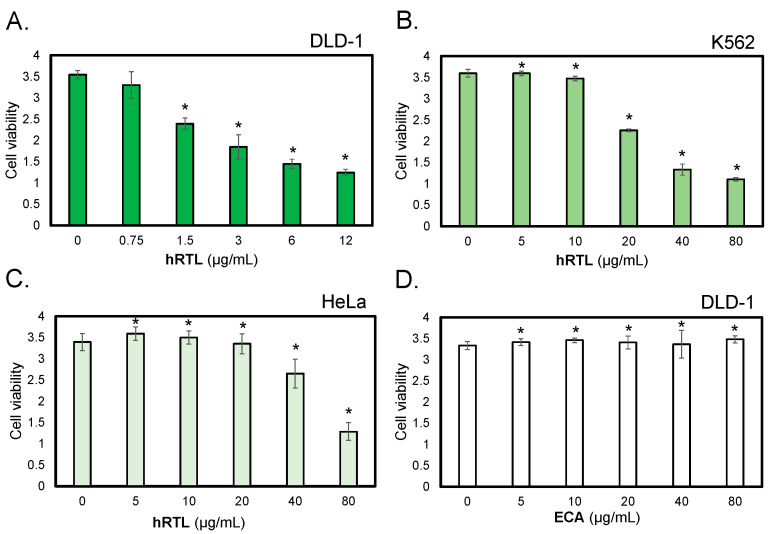
Figure 7 The cytotoxic effects of hRTL against TF-antigen-positive cells. The cytotoxic effects of lectins were evaluated on human colorectal carcinoma cells (DLD-1, panels (A,D)), human leukemic cells (K562, panel (B)), and human ovarian cancer cells (HeLa, panel (C)). Cells were treated with hRTL (A–C) or ECA (D); a negative control provided by a lectin that binds to type-1/2 LacNAc at various concentrations (0–80 µg/mL) for 24 h, and cell viability was determined by WST-8 assay. The data shown are the mean ± SE (n = 3). p values (* p < 0.05).
Figure 7 The cytotoxic effects of hRTL against TF-antigen-positive cells. The cytotoxic effects of lectins were evaluated on human colorectal carcinoma cells (DLD-1, panels (A,D)), human leukemic cells (K562, panel (B)), and human ovarian cancer cells (HeLa, panel (C)). Cells were treated with hRTL (A–C) or ECA (D); a negative control provided by a lectin that binds to type-1/2 LacNAc at various concentrations (0–80 µg/mL) for 24 h, and cell viability was determined by WST-8 assay. The data shown are the mean ± SE (n = 3). p values (* p < 0.05).CC BY · PubMed Central
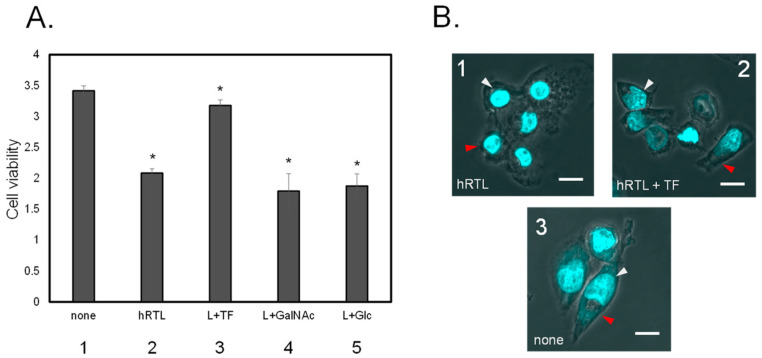
Figure 8 (A) Inhibition of cytotoxic effect of 3 µg/mL hRTL on DLD-1. Without (1) or with (2) hRTL (10 µg/mL). Co-presence of TF-antigen, GalNAc, or Glc (each 20 mM: 3–5). All data are reported as mean ± SE (n = 3). * p < 0.05. (B) The morphological appearance of the cells in presence (1 and 2) or absence (3) of the hRTL lectin, the simultaneous presence of 20 mM TF-antigen and hRTL (2). Cell shrinkage and extensions are indicated by red arrows, whereas nucleus condensation is shown with white arrows. Magnification: 40×. Scale bar: 10 µm.
Figure 8 (A) Inhibition of cytotoxic effect of 3 µg/mL hRTL on DLD-1. Without (1) or with (2) hRTL (10 µg/mL). Co-presence of TF-antigen, GalNAc, or Glc (each 20 mM: 3–5). All data are reported as mean ± SE (n = 3). * p < 0.05. (B) The morphological appearance of the cells in presence (1 and 2) or absence (3) of the hRTL lectin, the simultaneous presence of 20 mM TF-antigen and hRTL (2). Cell shrinkage and extensions are indicated by red arrows, whereas nucleus condensation is shown with white arrows. Magnification: 40×. Scale bar: 10 µm.CC BY · PubMed Central
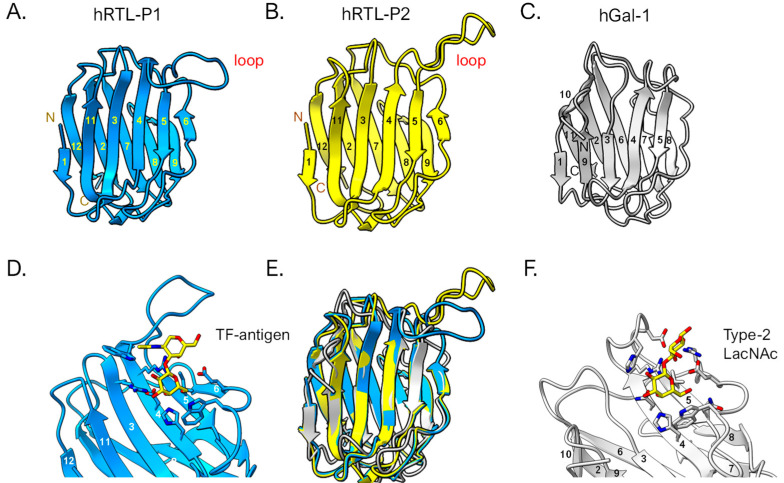
Figure 9 3D structural prediction of hRTLs. hRTL-P1 (A) and hRTL-P2 (B). hGal-1 (human galectin-1) is also shown as a comparison (C). The binding between hRTL-P1 and TF-antigen (D), and hGal-1 and LacNAc (F), respectively. A superimposed view among hRTL-P1, hRTL-P2, and hGal-1 (E). The loops found in the two Chondrilla galectins (upper right blue and yellow in panels (A,B)) were unique characteristics of these hRTLs. Numbers are responding to the order of β-sheets in the polypeptide.
Figure 9 3D structural prediction of hRTLs. hRTL-P1 (A) and hRTL-P2 (B). hGal-1 (human galectin-1) is also shown as a comparison (C). The binding between hRTL-P1 and TF-antigen (D), and hGal-1 and LacNAc (F), respectively. A superimposed view among hRTL-P1, hRTL-P2, and hGal-1 (E). The loops found in the two Chondrilla galectins (upper right blue and yellow in panels (A,B)) were unique characteristics of these hRTLs. Numbers are responding to the order of β-sheets in the polypeptide.CC BY · PubMed Central

Verification

Claims the paper makes

The claims and statistics of this paper haven’t been checked yet.

Run the check — free, no account needed. It reads the open-access text and checks the sources it cites.

A few free checks a day · papers already verified open instantly · results are public

Self-check

Percentages, sums and reported differences re-computed from the paper’s own numbers.

The self-check needs the paper’s full text.

Citations

Cites

Metadata

Authors
Hayashi, R., Kamata, K., Gerdol, M., Fujii, Y., Hayashi, T., Onoda, Y., Kobayashi, N., Furushima, S., Ishiwata, R., Ohkawa, M., Masuda, N., Niimi, Y., Yamada, M., Adachi, D., Kawsar, S. M. A., Rajia, S., Hasan, I., Padma, S., Chatterjee, B. P., Ise, Y., Chida, R., Hasehira, K., Miyanishi, N., Kawasaki, T., Ogawa, Y., Fujita, H., Pallavicini, A., & Ozeki, Y.
Affiliations
  • Yokohama City University (JP)
  • University of Trieste (IT)
  • Nagasaki International University (JP)
  • University of Chittagong (BD)
  • Varendra University (BD)
  • University of Rajshahi (BD)
  • Chittaranjan National Cancer Institute (IN)
  • Toyo University (JP)
Corresponding author
  • Fujii, Yuki
  • Ozeki, Yasuhiro
Venue
Marine Drugs
Publisher
MDPI AG
Published
2024-08-21
Volume
22
Issue
9
Pages
400-400
ISSN
1660-3397 (ISSN-L)
OpenAlex
W4402130292
Cited by
7
References
1
Citations by year
2026: 3 · 2025: 4
FWCI
1.16
Type
journal article
Language
en
Open access
Locations
  • Marine Drugs (publishedVersion, cc-by)
  • Preprints.org (acceptedVersion, cc-by)
  • PubMed Central (publishedVersion, cc-by)
  • PubMed (publishedVersion)
  • ArTS Archivio della ricerca di Trieste (University of Trieste https://www.units.it/) (submittedVersion, cc-by)
  • Lirias (KU Leuven) (submittedVersion, cc-by)
  • DOAJ (DOAJ: Directory of Open Access Journals) (submittedVersion, cc-by-sa)
Funders
  • European Commission (ECS00000043, 23/06/ 2022, 1058 23/06/202 2)
  • Ministry of Education, Culture, Sports, Science and Technology
  • Japan Society for the Promotion of Science (YT2024-1050, ECS00000043, 24K08716, 24K21996, FY2024 E-26, 24K15170, D.D. 1058 23/06/2022, 24K06239, 23K06190, 23K10950)
  • Canadian Glycomics Network
Topics
  • Life Sciences › Immunology and Microbiology › Immunology › Galectins and Cancer Biology
  • Life Sciences › Biochemistry, Genetics and Molecular Biology › Molecular Biology › Glycosylation and Glycoproteins Research
  • Life Sciences › Biochemistry, Genetics and Molecular Biology › Biotechnology › Marine Sponges and Natural Products
Keywords
galectins, signal peptide, post-translational cleavage, glycan binding specificity, TF antigen, N-acetyllactosamine, colorectal cancer cells, DLD-1 cells, lectin purification, gene expression profiling
MeSH terms
Amino Acid Sequence, Amino Sugars, Animals, Antineoplastic Agents, Humans, Porifera, Colorectal Neoplasms, Antigens, Tumor-Associated, Carbohydrate, Galectins, Cell Line, Tumor

About these checks

Registry, retraction, Cites and statistics results are computed, not judged, with one exception: a printed reference that no index lists is read once by a model before it counts as a citation error. Claims are extracted by a model and kept only when their quote appears verbatim in the text; each cited source is then checked, with a model’s help, for whether it says what the claim relies on. Those verdicts can be wrong — read the claim’s quote and the cited source before relying on one.

Statistics and arithmetic are recomputed, not judged.

Confidence bands are shown only for fields calibrated on our annotated test set. None is calibrated yet, so no band is shown.

What counts as a claim ›How we measure confidence ›How we check this ›

Are you an author, or do you see a problem with this page? Request a review

Data sources

Bibliographic data: Semantic Scholar, OpenAlex, Crossref.

Contains information from the Semantic Scholar Academic Graph Datasets, made available under the ODC Attribution License (ODC-BY 1.0).

Semantic Scholar’s data is described in: Kinney, R., et al. (2023). The Semantic Scholar Open Data Platform. arXiv:2301.10140.