CoChat

Transcriptome and proteome profiling reveal complementary scavenger and immune features of rat liver sinusoidal endothelial cells and liver macrophages

Open access

Preprint — published as 10.1186/s12860-020-00331-9

The DOI matches its Crossref record; 1 of the 1 references it cites were found in a registry or an index.

Abstract

Background: Liver sinusoidal endothelial cells (LSECs) and Kupffer cells (KCs; liver resident macrophages) form the body´s most effective scavenger cell system for removal of harmful blood-borne substances, ranging from modified own proteins to pathogens and xenobiotics. Controversies in the literature regarding the LSEC phenotype pose a challenge when determining distinct functionalities of KCs and LSECs. This may be due to overlapping functions of the two cells, insufficient purification and/or identification of the cells, rapid dedifferentiation of LSECs in vitro, or species differences. We therefore characterized and quantitatively compared expressed gene products of freshly isolated, highly pure LSECs (fenestrated SE-1/FcγRIIb2 + ) and KCs (CD11b/c + ) from Sprague Dawley, Crl:CD(SD), male rats using high throughput mRNA-sequencing and label-free proteomics. Results: We observed a robust correlation between the proteomes and transcriptomes of the two cell types. Integrative analysis of the global molecular profile demonstrated the immunological aspects of LSEC. The constitutive expression of several immune genes and corresponding proteins of LSECs bore resemblance with the expression in macrophages. LSECs and KCs both expressed high levels of scavenger receptors (SR) and C-type lectins. Equivalent expression of SR-A1 (Msr1), mannose receptor (Mrc1), SR-B1 (Scarb1), and SR-B3 (Scarb2) suggested functional similarity between the two cell types, while functional distinction between the cells was evidenced by LSEC-specific expression of the SRs stabilin-1 (Stab1) and stabilin-2 (Stab2), and the C-type lectins LSECtin (Clec4g) and DC-SIGNR (Clec4m). Many immune regulatory factors were differentially expressed between LSECs and KCs, with one cell predominantly expressing a specific cytokine/chemokine and the other cell the cognate receptor, illustrating the complex cytokine milieu of the sinusoids. Both cells expressed genes and proteins involved in antigen processing and presentation, and lymphocyte co-stimulation. Conclusions: Our findings support complementary and partly overlapping scavenging and immune functions of LSECs and KCs. This highlights the importance of including LSECs in studies of liver immunity, and liver clearance and toxicity of large molecule drugs and nano-formulations.

Overview

The claims and statistics of this paper haven’t been checked yet.

Free: it reads the open-access text and checks the first 5 claims that cite a source we can check. Create a free account to check every claim.

A few free checks a day · papers already verified open instantly · results are public

Integrity signals

Registry

Crossref · 10.21203/rs.2.24396/v1

Cites

1 of 1 references verified0 citation errors · 0 not checkable

Statistics

Figures

Fig. 1 Overview of experimental workflows and cell purity tests. a. Schematic overview of the high-throughput transcriptomics and label-free proteomics workflows. b. Purity of SE-1-MACS-isolated liver sinusoidal endothelial cells (LSECs) and CD11b/c-MACS-isolated Kupffer cells (KCs). Cell isolates were analyzed by scanning electron microscopy (EM) (LSECs: n = 6, including all cell isolates for proteomics and RNA sequencing; KCs: n = 4, including all isolates for proteomics), and immune cytochemistry (KC: n = 4, LSEC: n = 3, including all cell isolates for proteomics). Results are presented as % of total cell count (mean ± standard deviation). Antibodies (Table 1) targeted either stabilin-2 (LSEC marker), SE-1/FcγRIIb2 (LSEC marker), CD11b/c (KC marker), or glial fibrillar acidic protein (GFAP, stellate cell marker). N.d., not determined. c-d. Scanning electron micrographs showing the typical morphology of MACS-isolated cells. Insert in c shows LSEC fenestrations (hallmark of LSECs), which were absent in KCs (d). e. Expression level of marker genes for LSECs, KCs, and hepatic stellate cells (HSC) in the KC and LSEC transcriptomes and proteomes. Expression values are given as RPKM (RNA-seq), and iBAQ (label-free proteomics), as described in Methods
Fig. 1 Overview of experimental workflows and cell purity tests. a. Schematic overview of the high-throughput transcriptomics and label-free proteomics workflows. b. Purity of SE-1-MACS-isolated liver sinusoidal endothelial cells (LSECs) and CD11b/c-MACS-isolated Kupffer cells (KCs). Cell isolates were analyzed by scanning electron microscopy (EM) (LSECs: n = 6, including all cell isolates for proteomics and RNA sequencing; KCs: n = 4, including all isolates for proteomics), and immune cytochemistry (KC: n = 4, LSEC: n = 3, including all cell isolates for proteomics). Results are presented as % of total cell count (mean ± standard deviation). Antibodies (Table 1) targeted either stabilin-2 (LSEC marker), SE-1/FcγRIIb2 (LSEC marker), CD11b/c (KC marker), or glial fibrillar acidic protein (GFAP, stellate cell marker). N.d., not determined. c-d. Scanning electron micrographs showing the typical morphology of MACS-isolated cells. Insert in c shows LSEC fenestrations (hallmark of LSECs), which were absent in KCs (d). e. Expression level of marker genes for LSECs, KCs, and hepatic stellate cells (HSC) in the KC and LSEC transcriptomes and proteomes. Expression values are given as RPKM (RNA-seq), and iBAQ (label-free proteomics), as described in MethodsCC BY · PubMed Central
Fig. 2 Immune histochemistry of acetone-fixed frozen rat liver sections. The sections were double immune-labeled with primary antibodies against a-b) stabilin-2 (STAB2; green fluorescence), and FcγRIIb2 (SE-1; red fluorescence), or against c) stabilin-2 (STAB2; green fluorescence), and CD11b/c (red fluorescence). Antibodies are listed in Table 1. Pv, portal vein. Nuclei were stained with DAPI (blue fluorescence in overlay images)
Fig. 2 Immune histochemistry of acetone-fixed frozen rat liver sections. The sections were double immune-labeled with primary antibodies against a-b) stabilin-2 (STAB2; green fluorescence), and FcγRIIb2 (SE-1; red fluorescence), or against c) stabilin-2 (STAB2; green fluorescence), and CD11b/c (red fluorescence). Antibodies are listed in Table 1. Pv, portal vein. Nuclei were stained with DAPI (blue fluorescence in overlay images)CC BY · PubMed Central
Fig. 3 Global characterization and comparison of the LSEC and KC transcriptome and proteome datasets. a. Principal component analysis (PCA) plot displaying distinct clusters of the LSEC and KC samples in transcriptome and proteome datasets created by high-throughput mRNA sequencing (RNA-seq), and label-free proteomics (LFP). PCA plots are generated from normalized log2 expression values (RPKM for RNA-seq, and iBAQ for LFP). b. Venn diagrams illustrating the number of gene products identified in the respective experiments (RNA-seq, LFP), and their overlap. c. Scatter plots illustrating the global correlation between the RNA-seq data and the LFP data. Results for LSECs and KCs are shown separately. d. Volcano-plot illustrating differently expressed genes. Blue dots: significantly higher expression in LSECs; red dots: significantly higher expression in KCs; gray dots: not significantly different between LSECs and KCs. Significance level: FDR ≤ 0.05 and |log2 fold change| ≥ 1. e. Scatter plot showing correlation of KC vs. LSEC log2 fold change values for all features expressed in both the transcriptome and proteome datasets. The r value of 0.74 indicates that approximately two thirds of the gene products are consistently significantly differentially expressed between LSECs and KCs with respect to mRNA and protein expression (FDR ≤ 0.05 and |log2 fold change| ≥ 1)
Fig. 3 Global characterization and comparison of the LSEC and KC transcriptome and proteome datasets. a. Principal component analysis (PCA) plot displaying distinct clusters of the LSEC and KC samples in transcriptome and proteome datasets created by high-throughput mRNA sequencing (RNA-seq), and label-free proteomics (LFP). PCA plots are generated from normalized log2 expression values (RPKM for RNA-seq, and iBAQ for LFP). b. Venn diagrams illustrating the number of gene products identified in the respective experiments (RNA-seq, LFP), and their overlap. c. Scatter plots illustrating the global correlation between the RNA-seq data and the LFP data. Results for LSECs and KCs are shown separately. d. Volcano-plot illustrating differently expressed genes. Blue dots: significantly higher expression in LSECs; red dots: significantly higher expression in KCs; gray dots: not significantly different between LSECs and KCs. Significance level: FDR ≤ 0.05 and |log2 fold change| ≥ 1. e. Scatter plot showing correlation of KC vs. LSEC log2 fold change values for all features expressed in both the transcriptome and proteome datasets. The r value of 0.74 indicates that approximately two thirds of the gene products are consistently significantly differentially expressed between LSECs and KCs with respect to mRNA and protein expression (FDR ≤ 0.05 and |log2 fold change| ≥ 1)CC BY · PubMed Central
Fig. 4 Dot plot showing selected enriched terms in KC and LSEC transcriptomes, belonging to GO biological processes in the Molecular Signatures Database (MSigDB) [53]. The Normalized Enrichment Score reflects the degree of overrepresentation of the genes in a gene set across the entire ranked list of genes after adjusting for differences in gene set size, and correlation between the gene sets and the RNA-seq expression data. Dot size represents the number of genes assigned to the specific process, and dot colour represents the associated FDR q-value generated from the GSEA analysis
Fig. 4 Dot plot showing selected enriched terms in KC and LSEC transcriptomes, belonging to GO biological processes in the Molecular Signatures Database (MSigDB) [53]. The Normalized Enrichment Score reflects the degree of overrepresentation of the genes in a gene set across the entire ranked list of genes after adjusting for differences in gene set size, and correlation between the gene sets and the RNA-seq expression data. Dot size represents the number of genes assigned to the specific process, and dot colour represents the associated FDR q-value generated from the GSEA analysisCC BY · PubMed Central
Fig. 5 Expression of immune genes in rat LSECs and KCs. a. Unscaled heatmaps of normalized log2 expression values (log2 (RPKM+ 1), and log2 (iBAQ+ 1)) for all gene products associated with the term immune system processes (GO:0002376) in the KC and LSEC transcriptome and proteome. b. The figure shows significantly enriched GO terms (FDR ≤ 0.05) associated with immune functions, and the density of corresponding genes with expression ≥10 RPKM in the LSEC and KC transcriptomes
Fig. 5 Expression of immune genes in rat LSECs and KCs. a. Unscaled heatmaps of normalized log2 expression values (log2 (RPKM+ 1), and log2 (iBAQ+ 1)) for all gene products associated with the term immune system processes (GO:0002376) in the KC and LSEC transcriptome and proteome. b. The figure shows significantly enriched GO terms (FDR ≤ 0.05) associated with immune functions, and the density of corresponding genes with expression ≥10 RPKM in the LSEC and KC transcriptomesCC BY · PubMed Central
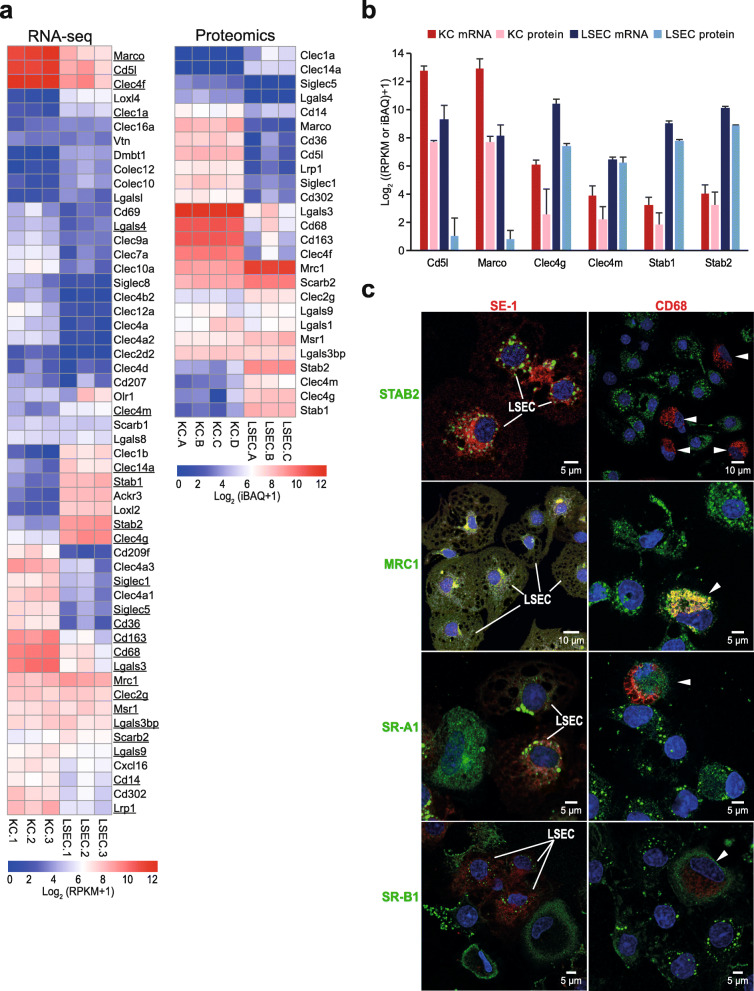
Fig. 6 Expression of scavenger receptors and immune lectins in rat LSECs and KCs. a. Unscaled heatmaps of normalized log2 expression values (log2 (RPKM+ 1), and log2 (iBAQ+ 1)) for scavenger receptors (SR) and C-type lectins in the KC and LSEC transcriptomes and proteomes. Underlined: Genes expressed in the transcriptome that were also present in the proteome. b. Absolute abundance of selected SR gene products in the KC and LSEC transcriptomes and proteomes. The bar height reflects good correlation between the transcriptome and proteome data for gene products of Clec4g, Clec4m, Stab1, and Stab2 in both cell types. The abundance of gene products of Marco and Cd5l were well correlated between the KC transcriptome and proteome, while LSECs showed high abundance of these gene products only at mRNA level. c. Immune labeling of non-parenchymal liver cell (NPC) cultures for selected SRs and C-type lectins. NPCs from the 25–45% interface on the Percoll gradient were incubated for 1 h, then fixed 15 min in 4% paraformaldehyde, and double immune-labeled with antibodies to FcγRIIb2 (SE-1; red fluorescence; left column), or CD68 (red fluorescence; right column), and to either stabilin-2 (STAB2; green), mannose receptor (MRC1; green), SR-A1 (green), or SR-B1 (green). Overlap of green and red fluorescence is seen as yellow staining in the overlay images. Antibodies are listed in Table 1. Cell nuclei were stained with DAPI (blue). Arrow heads point to CD68 positive KCs. Antibodies to stabilin-2 and FcγRIIb2 (SE-1) specifically labeled LSECs and the CD68-antibody specifically labeled KCs, whereas positive labeling for the mannose receptor, SR-A1, and SR-B1 was observed in both LSECs and KCs
Fig. 6 Expression of scavenger receptors and immune lectins in rat LSECs and KCs. a. Unscaled heatmaps of normalized log2 expression values (log2 (RPKM+ 1), and log2 (iBAQ+ 1)) for scavenger receptors (SR) and C-type lectins in the KC and LSEC transcriptomes and proteomes. Underlined: Genes expressed in the transcriptome that were also present in the proteome. b. Absolute abundance of selected SR gene products in the KC and LSEC transcriptomes and proteomes. The bar height reflects good correlation between the transcriptome and proteome data for gene products of Clec4g, Clec4m, Stab1, and Stab2 in both cell types. The abundance of gene products of Marco and Cd5l were well correlated between the KC transcriptome and proteome, while LSECs showed high abundance of these gene products only at mRNA level. c. Immune labeling of non-parenchymal liver cell (NPC) cultures for selected SRs and C-type lectins. NPCs from the 25–45% interface on the Percoll gradient were incubated for 1 h, then fixed 15 min in 4% paraformaldehyde, and double immune-labeled with antibodies to FcγRIIb2 (SE-1; red fluorescence; left column), or CD68 (red fluorescence; right column), and to either stabilin-2 (STAB2; green), mannose receptor (MRC1; green), SR-A1 (green), or SR-B1 (green). Overlap of green and red fluorescence is seen as yellow staining in the overlay images. Antibodies are listed in Table 1. Cell nuclei were stained with DAPI (blue). Arrow heads point to CD68 positive KCs. Antibodies to stabilin-2 and FcγRIIb2 (SE-1) specifically labeled LSECs and the CD68-antibody specifically labeled KCs, whereas positive labeling for the mannose receptor, SR-A1, and SR-B1 was observed in both LSECs and KCsCC BY · PubMed Central
Fig. 7 Expression of immune regulatory factor genes in the rat LSEC and KC transcriptomes. The genes were associated with the terms cytokine receptor activity (GO:0004896), cytokine receptor binding (GO:0005126), complement receptor activity (GO:0004875), and complement activation (GO:0006956). a. Volcano-plot illustrating differently expressed genes. Blue dots: significantly higher expression in LSECs; red dots: significantly higher expression in KCs; gray dots: not significantly different between LSECs and KCs. Significance level: FDR ≤ 0.05 and |log2 fold change| ≥ 1. b-e. Expression of selected genes in LSECs and KCs transcriptome associated with cytokine receptor activity (b), cytokine activity (c), complement receptor activity (d), and regulators of complement activation (e). Each blue dot represents abundance, corresponding to log2 expression values (RPKM+ 1), in an LSEC sample and each red dot represents abundance in a KC sample. *Significantly higher in LSECs, #significantly higher in KCs. Significance level: FDR ≤ 0.05 and |log2 fold change| ≥ 1
Fig. 7 Expression of immune regulatory factor genes in the rat LSEC and KC transcriptomes. The genes were associated with the terms cytokine receptor activity (GO:0004896), cytokine receptor binding (GO:0005126), complement receptor activity (GO:0004875), and complement activation (GO:0006956). a. Volcano-plot illustrating differently expressed genes. Blue dots: significantly higher expression in LSECs; red dots: significantly higher expression in KCs; gray dots: not significantly different between LSECs and KCs. Significance level: FDR ≤ 0.05 and |log2 fold change| ≥ 1. b-e. Expression of selected genes in LSECs and KCs transcriptome associated with cytokine receptor activity (b), cytokine activity (c), complement receptor activity (d), and regulators of complement activation (e). Each blue dot represents abundance, corresponding to log2 expression values (RPKM+ 1), in an LSEC sample and each red dot represents abundance in a KC sample. *Significantly higher in LSECs, #significantly higher in KCs. Significance level: FDR ≤ 0.05 and |log2 fold change| ≥ 1CC BY · PubMed Central
Fig. 8 Expression of selected gene products associated with antigen processing and presentation (GO:0019882), and lymphocyte co-stimulation (GO:0031294) in the rat LSECs and KCs transcriptome and proteome. Each blue dot represents abundance of gene products in an LSEC sample and each red dot represents abundance in a KC sample. The dot plots on the left illustrate the abundance of mRNA (log2 (RPKM+ 1)) in the transcriptome, and the right plots illustrate the corresponding gene expression value in the proteome (log2 (iBAQ+ 1)). *Significantly higher in LSECs, #significantly higher in KCs. Significance level: FDR ≤ 0.05 and |log2 fold change| ≥ 1. a. Gene products involved in antigen processing (immune proteases: Psme1, Psme2), transport of processed peptide into the endosome for loading into MHC molecules (Tap1, Tap2, Tapbp), accessory proteins in loading and sorting of MHC molecules to endolysosome (Ifi30, Pdia3), and the invariant chain (Cd74). b. Lysosomal hydrolases annotated to be associated with MHC class II antigen processing. c. MHC class II gene products. d. Co-stimulatory factors involved in lymphocyte activation
Fig. 8 Expression of selected gene products associated with antigen processing and presentation (GO:0019882), and lymphocyte co-stimulation (GO:0031294) in the rat LSECs and KCs transcriptome and proteome. Each blue dot represents abundance of gene products in an LSEC sample and each red dot represents abundance in a KC sample. The dot plots on the left illustrate the abundance of mRNA (log2 (RPKM+ 1)) in the transcriptome, and the right plots illustrate the corresponding gene expression value in the proteome (log2 (iBAQ+ 1)). *Significantly higher in LSECs, #significantly higher in KCs. Significance level: FDR ≤ 0.05 and |log2 fold change| ≥ 1. a. Gene products involved in antigen processing (immune proteases: Psme1, Psme2), transport of processed peptide into the endosome for loading into MHC molecules (Tap1, Tap2, Tapbp), accessory proteins in loading and sorting of MHC molecules to endolysosome (Ifi30, Pdia3), and the invariant chain (Cd74). b. Lysosomal hydrolases annotated to be associated with MHC class II antigen processing. c. MHC class II gene products. d. Co-stimulatory factors involved in lymphocyte activationCC BY · PubMed Central
Fig. 9 Expression of the leukocyte marker PTPRC/CD45 in rat LSECs. a: Ptprc/Cd45 mRNA and PTPRC/CD45 protein expression as obtained from RNA-seq (log2 RPKM) and label-free proteomics (log2 iBAQ) in KCs (red dots) and LSECs (blue triangles). b-f: Representative sequential gating during flow cytometry analysis of rat non-parenchymal liver cells (n = 4). Cells were labeled with antibodies to SE-1/FcγRIIb2, CD31, and CD45 (listed in Table 1). b: Gating based on the FSC-A vs FSC-H profile to exclude duplets and aggregates from the subsequent analysis. c: Gating on the SSC-A vs FSC-A profile to select small cells with limited complexity (enriched in endothelial cells). d: Gating to select DAPI negative live cells. e-f: LSECs were then identified as SE-1-Alexa488+ cells (e), and the biexponential CD45-PE/CD31-APC of events (f) were used to display and select the CD45+ CD31+ subsets of LSECs. FMOs (used for gating), and single antibody staining controls are shown in Additional file 8. g: Average of the percentage of viable parent populations observed in 4 biological replicates (±standard deviation, SD)
Fig. 9 Expression of the leukocyte marker PTPRC/CD45 in rat LSECs. a: Ptprc/Cd45 mRNA and PTPRC/CD45 protein expression as obtained from RNA-seq (log2 RPKM) and label-free proteomics (log2 iBAQ) in KCs (red dots) and LSECs (blue triangles). b-f: Representative sequential gating during flow cytometry analysis of rat non-parenchymal liver cells (n = 4). Cells were labeled with antibodies to SE-1/FcγRIIb2, CD31, and CD45 (listed in Table 1). b: Gating based on the FSC-A vs FSC-H profile to exclude duplets and aggregates from the subsequent analysis. c: Gating on the SSC-A vs FSC-A profile to select small cells with limited complexity (enriched in endothelial cells). d: Gating to select DAPI negative live cells. e-f: LSECs were then identified as SE-1-Alexa488+ cells (e), and the biexponential CD45-PE/CD31-APC of events (f) were used to display and select the CD45+ CD31+ subsets of LSECs. FMOs (used for gating), and single antibody staining controls are shown in Additional file 8. g: Average of the percentage of viable parent populations observed in 4 biological replicates (±standard deviation, SD)CC BY · PubMed Central

Verification

Claims the paper makes

The claims and statistics of this paper haven’t been checked yet.

Free: it reads the open-access text and checks the first 5 claims that cite a source we can check. Create a free account to check every claim.

A few free checks a day · papers already verified open instantly · results are public

Self-check

Percentages, sums and reported differences re-computed from the paper’s own numbers.

The self-check needs the paper’s full text.

Citations

Cites

Show all 1 references

Metadata

Authors
Bhandari, S., Li, R., Simón-Santamaría, J., McCourt, P., Johansen, S. D., Smedsrød, B., Martinez-Zubiaurre, I., & Sørensen, K. K.
Affiliations
  • UiT The Arctic University of Norway (NO)
  • Nord University (NO)
  • UiT Norges arktiske universitet
Corresponding author
Smedsrød, Bård
Venue
BMC Molecular and Cell Biology
Published
2020-02-25
Volume
21
Issue
1
Pages
85-85
ISSN
2661-8850 (ISSN-L)
OpenAlex
W3108812798
Cited by
37
References
1
Citations by year
2026: 4 · 2025: 3 · 2024: 9 · 2023: 9 · 2022: 8 · 2021: 4
FWCI
3.08
Type
journal article
Language
en
Open access
Locations
  • BMC Molecular and Cell Biology (publishedVersion, cc-by)
  • Research Square (acceptedVersion, cc-by)
  • PubMed Central (publishedVersion, cc-by)
  • PubMed (publishedVersion)
  • DOAJ (DOAJ: Directory of Open Access Journals) (submittedVersion)
  • NORA - Norwegian Open Research Archives (submittedVersion, other-oa)
  • NORA - Norwegian Open Research Archives (submittedVersion, cc-by)
  • Figshare (cc-by)
Funders
  • Universitetet i Tromsø
  • Tromsø Forskningsstiftelse
  • Norges Forskningsråd (262538)
Topics
  • Health Sciences › Medicine › Hepatology › Liver physiology and pathology
  • Life Sciences › Immunology and Microbiology › Immunology › Phagocytosis and Immune Regulation
  • Life Sciences › Biochemistry, Genetics and Molecular Biology › Biochemistry › Cholesterol and Lipid Metabolism
Keywords
liver sinusoidal endothelial cells, Kupffer cells, hepatic macrophages, scavenger receptors, C-type lectin, liver immunity, gene expression profiling, proteomic profiling, stabilin-1, stabilin-2, LSECtin, DC-SIGNR, antigen processing and presentation, hepatic clearance, xenobiotic detoxification, rats
MeSH terms
Animals, Gene Expression Regulation, Kupffer Cells, Liver, Lymphocyte Activation, Macrophages, Male, Rats, Sprague-Dawley, Leukocyte Common Antigens, Antigen Presentation, CD11 Antigens, Proteome, Gene Expression Profiling, Lectins, Endothelial Cells, Receptors, Scavenger, Gene Ontology

About these checks

Registry, retraction, Cites and statistics results are computed, not judged, with one exception: a printed reference that no index lists is read once by a model before it counts as a citation error. Claims are extracted by a model and kept only when their quote appears verbatim in the text; each cited source is then checked, with a model’s help, for whether it says what the claim relies on. Those verdicts can be wrong — read the claim’s quote and the cited source before relying on one.

Statistics and arithmetic are recomputed, not judged.

Confidence bands are shown only for fields calibrated on our annotated test set. None is calibrated yet, so no band is shown.

What counts as a claim ›How we measure confidence ›How we check this ›

Are you an author, or do you see a problem with this page? Request a review

How to cite

Cite CoChat for the checks on this page, and the paper for its own findings.

This page
CoChat. (2026). Citation check: Transcriptome and proteome profiling reveal complementary scavenger and immune features of rat liver sinusoidal endothelial cells and liver macrophages. https://app.cochat.ai/papers/10.21203/rs.2.24396/v1
The paper
Bhandari, S., Li, R., Simón-Santamaría, J., McCourt, P., Johansen, S. D., Smedsrød, B., Martinez-Zubiaurre, I., & Sørensen, K. K. (2020). Transcriptome and proteome profiling reveal complementary scavenger and immune features of rat liver sinusoidal endothelial cells and liver macrophages. BMC Molecular and Cell Biology. https://doi.org/10.21203/rs.2.24396/v1

Data sources

Bibliographic data: Semantic Scholar, OpenAlex, Crossref.

Contains information from the Semantic Scholar Academic Graph Datasets, made available under the ODC Attribution License (ODC-BY 1.0).

Semantic Scholar’s data is described in: Kinney, R., et al. (2023). The Semantic Scholar Open Data Platform. arXiv:2301.10140.