PreprintCited by 68Protein Structure and DynamicsComputational Drug Discovery MethodsAdvanced Physical and Chemical Molecular Interactions

The DOI matches its Crossref record; 1 of the 1 references it cites were found in a registry or an index.

Binding Affinity Estimation from Restrained Umbrella Sampling Simulations

Open access

Preprint — published as 10.1038/s43588-022-00389-9

Abstract

The protein-ligand binding affinity quantifies the binding strength between a protein and its ligand. Computer modeling and simulations can be used to estimate the binding affinity or binding free energy using data- or physics-driven methods or a combination thereof. Here, we discuss a purely physics-based sampling approach based on biased molecular dynamics (MD) simulations. Our proposed method generalizes and simplifies previously suggested stratification strategies that use umbrella sampling (US) or other enhanced sampling simulations with additional collective-variable based restraints. The novel approach presented here uses a flexible scheme that can be easily tailored for any system of interest. We estimate the binding affinity of human fibroblast growth factor 1 (hFGF1) to heparin hexasaccharide based on the available crystal structure of the complex as the initial model and four different variations of the proposed method to compare against the experimentally determined binding affinity obtained from isothermal calorimetry (ITC) experiments. Our results indicate that enhanced sampling methods that sample along the ligand-protein distance without restraining other degrees of freedom do not perform as well as those with additional restraint. In particular, restraining the orientation of the ligand plays the most crucial role in reaching a reasonable estimate for binding affinity. The general framework presented here provides a general scheme for designing practical binding free energy estimation methods for flexible ligands and proteins.

Overview

The claims and statistics of this paper haven’t been checked yet.

Run the check — free, no account needed. It reads the open-access text and checks the sources it cites.

A few free checks a day · papers already verified open instantly · results are public

Integrity signals

Registry

Crossref · 10.21203/rs.3.rs-1443106/v1

Cites

1 of 1 references verified0 citation errors · 0 not checkable

Statistics

Figures

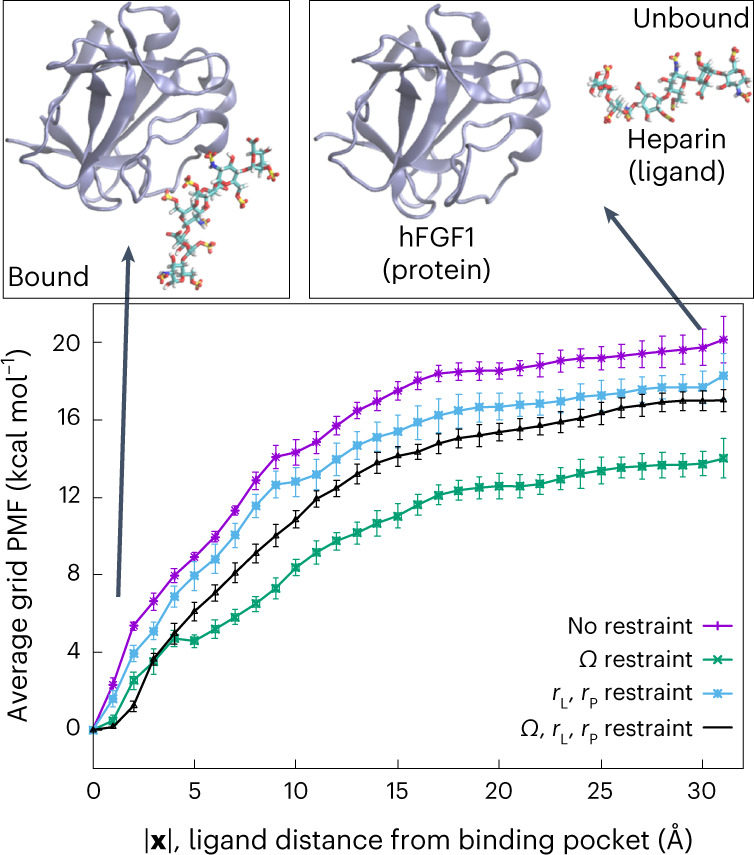
Fig. 1 Average grid PMF based on our alternative distance-based BEUS simulations. Average grid PMFs in terms of |x|, where x is the three-dimensional position vector of the ligand with respect to the center of the binding pocket. The x axis represents |x| and the y axis represents ΔF(|x|), which is an average over all ΔF(x) with the same |x|, that is, the ligand distance from the center of the binding pocket. The error bars represent the standard deviation obtained from all values of ΔF(x) at various grid points x with the same |x|. Representative images of heparin hexasaccharide bound to hFGF1 (|x| = 0 Å) and unbound (|x| = 30 Å) are shown above the grid PMF plot. We used n = 31 MD replicas to generate the data in all cases. Source data
Fig. 1 Average grid PMF based on our alternative distance-based BEUS simulations. Average grid PMFs in terms of |x|, where x is the three-dimensional position vector of the ligand with respect to the center of the binding pocket. The x axis represents |x| and the y axis represents ΔF(|x|), which is an average over all ΔF(x) with the same |x|, that is, the ligand distance from the center of the binding pocket. The error bars represent the standard deviation obtained from all values of ΔF(x) at various grid points x with the same |x|. Representative images of heparin hexasaccharide bound to hFGF1 (|x| = 0 Å) and unbound (|x| = 30 Å) are shown above the grid PMF plot. We used n = 31 MD replicas to generate the data in all cases. Source dataCC BY · PubMed Central
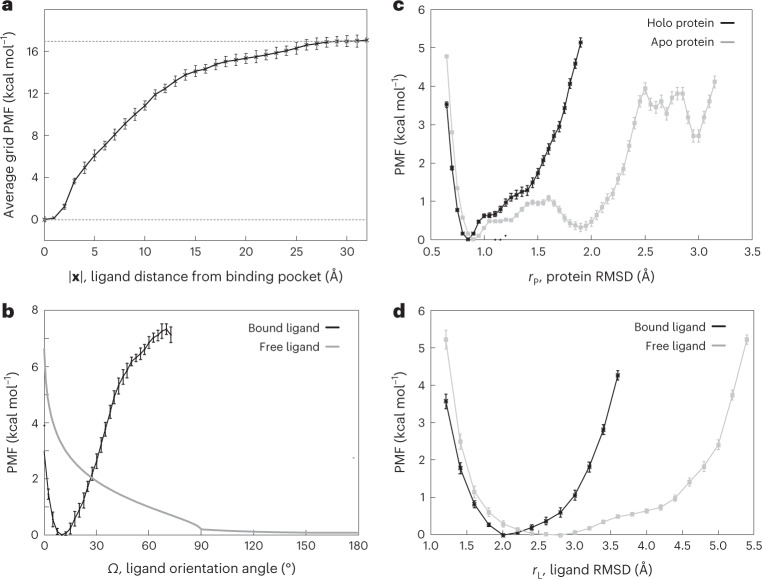
Fig. 2 Computational heparin–hFGF1 binding-free-energy measurements. a, Average grid PMF in terms of |x|, where x is the three-dimensional position vector of the ligand with respect to the center of the binding pocket determined from distance-based BEUS simulations with Ω, rL and rP restraints. The x axis represents |x| and the y axis represents ΔGΩ,rL,rP(∣x∣), which is an average over all ΔGΩ,rL,rP(x) with the same |x|, that is, the ligand distance from the center of the binding pocket. The error bars represents the standard deviation obtained from all values of ΔGΩ,rL,rP(x) at various grid points x with the same |x|. The dashed line represents the value associated with ΔGΩ,rL,rP(∣x∣) at |x| = 30 Å. b, The PMF associated with the ligand orientation angle (Ω) for the bound heparin (that is, x ≈ 0, ligand in the binding pocket) and free heparin (that is, x ≈ xB, ligand in the bulk). The latter is calculated analytically with the help of relation (21). c,d, PMF in terms of internal conformational fluctuations of the protein and ligand. c, PMF associated with the internal RMSD of heparin-bound (black line) and apo (gray line) hFGF1 (rP). d, PMF associated with the internal RMSD of FGF1-bound (black line) and free (gray line) heparin hexasaccharide (rL). The error bars in b–d represent the standard deviation determined from the bootstrapping algorithm described in Methods. We used n = 31, n = 30 and n = 12 MD replicas to generate the data shown in a, b, and c and d, respectively. Source data
Fig. 2 Computational heparin–hFGF1 binding-free-energy measurements. a, Average grid PMF in terms of |x|, where x is the three-dimensional position vector of the ligand with respect to the center of the binding pocket determined from distance-based BEUS simulations with Ω, rL and rP restraints. The x axis represents |x| and the y axis represents ΔGΩ,rL,rP(∣x∣), which is an average over all ΔGΩ,rL,rP(x) with the same |x|, that is, the ligand distance from the center of the binding pocket. The error bars represents the standard deviation obtained from all values of ΔGΩ,rL,rP(x) at various grid points x with the same |x|. The dashed line represents the value associated with ΔGΩ,rL,rP(∣x∣) at |x| = 30 Å. b, The PMF associated with the ligand orientation angle (Ω) for the bound heparin (that is, x ≈ 0, ligand in the binding pocket) and free heparin (that is, x ≈ xB, ligand in the bulk). The latter is calculated analytically with the help of relation (21). c,d, PMF in terms of internal conformational fluctuations of the protein and ligand. c, PMF associated with the internal RMSD of heparin-bound (black line) and apo (gray line) hFGF1 (rP). d, PMF associated with the internal RMSD of FGF1-bound (black line) and free (gray line) heparin hexasaccharide (rL). The error bars in b–d represent the standard deviation determined from the bootstrapping algorithm described in Methods. We used n = 31, n = 30 and n = 12 MD replicas to generate the data shown in a, b, and c and d, respectively. Source dataCC BY · PubMed Central
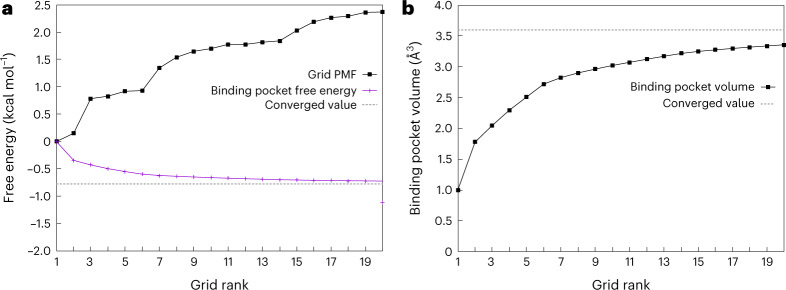
Fig. 3 Estimating binding pocket volume and its contribution to absolute binding free energy. a, Grid PMF (ΔG(x)) associated with grid points with the 20-lowest PMF values (black) along with estimated ΔGP based on these grid points (shown in an accumulative manner in magenta). The distance-based BEUS simulations with no restraints are used for these calculations. The dashed line shows the estimated ΔGP based on all visited grid points inside or outside the binding pocket. The x axis shows the ranking of these 20 grid points from lowest PMF onwards. b, Binding pocket volume (VP) calculated from the 20-lowest grid PMF values (similar to a). The dashed line shows the VP estimated from all visited grid points inside or outside the binding pocket. See ‘Theoretical foundation’ in Methods for more details. Source data
Fig. 3 Estimating binding pocket volume and its contribution to absolute binding free energy. a, Grid PMF (ΔG(x)) associated with grid points with the 20-lowest PMF values (black) along with estimated ΔGP based on these grid points (shown in an accumulative manner in magenta). The distance-based BEUS simulations with no restraints are used for these calculations. The dashed line shows the estimated ΔGP based on all visited grid points inside or outside the binding pocket. The x axis shows the ranking of these 20 grid points from lowest PMF onwards. b, Binding pocket volume (VP) calculated from the 20-lowest grid PMF values (similar to a). The dashed line shows the VP estimated from all visited grid points inside or outside the binding pocket. See ‘Theoretical foundation’ in Methods for more details. Source dataCC BY · PubMed Central
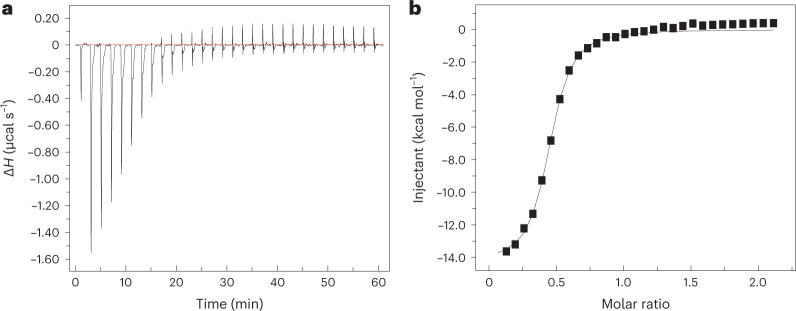
Fig. 4 Experimental heparin–hFGF1 binding-free-energy measurements. Isothermogram representing the titration of hFGF1 with heparin hexasaccharide. a, The raw data. The horizontal red line represents the zero axis in the plot. b, The best fit of the raw data (one set of sites binding model). In the specific experiment shown, Kd is 1.68 ± 0.03 μM and the free energy from experimental Kd is −7.88 ± 0.01 kcal mol−1. ΔH, heat change. Source data
Fig. 4 Experimental heparin–hFGF1 binding-free-energy measurements. Isothermogram representing the titration of hFGF1 with heparin hexasaccharide. a, The raw data. The horizontal red line represents the zero axis in the plot. b, The best fit of the raw data (one set of sites binding model). In the specific experiment shown, Kd is 1.68 ± 0.03 μM and the free energy from experimental Kd is −7.88 ± 0.01 kcal mol−1. ΔH, heat change. Source dataCC BY · PubMed Central
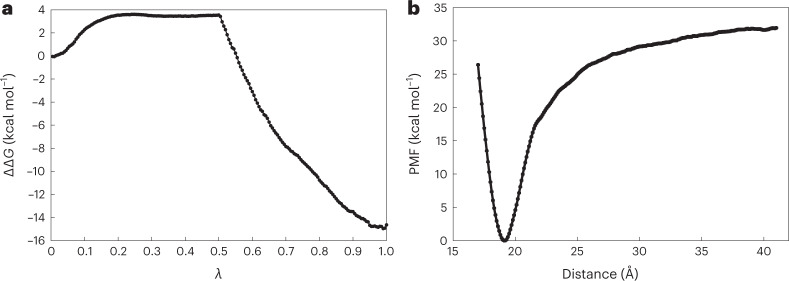
Fig. 5 Binding-free-energy measurements using BFEE2 software. a, Free-energy difference for the double annihilation of heparin hexasaccharide in its bound state and in water from FEP calculations. λ is a coupling parameter that gradually switches on interactions between a fully coupled state (λ = 0) and a final, fully decoupled state (λ = 1). b, PMF obtained during the separation of hFGF1 and heparin hexasaccharide using the geometric route. We used the BFEE2 (ref. 27) package to estimate the absolute free energy of binding in silico for an alchemical or geometrical route with multiple subprocesses and geometric constraints. The alchemical and geometric methods’ binding-free-energy estimates were 0.55 ± 30.25 kcal mol−1 and −19.04 ± 2.95 kcal mol−1, respectively. See Supplementary Tables 2 and 3 for details of each geometric restriction and alchemical FEP calculations, respectively. Source data
Fig. 5 Binding-free-energy measurements using BFEE2 software. a, Free-energy difference for the double annihilation of heparin hexasaccharide in its bound state and in water from FEP calculations. λ is a coupling parameter that gradually switches on interactions between a fully coupled state (λ = 0) and a final, fully decoupled state (λ = 1). b, PMF obtained during the separation of hFGF1 and heparin hexasaccharide using the geometric route. We used the BFEE2 (ref. 27) package to estimate the absolute free energy of binding in silico for an alchemical or geometrical route with multiple subprocesses and geometric constraints. The alchemical and geometric methods’ binding-free-energy estimates were 0.55 ± 30.25 kcal mol−1 and −19.04 ± 2.95 kcal mol−1, respectively. See Supplementary Tables 2 and 3 for details of each geometric restriction and alchemical FEP calculations, respectively. Source dataCC BY · PubMed Central

Verification

Claims the paper makes

The claims and statistics of this paper haven’t been checked yet.

Run the check — free, no account needed. It reads the open-access text and checks the sources it cites.

A few free checks a day · papers already verified open instantly · results are public

Self-check

Percentages, sums and reported differences re-computed from the paper’s own numbers.

The self-check needs the paper’s full text.

Citations

Cites

Show all 1 references

Metadata

Authors
Kumar, V. G., Agrawal, S., Kumar, T., & Moradi, M.
Affiliations
University of Arkansas at Fayetteville (US)
Corresponding author
Moradi, Mahmoud
Venue
Nature Computational Science
Published
2022-08-01
Volume
3
Issue
1
Pages
59-70
ISSN
2662-8457 (ISSN-L)
OpenAlex
W4313333135
Cited by
68
References
1
Citations by year
2026: 17 · 2025: 26 · 2024: 20 · 2023: 4 · 2022: 1
FWCI
4.16
Type
journal article
Language
en
Open access
Locations
  • Nature Computational Science (publishedVersion, cc-by)
  • bioRxiv (Cold Spring Harbor Laboratory) (acceptedVersion)
  • Research Square (acceptedVersion, cc-by)
  • PubMed Central (publishedVersion, cc-by)
  • PubMed (publishedVersion)
Funders
  • National Science Foundation (P30 GM103450, 0725070, (OCI 07‐25070), ACI-1 548 562, 1548562, 1945465, 1238993, 1940188, R01GM116961)
  • U.S. Department of Energy (DE‐FG02‐, DEFG0201ER15161, FG0201ER15161, 1548562, P20GM139768, OCI-0725070, ACI-1238993, 0725070, 1 RO1 CA 172631, ACI-1548562, P30 GM103450)
  • University of Arkansas (P30GM103450, P20GM139768)
  • Arkansas Biosciences Institute (OCI-0725070, GM103450, P30 GM103450, ACI-1238993)
  • Arkansas Economic Development Commission
  • National Institutes of Health (1548562, ACI-1548562, DE-FG02-01ER15161)
  • Arkansas High Performance Computing Center, University of Arkansas
  • National Cancer Institute (R01CA172631, 1 RO1 CA 172631, DE-FG02-01ER15161, RO1 CA 172631)
  • National Institute of General Medical Sciences (ACI1548562, 1548562, P30GM103450, R01GM116961, R15GM139140, P20GM139768)
  • Division of Chemistry (ACI-1548562, CHE 1945465, 1945465)
Topics
  • Life Sciences › Biochemistry, Genetics and Molecular Biology › Molecular Biology › Protein Structure and Dynamics
  • Life Sciences › Pharmacology, Toxicology and Pharmaceutics › Drug Discovery › Computational Drug Discovery Methods
  • Physical Sciences › Chemistry › Physical and Theoretical Chemistry › Advanced Physical and Chemical Molecular Interactions
Keywords
protein-ligand binding affinity, binding free energy, biased molecular dynamics, enhanced sampling, fibroblast growth factor 1, isothermal titration calorimetry
MeSH terms
Humans, Ligands, Protein Binding, Proteins, Entropy, Molecular Dynamics Simulation

About these checks

Registry, retraction, Cites and statistics results are computed, not judged, with one exception: a printed reference that no index lists is read once by a model before it counts as a citation error. Claims are extracted by a model and kept only when their quote appears verbatim in the text; each cited source is then checked, with a model’s help, for whether it says what the claim relies on. Those verdicts can be wrong — read the claim’s quote and the cited source before relying on one.

Statistics and arithmetic are recomputed, not judged.

Confidence bands are shown only for fields calibrated on our annotated test set. None is calibrated yet, so no band is shown.

What counts as a claim ›How we measure confidence ›How we check this ›

Are you an author, or do you see a problem with this page? Request a review

How to cite

Cite CoChat for the checks on this page, and the paper for its own findings.

This page
CoChat. (2026). Citation check: Binding Affinity Estimation from Restrained Umbrella Sampling Simulations. https://app.cochat.ai/papers/10.21203/rs.3.rs-1443106/v1
The paper
Kumar, V. G., Agrawal, S., Kumar, T., & Moradi, M. (2022). Binding Affinity Estimation from Restrained Umbrella Sampling Simulations. Nature Computational Science. https://doi.org/10.21203/rs.3.rs-1443106/v1