Student or educator? Sign up with your school email and get 6 months of Pro free.
CoChat

The DOI matches its Crossref record; 1 of the 1 references it cites were found in a registry or an index.

Deep structured learning realizes variant prioritization for Mendelian diseases

Open access
Danzi, Matt, Dohrn, Maike, Fazal, Sarah, Beijer, Danique, Rebelo, Adriana, Cintra, Vivian, Züchner, Stephan · 2022 · Nature Communications

Preprint — published as 10.1038/s41467-023-39306-7

Abstract

Effective computer-aided or automated variant evaluations for monogenic diseases will expedite clinical diagnostic and research efforts of known and novel disease-causing genes. Here we introduce MAVERICK: a Mendelian Approach to Variant Effect pRedICtion built in Keras. MAVERICK is an ensemble of transformer-based neural networks that can classify a wide range of protein-altering SNVs and indels and assesses whether a variant would be pathogenic in the context of dominant or recessive inheritance. We demonstrate that MAVERICK outperforms all other major programs that assess pathogenicity in a Mendelian context. In a cohort of 644 previously solved patients with Mendelian diseases, MAVERICK ranks the causative pathogenic variant within the top five variants in over 95% of cases. Seventy-six percent of cases were resolved outright. MAVERICK particularly excels at identifying pathogenic variants in novel disease genes: it ranks the true causal variant in hitherto novel disease genes within the first five candidate variants in 70% of cases. MAVERICK has recently facilitated the identification of three novel disease genes. These results represent a significant step towards automated identification of causal variants in patients with Mendelian diseases.

Overview

The claims and statistics of this paper haven’t been checked yet.

Free: it reads the open-access text and checks the first 5 claims that cite a source we can check. Create a free account to check every claim.

A few free checks a day · papers already verified open instantly · results are public

Integrity signals

Registry

Crossref · 10.21203/rs.3.rs-1602211/v1

Cites

1 of 1 references verified0 citation errors · 0 not checkable

Statistics

Figures

Fig. 1 Conceptual overview of MAVERICK. a Diagram of MAVERICK inputs and outputs. MAVERICK takes as inputs the reference and altered protein sequence, the evolutionary conservation of each amino acid in the protein, and structured data including genetic constraint and allele frequency information. These inputs are then processed through MAVERICK’s ensemble of transformer-based neural networks to produce the output: a three-class prediction corresponding to the probability that the input variant is benign, pathogenic with dominant inheritance, or pathogenic with recessive inheritance. The three output probabilities always sum to one. b MAVERICK training and testing datasets. MAVERICK’s training and validation datasets were created from variants in ClinVar prior to the year 2020. The known and novel genes test datasets were created from variants added to ClinVar during 2020, following the same rules for creation as the training set.
Fig. 1 Conceptual overview of MAVERICK. a Diagram of MAVERICK inputs and outputs. MAVERICK takes as inputs the reference and altered protein sequence, the evolutionary conservation of each amino acid in the protein, and structured data including genetic constraint and allele frequency information. These inputs are then processed through MAVERICK’s ensemble of transformer-based neural networks to produce the output: a three-class prediction corresponding to the probability that the input variant is benign, pathogenic with dominant inheritance, or pathogenic with recessive inheritance. The three output probabilities always sum to one. b MAVERICK training and testing datasets. MAVERICK’s training and validation datasets were created from variants in ClinVar prior to the year 2020. The known and novel genes test datasets were created from variants added to ClinVar during 2020, following the same rules for creation as the training set.CC BY · PubMed Central
Fig. 2 MAVERICK effectively classifies the pathogenicity of a wide-range of protein-altering variants. a Areas under the receiver operating characteristic curve for the known genes and novel genes test sets. b Areas under the precision-recall curve for the known genes and novel genes test sets. c, d Box plots of MAVERICK classification performance on each type of protein-altering variant that it can assess. The y-axis shows the distribution of MAVERICK predictions for each variant type where the value plotted for any given variant is the probability for the true class label (e.g., benign variants are plotted by their benign score). The boxes show the median, 25th and 75th percentiles, while the whiskers show the 5th and 95th percentiles and any remaining points are shown as blue dots. The number of variants used for each box plot is shown at the bottom of the figure. c The performance for the known genes test set. d The performance for the novel genes test set. e MAVERICK predictions for every possible missense variant on the known dominant spastic paraplegia gene SPAST. For each variant, MAVERICK’s predicted benign score is plotted on the bottom subplot, the recessive score is plotted on the middle subplot, the dominant score is plotted on the top subplot. A diagram of domains in the gene is given at the top. ClinVar pathogenic variants are plotted in red. ClinVar benign variants are plotted in green. ClinVar variants of uncertain significance are plotted in blue.
Fig. 2 MAVERICK effectively classifies the pathogenicity of a wide-range of protein-altering variants. a Areas under the receiver operating characteristic curve for the known genes and novel genes test sets. b Areas under the precision-recall curve for the known genes and novel genes test sets. c, d Box plots of MAVERICK classification performance on each type of protein-altering variant that it can assess. The y-axis shows the distribution of MAVERICK predictions for each variant type where the value plotted for any given variant is the probability for the true class label (e.g., benign variants are plotted by their benign score). The boxes show the median, 25th and 75th percentiles, while the whiskers show the 5th and 95th percentiles and any remaining points are shown as blue dots. The number of variants used for each box plot is shown at the bottom of the figure. c The performance for the known genes test set. d The performance for the novel genes test set. e MAVERICK predictions for every possible missense variant on the known dominant spastic paraplegia gene SPAST. For each variant, MAVERICK’s predicted benign score is plotted on the bottom subplot, the recessive score is plotted on the middle subplot, the dominant score is plotted on the top subplot. A diagram of domains in the gene is given at the top. ClinVar pathogenic variants are plotted in red. ClinVar benign variants are plotted in green. ClinVar variants of uncertain significance are plotted in blue.CC BY · PubMed Central
Fig. 3 MAVERICK reliably prioritizes causal variants in simulated cases. a Violin plots of the distribution of variants predicted as pathogenic by MAVERICK among 10,138 individuals in the GENESIS database. The median of each distribution is denoted by a horizontal red line. A value of 0.5 was used as the threshold for being ‘pathogenic’ in this analysis. So, heterozygous variants with a dominant MAVERICK score over 0.5 are shown on the left, homozygous variants with a recessive MAVERICK score over 0.5 are shown in the center, and pairs of heterozygous variants on the same gene with a harmonic mean of recessive MAVERICK scores over 0.5 are shown on the right. b Scatterplot of cumulative proportion of cases solved by MAVERICK’s rank ordering of variants using genotype information only when 98 control samples had pathogenic variants from the known and novel genes test sets spiked in. 13,095 pathogenic variants from the known genes set and 696 pathogenic variants from the novel genes set were used. Testing each of these variants in each of the 98 control samples produced 1,351,518 simulated cases. c Diagram of how MAVERICK filters variants based on user-provided inheritance information. d Diagram of how MAVERICK leverages phenotype information using the GADO, HiPhive, or PhenIX algorithms to adjust its predictions. e Stacked horizontal bar plots showing how performance on both the known and novel genes test sets improves when additionally incorporating inheritance and/or phenotypic information along with MAVERICK variant prediction scores.
Fig. 3 MAVERICK reliably prioritizes causal variants in simulated cases. a Violin plots of the distribution of variants predicted as pathogenic by MAVERICK among 10,138 individuals in the GENESIS database. The median of each distribution is denoted by a horizontal red line. A value of 0.5 was used as the threshold for being ‘pathogenic’ in this analysis. So, heterozygous variants with a dominant MAVERICK score over 0.5 are shown on the left, homozygous variants with a recessive MAVERICK score over 0.5 are shown in the center, and pairs of heterozygous variants on the same gene with a harmonic mean of recessive MAVERICK scores over 0.5 are shown on the right. b Scatterplot of cumulative proportion of cases solved by MAVERICK’s rank ordering of variants using genotype information only when 98 control samples had pathogenic variants from the known and novel genes test sets spiked in. 13,095 pathogenic variants from the known genes set and 696 pathogenic variants from the novel genes set were used. Testing each of these variants in each of the 98 control samples produced 1,351,518 simulated cases. c Diagram of how MAVERICK filters variants based on user-provided inheritance information. d Diagram of how MAVERICK leverages phenotype information using the GADO, HiPhive, or PhenIX algorithms to adjust its predictions. e Stacked horizontal bar plots showing how performance on both the known and novel genes test sets improves when additionally incorporating inheritance and/or phenotypic information along with MAVERICK variant prediction scores.CC BY · PubMed Central
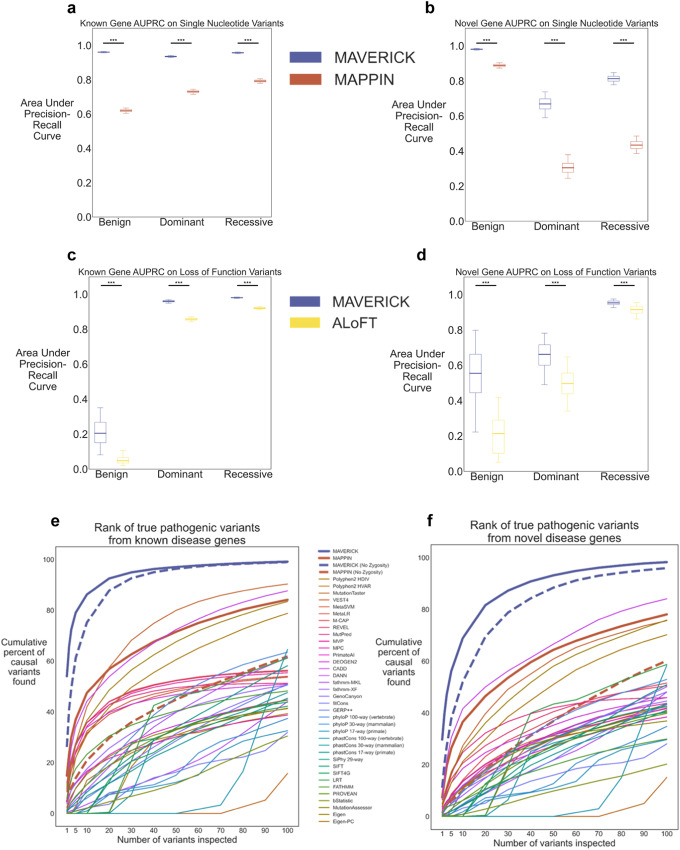
Fig. 4 MAVERICK outperforms similar pathogenicity predictors. a, b Box plots of areas under the precision-recall curve for MAVERICK and MAPPIN missense, stop-gain and stop-loss single nucleotide variants. a Performance for the known genes test set. b Performance for the novel genes test set. c, d Box plots of areas under the precision-recall curve for MAVERICK and ALoFT loss-of-function variants. c Performance for the known genes test set. d Performance for the novel genes test set. In panels a–d, *** indicates p-value < 0.001 in one-sided Mann–Whitney U test based on bootstrapping (n = 1000 iterations). Multiple testing corrections were not performed. Box plot elements in panels a–d show the median as the center line, the 25th and 75th percentiles as limits of the boxes, and the 5th and 95th percentiles as the limits of the whiskers. Outliers are not plotted. e, f Line plot of cumulative proportion of cases solved by pathogenicity classifiers when rank ordering variants using only genotype information in SNV-only subset of the spike-in variant prioritization task shown in Fig. 3b. Dashed lines for MAVERICK and MAPPIN show their performance when dominant and recessive scores are summed to give a pathogenicity prediction which does not consider variant zygosity. e Performance for the known genes test set. f Performance for the novel genes test set.
Fig. 4 MAVERICK outperforms similar pathogenicity predictors. a, b Box plots of areas under the precision-recall curve for MAVERICK and MAPPIN missense, stop-gain and stop-loss single nucleotide variants. a Performance for the known genes test set. b Performance for the novel genes test set. c, d Box plots of areas under the precision-recall curve for MAVERICK and ALoFT loss-of-function variants. c Performance for the known genes test set. d Performance for the novel genes test set. In panels a–d, *** indicates p-value < 0.001 in one-sided Mann–Whitney U test based on bootstrapping (n = 1000 iterations). Multiple testing corrections were not performed. Box plot elements in panels a–d show the median as the center line, the 25th and 75th percentiles as limits of the boxes, and the 5th and 95th percentiles as the limits of the whiskers. Outliers are not plotted. e, f Line plot of cumulative proportion of cases solved by pathogenicity classifiers when rank ordering variants using only genotype information in SNV-only subset of the spike-in variant prioritization task shown in Fig. 3b. Dashed lines for MAVERICK and MAPPIN show their performance when dominant and recessive scores are summed to give a pathogenicity prediction which does not consider variant zygosity. e Performance for the known genes test set. f Performance for the novel genes test set.CC BY · PubMed Central
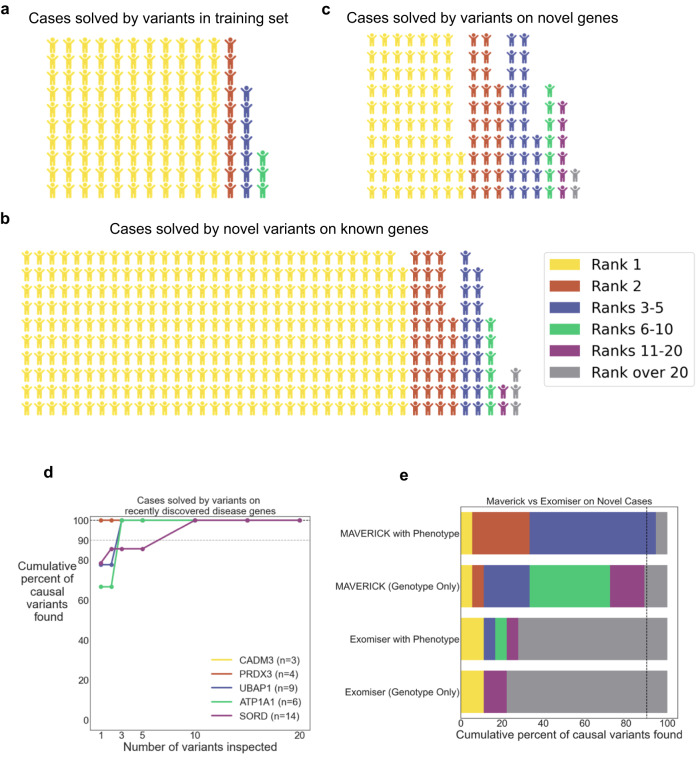
Fig. 5 MAVERICK reliably prioritizes causal variants in real cases. a–c Waffle plots showing rank of causal variant in 644 real cases solved by MAVERICK’s rank ordering of variants with inheritance and phenotypic information incorporated. a MAVERICK performance on 130 cases whose causal variant was in MAVERICK’s training set. Cases where either variant in a compound heterozygous pair are in the training set are included here. b MAVERICK performance on 375 cases whose causal variant was not in the training set, but at least one pathogenic variant on that gene was in the training set. c MAVERICK performance on 139 cases whose causal variant was on a gene without any pathogenic variants in the training set. d Cumulative proportion of real cases solved by MAVERICK’s rank ordering of variants for 36 cases whose causal variants were on disease genes that were recently discovered and novel to MAVERICK. The CADM3 and PRDX3 cases are all solved on the first guess and so the CADM3 line is obscured by the PRDX3 line. e Stacked horizontal bar plots of the cumulative proportion of 18 patients with causal variants on novel disease genes solved by MAVERICK or Exomiser’s rank ordering of variants. Results are shown using genotype information only as well as with phenotypic information incorporated.
Fig. 5 MAVERICK reliably prioritizes causal variants in real cases. a–c Waffle plots showing rank of causal variant in 644 real cases solved by MAVERICK’s rank ordering of variants with inheritance and phenotypic information incorporated. a MAVERICK performance on 130 cases whose causal variant was in MAVERICK’s training set. Cases where either variant in a compound heterozygous pair are in the training set are included here. b MAVERICK performance on 375 cases whose causal variant was not in the training set, but at least one pathogenic variant on that gene was in the training set. c MAVERICK performance on 139 cases whose causal variant was on a gene without any pathogenic variants in the training set. d Cumulative proportion of real cases solved by MAVERICK’s rank ordering of variants for 36 cases whose causal variants were on disease genes that were recently discovered and novel to MAVERICK. The CADM3 and PRDX3 cases are all solved on the first guess and so the CADM3 line is obscured by the PRDX3 line. e Stacked horizontal bar plots of the cumulative proportion of 18 patients with causal variants on novel disease genes solved by MAVERICK or Exomiser’s rank ordering of variants. Results are shown using genotype information only as well as with phenotypic information incorporated.CC BY · PubMed Central

Verification

Claims the paper makes

The claims and statistics of this paper haven’t been checked yet.

Free: it reads the open-access text and checks the first 5 claims that cite a source we can check. Create a free account to check every claim.

A few free checks a day · papers already verified open instantly · results are public

Self-check

Percentages, sums and reported differences re-computed from the paper’s own numbers.

The self-check needs the paper’s full text.

Citations

Cites

Show all 1 references

Metadata

Authors
Danzi, M., Dohrn, M., Fazal, S., Beijer, D., Rebelo, A., Cintra, V., & Züchner, S.
Affiliations
  • University of Miami (US)
  • University of Miami
  • University of Miami Miller School of Medicine
Venue
Nature Communications
Published
2022-05-27
Volume
14
Issue
1
Pages
4167-4167
ISSN
2041-1723 (ISSN-L)
OpenAlex
W4384201327
Cited by
43
References
1
Citations by year
2026: 7 · 2025: 15 · 2024: 17 · 2023: 4
FWCI
7.14
Type
journal article
Language
en
Open access
Locations
  • Nature Communications (publishedVersion, cc-by)
  • Research Square (acceptedVersion, cc-by)
  • PubMed Central (publishedVersion, cc-by)
  • PubMed (publishedVersion)
  • RePEc: Research Papers in Economics (submittedVersion)
  • DOAJ (DOAJ: Directory of Open Access Journals) (submittedVersion, cc-by-sa)
  • RWTH Publications (RWTH Aachen) (submittedVersion, other-oa)
  • RWTH Publications (RWTH Aachen)
Funders
  • Deutsche Forschungsgemeinschaft (DO 2386/1-1, DFG, DO 2386/1-1)
  • National Institutes of Health
  • National Institute of Neurological Disorders and Stroke (R01NS072248)
Topics
  • Life Sciences › Biochemistry, Genetics and Molecular Biology › Genetics › Genomics and Rare Diseases
  • Life Sciences › Biochemistry, Genetics and Molecular Biology › Genetics › Genetic Associations and Epidemiology
  • Life Sciences › Biochemistry, Genetics and Molecular Biology › Molecular Biology › Genomics and Phylogenetic Studies
Keywords
variant prioritization, monogenic disorders, pathogenicity prediction, single nucleotide variants, indels, transformer models, ensemble learning, dominant and recessive inheritance, novel disease genes, motor neuron disease, mavericks
MeSH terms
Humans, Proteins, INDEL Mutation

About these checks

Registry, retraction, Cites and statistics results are computed, not judged, with one exception: a printed reference that no index lists is read once by a model before it counts as a citation error. Claims are extracted by a model and kept only when their quote appears verbatim in the text; each cited source is then checked, with a model’s help, for whether it says what the claim relies on. Those verdicts can be wrong — read the claim’s quote and the cited source before relying on one.

Statistics and arithmetic are recomputed, not judged.

Confidence bands are shown only for fields calibrated on our annotated test set. None is calibrated yet, so no band is shown.

What counts as a claim ›How we measure confidence ›How we check this ›

Are you an author, or do you see a problem with this page? Request a review

How to cite

Cite CoChat for the checks on this page, and the paper for its own findings.

This page
CoChat. (2026). Citation check: Deep structured learning realizes variant prioritization for Mendelian diseases. https://app.cochat.ai/papers/10.21203/rs.3.rs-1602211/v1
The paper
Danzi, M., Dohrn, M., Fazal, S., Beijer, D., Rebelo, A., Cintra, V., & Züchner, S. (2022). Deep structured learning realizes variant prioritization for Mendelian diseases. Nature Communications. https://doi.org/10.21203/rs.3.rs-1602211/v1

Data sources

Bibliographic data: Semantic Scholar, OpenAlex, Crossref.

Contains information from the Semantic Scholar Academic Graph Datasets, made available under the ODC Attribution License (ODC-BY 1.0).

Semantic Scholar’s data is described in: Kinney, R., et al. (2023). The Semantic Scholar Open Data Platform. arXiv:2301.10140.