PreprintCited by 23Bacterial Genetics and BiotechnologyMicrotubule and mitosis dynamicsGenomics and Chromatin Dynamics

The DOI matches its Crossref record; 1 of the 1 references it cites were found in a registry or an index.

Multiple ParA/MinD ATPases coordinate the positioning of disparate cargos in a bacterial cell

Open access
Pulianmackal, Lisa, Limcaoco, Jose Miguel, Ravi, Keerthikka, Yang, Sinyu, Zhang, Jeffrey, Tran, Mimi, O'Meara, Matthew, Vecchiarelli, Anthony·2023·Nature Communications

Preprint — published as 10.1038/s41467-023-39019-x · Paper page

Abstract

In eukaryotes, linear motor proteins govern intracellular transport and organization. In bacteria, where linear motors are absent, the ParA/MinD (A/D) family of ATPases spatially organize an array of genetic- and protein-based cellular cargos. ParA is well known to segregate plasmids and chromosomes, as is MinD for its role in divisome positioning. Less studied is the growing list of ParA/MinD-like ATPases found across prokaryotes and involved in the spatial organization of diverse protein-based organelles, such as Bacterial Microcompartments (BMCs), flagella, chemotaxis clusters, and conjugation machinery. Given the fundamental nature of these processes in both cell survival and pathogenesis, the positioning of these cargos has been independently investigated to varying degrees in several organisms. However, it remains unknown whether multiple A/D ATPases can coexist and coordinate the positioning of such a diverse set of fundamental cargos in the same cell. If so, what are the mechanistic commonalities, variation, and specificity determinants that govern the positioning reaction for each cargo? Here, we find that over a third of sequenced bacteria encode multiple A/D ATPases. Among these bacteria, we identified several human pathogens as well as the experimentally tractable organism, Halothiobacillus neapolitanus, which encodes seven A/D ATPases. We directly demonstrate that five of these A/D ATPases are each dedicated to the spatial regulation of a single cellular cargo: the chromosome, the divisome, the carboxysome BMC, the flagellum, and the chemotaxis cluster. We identify putative specificity determinants that allow each A/D ATPase to position its respective cargo. Finally, we show how the deletion of one A/D ATPase can have indirect effects on the inheritance of a cargo actively positioned by another A/D ATPase, stressing the importance of understanding how organelle trafficking, chromosome segregation, and cell division are coordinated in bacterial cells. Together, our data show how multiple A/D ATPases coexist and function to position a diverse set of fundamental cargos in the same bacterial cell. With this knowledge, we anticipate the design of minimal autonomous positioning systems for natural- and synthetic-cargos in bacteria for synthetic biology and biomedical applications.

Overview

The claims and statistics of this paper haven’t been checked yet.

Run the check — free, no account needed. It reads the open-access text and checks the sources it cites.

A few free checks a day · papers already verified open instantly · results are public

Integrity signals

Registry

Crossref · 10.21203/rs.3.rs-2472554/v1

Cites

1 of 1 references verified0 citation errors · 0 not checkable

Statistics

Figures

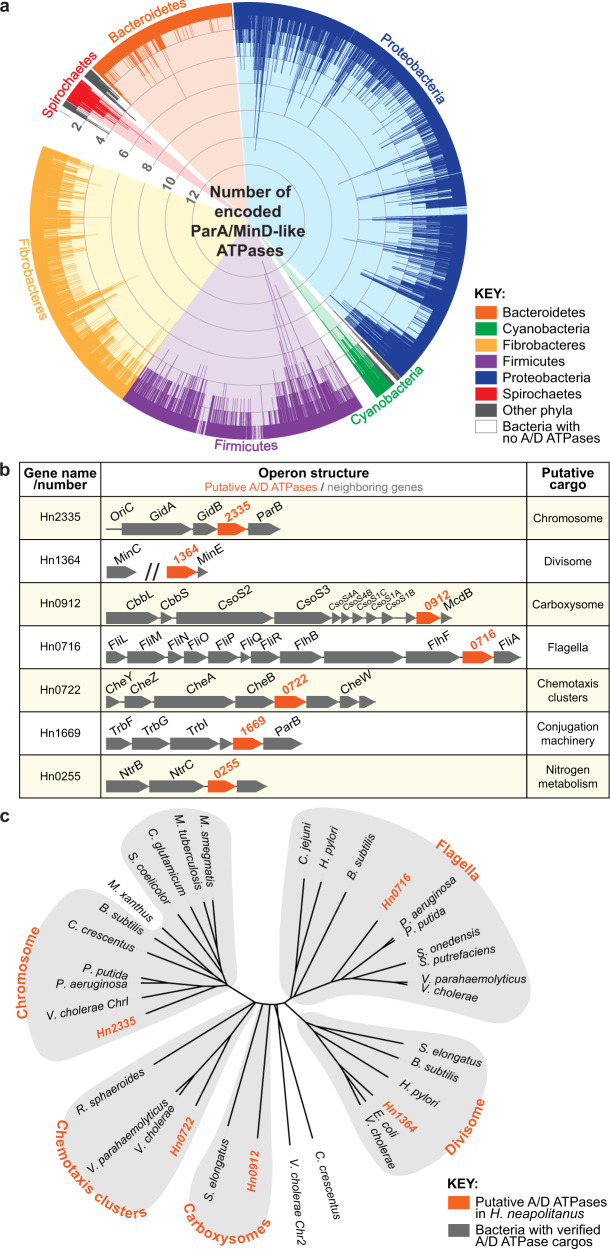
Fig. 1 ParA/MinD-like ATPases are widespread in bacteria. a 96% of sequenced bacterial genomes encode at least one A/D ATPase and 35% encode multiple. Each spike represents a bacterial species and spike length indicates the number of unique A/D hits per bacterium. b H. neapolitanus encodes seven putative ParA/MinD-like positioning systems. Gene neighborhood analysis implicates the putative cargos associated with each putative A/D ATPase. c Multiple sequence alignment of each A/D ATPase from H. neapolitanus against experimentally-verified ParA/MinD family members further implicates the putative cargos identified by gene neighborhood analysis. Each of the putative A/D ATPases in H. neapolitanus cluster with family members shown to position the indicated cellular cargos (orange) in other bacteria.
Fig. 1 ParA/MinD-like ATPases are widespread in bacteria. a 96% of sequenced bacterial genomes encode at least one A/D ATPase and 35% encode multiple. Each spike represents a bacterial species and spike length indicates the number of unique A/D hits per bacterium. b H. neapolitanus encodes seven putative ParA/MinD-like positioning systems. Gene neighborhood analysis implicates the putative cargos associated with each putative A/D ATPase. c Multiple sequence alignment of each A/D ATPase from H. neapolitanus against experimentally-verified ParA/MinD family members further implicates the putative cargos identified by gene neighborhood analysis. Each of the putative A/D ATPases in H. neapolitanus cluster with family members shown to position the indicated cellular cargos (orange) in other bacteria.CC BY · PubMed Central
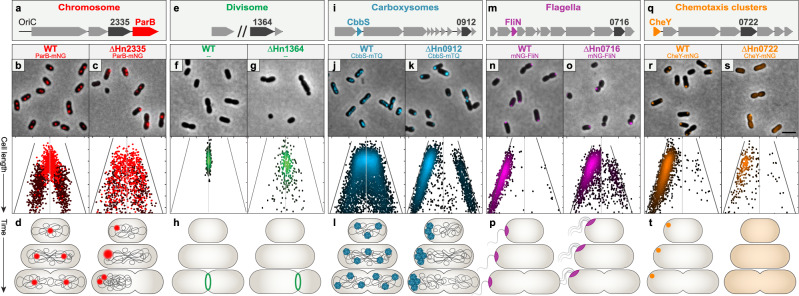
Fig. 2 Each A/D ATPase in H. neapolitanus positions a specific cargo. a–d Hn2335 is required for chromosome segregation. a Hn2335 is found near OriC and has a ParB-homolog encoded downstream. b, c The origin region of the chromosome was tagged by labelling the ParB homolog. Light red: 1 focus/cell; dark red: 2 foci/cell. Short WT cells had a single focus at mid-cell, whereas longer cells had two foci at the quarter positions. ΔHn2335 cells displayed random positioning of ParB foci regardless of cell length. d Cartoon diagrams depict chromosome segregation in WT and ΔHn2335 cells. e–h Hn1364 is required for divisome positioning. e Hn1364 is found upstream of minE. f, g Divisome positioning was determined by the location of constriction sites. Each dot on the density graph represents one identified constriction site. In WT cells, constriction sites were at mid-cell. In ΔHn1364, constriction sites were found across the cell length. h Cartoon diagrams depict cell division in WT and ΔHn1364 cells. i–l Carboxysome positioning is determined by McdA. i Hn0912 (mcdA) is found near genes encoding carboxysome shell proteins and Rubisco. j, k Carboxysomes were visualized by labelling the small subunit of the Rubisco enzyme, cbbS. Each dot on the density graph represents one carboxysome focus. In WT cells, carboxysomes are distributed along the cell length. In ΔmcdA, carboxysomes formed large polar foci at one or both poles. l Cartoon diagrams depict carboxysome distribution in WT and ΔHn0912 cells. m–p Hn0716 is required for regulating flagella position and copy number. m Hn0716 is found near flagella-associated genes. n, o Flagella localization was visualized by labelling a component of the flagellar basal body, fliN. Each dot on the density graph represents one FliN focus. WT cells had a single polar FliN focus. In ΔHn0716 cells, FliN foci were more randomly positioned along the cell length. p Cartoon diagrams depict flagella localization and number in WT and ΔHn0716 cells.q–t Hn0722 is required for chemotaxis cluster positioning. q Hn0722 is found near chemotaxis-associated genes. r, s Chemotaxis clusters were visualized by labelling the response regulator, cheY. Each dot on the density graph represents one CheY focus. WT cells had a single CheY polar focus. ΔHn0722 mutant cells typically had no CheY foci. t Cartoon diagrams depict chemotaxis clusters in WT and ΔHn0722 cells. (All images) Micrographs shown are representative images from at least 3 experiments. Scale bar: 2 μm. (All graphs) Cells were analyzed and quantified using MicrobeJ. On the y-axis, cells are sorted by increasing cell length, with shorter cells at the top and longer cells at the bottom. The x-axis represents the distance from mid-cell in microns; the center vertical line equates to a distance of zero from mid-cell. Each dot represents where a focus was found along the length of the cell. For all density plots, lighter colors represent higher density, darker colors represent lower density. For flagella, chemotaxis, and carboxysome graphs, the cell pole closest to a focus was oriented to the left; foci in the right half of the graph indicate the presence of a second focus. Graph axes for chromosome, carboxysome, flagella, and chemotaxis-labelled mutants:y-axis range (cell length): 0.8–2.1 μm; x-axis range (distance from mid-cell): −1.1–1.1 μm. X-axis of ΔflhG cells is 0.5–1.8 μm. Graph axes for divisome: y-axis range (cell length): 1.5–3.0 μm; x-axis range (distance from mid-cell): −1.5–1.5 μm. Source data are provided as a Source Data file.
Fig. 2 Each A/D ATPase in H. neapolitanus positions a specific cargo. a–d Hn2335 is required for chromosome segregation. a Hn2335 is found near OriC and has a ParB-homolog encoded downstream. b, c The origin region of the chromosome was tagged by labelling the ParB homolog. Light red: 1 focus/cell; dark red: 2 foci/cell. Short WT cells had a single focus at mid-cell, whereas longer cells had two foci at the quarter positions. ΔHn2335 cells displayed random positioning of ParB foci regardless of cell length. d Cartoon diagrams depict chromosome segregation in WT and ΔHn2335 cells. e–h Hn1364 is required for divisome positioning. e Hn1364 is found upstream of minE. f, g Divisome positioning was determined by the location of constriction sites. Each dot on the density graph represents one identified constriction site. In WT cells, constriction sites were at mid-cell. In ΔHn1364, constriction sites were found across the cell length. h Cartoon diagrams depict cell division in WT and ΔHn1364 cells. i–l Carboxysome positioning is determined by McdA. i Hn0912 (mcdA) is found near genes encoding carboxysome shell proteins and Rubisco. j, k Carboxysomes were visualized by labelling the small subunit of the Rubisco enzyme, cbbS. Each dot on the density graph represents one carboxysome focus. In WT cells, carboxysomes are distributed along the cell length. In ΔmcdA, carboxysomes formed large polar foci at one or both poles. l Cartoon diagrams depict carboxysome distribution in WT and ΔHn0912 cells. m–p Hn0716 is required for regulating flagella position and copy number. m Hn0716 is found near flagella-associated genes. n, o Flagella localization was visualized by labelling a component of the flagellar basal body, fliN. Each dot on the density graph represents one FliN focus. WT cells had a single polar FliN focus. In ΔHn0716 cells, FliN foci were more randomly positioned along the cell length. p Cartoon diagrams depict flagella localization and number in WT and ΔHn0716 cells.q–t Hn0722 is required for chemotaxis cluster positioning. q Hn0722 is found near chemotaxis-associated genes. r, s Chemotaxis clusters were visualized by labelling the response regulator, cheY. Each dot on the density graph represents one CheY focus. WT cells had a single CheY polar focus. ΔHn0722 mutant cells typically had no CheY foci. t Cartoon diagrams depict chemotaxis clusters in WT and ΔHn0722 cells. (All images) Micrographs shown are representative images from at least 3 experiments. Scale bar: 2 μm. (All graphs) Cells were analyzed and quantified using MicrobeJ. On the y-axis, cells are sorted by increasing cell length, with shorter cells at the top and longer cells at the bottom. The x-axis represents the distance from mid-cell in microns; the center vertical line equates to a distance of zero from mid-cell. Each dot represents where a focus was found along the length of the cell. For all density plots, lighter colors represent higher density, darker colors represent lower density. For flagella, chemotaxis, and carboxysome graphs, the cell pole closest to a focus was oriented to the left; foci in the right half of the graph indicate the presence of a second focus. Graph axes for chromosome, carboxysome, flagella, and chemotaxis-labelled mutants:y-axis range (cell length): 0.8–2.1 μm; x-axis range (distance from mid-cell): −1.1–1.1 μm. X-axis of ΔflhG cells is 0.5–1.8 μm. Graph axes for divisome: y-axis range (cell length): 1.5–3.0 μm; x-axis range (distance from mid-cell): −1.5–1.5 μm. Source data are provided as a Source Data file.CC BY · PubMed Central
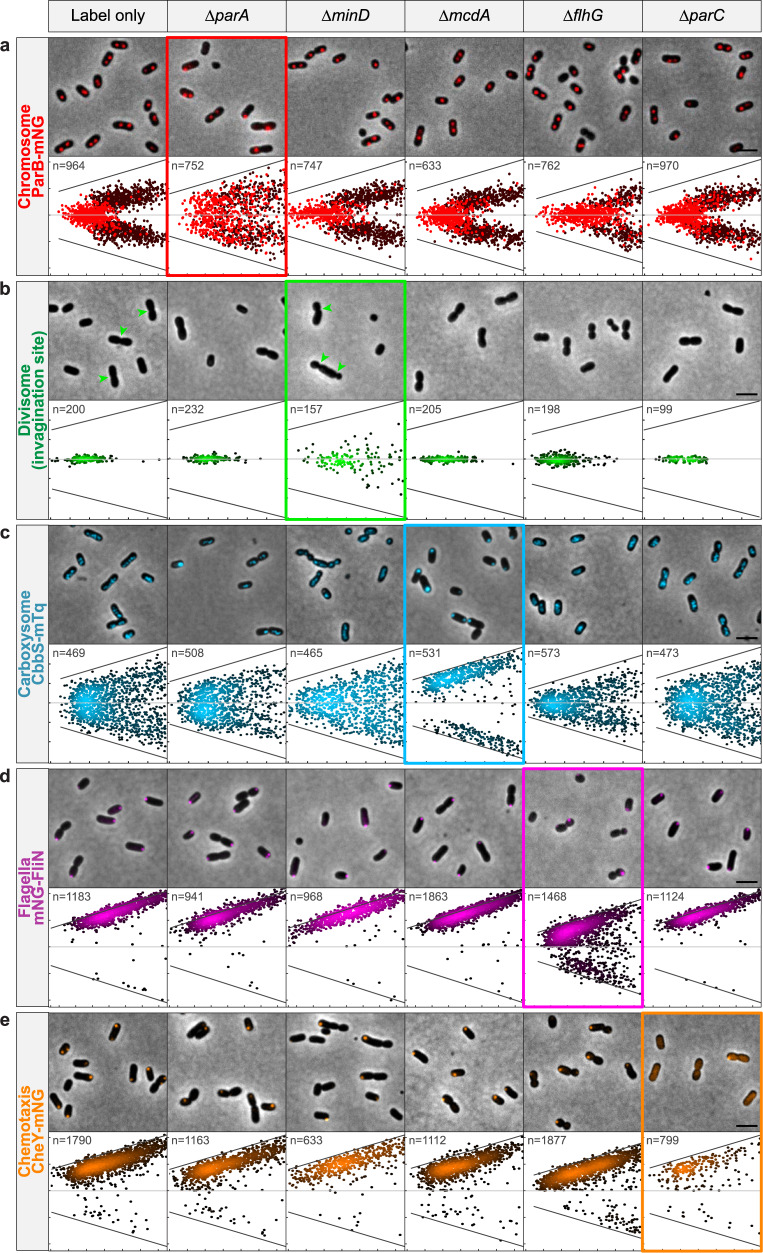
Fig. 3 Cargo positioning is not directly controlled by A/D ATPases encoded at distant loci. Each of the five cellular cargos were fluorescently tagged as indicated (Left): a chromosome (ParB-mNG), b divisome (invagination site), c carboxysomes (CbbS-mTQ), d flagella (mNG-FliN), and e chemotaxis clusters (CheY-mNG). (All images) Micrographs shown are representative images from at least 3 experiments. Scale bar: 2 μm. The “Label Only” column shows the WT positioning of each of the fluorescent cargos. Deletion of an A/D ATPase resulted in the mislocalization of only its specific cargo (bolded rectangles). Graphs in the “label only” column and graphs in the bolded rectangles are duplicated from Fig. 2. Graph axes for chromosome, carboxysome, flagella, and chemotaxis-labelled mutants: x-axis range (cell length): 0.8–2.1 μm; y-axis range (distance from mid-cell): −1.1–1.1 μm. All x-axes of ΔflhG cells are 0.5–1.8 μm. Graph axes for divisome: x-axis range (cell length): 1.5–3.0 μm; y-axis range (distance from mid-cell): −1.5–1.5 μm. Source data are provided as a Source Data file.
Fig. 3 Cargo positioning is not directly controlled by A/D ATPases encoded at distant loci. Each of the five cellular cargos were fluorescently tagged as indicated (Left): a chromosome (ParB-mNG), b divisome (invagination site), c carboxysomes (CbbS-mTQ), d flagella (mNG-FliN), and e chemotaxis clusters (CheY-mNG). (All images) Micrographs shown are representative images from at least 3 experiments. Scale bar: 2 μm. The “Label Only” column shows the WT positioning of each of the fluorescent cargos. Deletion of an A/D ATPase resulted in the mislocalization of only its specific cargo (bolded rectangles). Graphs in the “label only” column and graphs in the bolded rectangles are duplicated from Fig. 2. Graph axes for chromosome, carboxysome, flagella, and chemotaxis-labelled mutants: x-axis range (cell length): 0.8–2.1 μm; y-axis range (distance from mid-cell): −1.1–1.1 μm. All x-axes of ΔflhG cells are 0.5–1.8 μm. Graph axes for divisome: x-axis range (cell length): 1.5–3.0 μm; y-axis range (distance from mid-cell): −1.5–1.5 μm. Source data are provided as a Source Data file.CC BY · PubMed Central
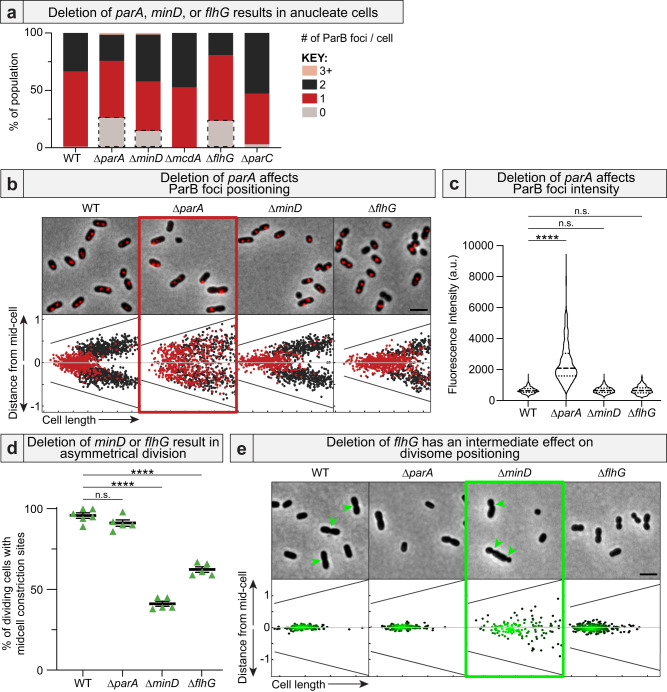
Fig. 4 Anucleate cells form via three different mechanisms. a Deletion of the A/D ATPase required for chromosome (parA), divisome (minD), or flagellar (flhG) positioning resulted in anucleate cells (grey boxes). b Only ΔparA cells had mispositioned ParB foci. Cells with a single ParB focus are red. Cells with two ParB foci are black. ΔflhG cells maintained a single ParB focus in long cells, suggesting a DNA replication defect. c ParB foci are brighter only in ΔparA cells. WT: n = 1289; ∆parA: n = 773; ∆minD: n = 990; ∆flhG: n = 747 biologically independent cells. Kruskal-Wallis p-values: ∆parA: <0.0001; ∆minD: 0.97; ∆flhG: 1. d Deletion of minD or flhG resulted in divisome mispositioning. Constriction sites were considered “mid-cell” when found within 5% of the cell center along the long axis. WT: n = 6; ∆parA, ∆minD, and ∆flhG: n = 5 biologically independent samples. Brown-Forsythe and Welch ANOVA test p-values: ∆parA: 0.28; ∆minD: <0.0001; ∆flhG: <0.0001 e Deletion of flhG resulted in an intermediate effect on divisome positioning when compared to ΔminD. Each dot on the density graph represents one identified constriction site. Lighter colors represent higher density, darker colors represent lower density. Panels b and e are summarized from Fig. 3. (All images) Scale bar: 2 μm. Source data are provided as a Source Data file.
Fig. 4 Anucleate cells form via three different mechanisms. a Deletion of the A/D ATPase required for chromosome (parA), divisome (minD), or flagellar (flhG) positioning resulted in anucleate cells (grey boxes). b Only ΔparA cells had mispositioned ParB foci. Cells with a single ParB focus are red. Cells with two ParB foci are black. ΔflhG cells maintained a single ParB focus in long cells, suggesting a DNA replication defect. c ParB foci are brighter only in ΔparA cells. WT: n = 1289; ∆parA: n = 773; ∆minD: n = 990; ∆flhG: n = 747 biologically independent cells. Kruskal-Wallis p-values: ∆parA: <0.0001; ∆minD: 0.97; ∆flhG: 1. d Deletion of minD or flhG resulted in divisome mispositioning. Constriction sites were considered “mid-cell” when found within 5% of the cell center along the long axis. WT: n = 6; ∆parA, ∆minD, and ∆flhG: n = 5 biologically independent samples. Brown-Forsythe and Welch ANOVA test p-values: ∆parA: 0.28; ∆minD: <0.0001; ∆flhG: <0.0001 e Deletion of flhG resulted in an intermediate effect on divisome positioning when compared to ΔminD. Each dot on the density graph represents one identified constriction site. Lighter colors represent higher density, darker colors represent lower density. Panels b and e are summarized from Fig. 3. (All images) Scale bar: 2 μm. Source data are provided as a Source Data file.CC BY · PubMed Central
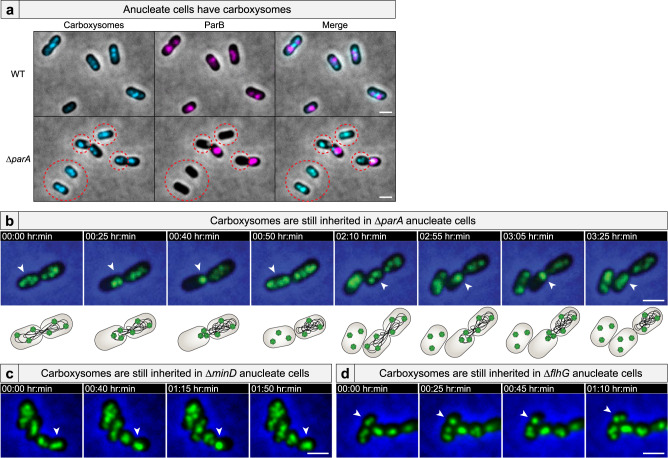
Fig. 5 Anucleate cells inherit carboxysomes. a Carboxysomes are present in anucleate cells (dashed circle). Micrographs shown are representative images from 2 experiments. b Time-lapse microscopy shows that carboxysomes (green) in ΔparA cells are bound to the nucleoid, but are inherited in anucleate cells via release from the extruded chromosome. Carboxysomes are also inherited in c ΔminD anucleate cells and d ΔflhG anucleate cells via the same mechanism. (All videos) White arrows highlight carboxysome bundling and subsequent release. Scale bar: 1 μm.
Fig. 5 Anucleate cells inherit carboxysomes. a Carboxysomes are present in anucleate cells (dashed circle). Micrographs shown are representative images from 2 experiments. b Time-lapse microscopy shows that carboxysomes (green) in ΔparA cells are bound to the nucleoid, but are inherited in anucleate cells via release from the extruded chromosome. Carboxysomes are also inherited in c ΔminD anucleate cells and d ΔflhG anucleate cells via the same mechanism. (All videos) White arrows highlight carboxysome bundling and subsequent release. Scale bar: 1 μm.CC BY · PubMed Central
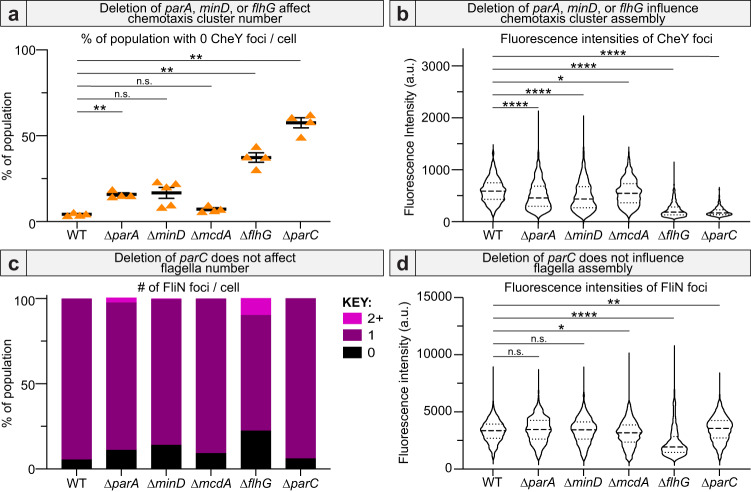
Fig. 6 Deletion of parA, minD, or flhG influences chemotaxis cluster assembly. Deletion of parA, minD, or flhG influences chemotaxis cluster a number (WT: n = 4, ∆parA: n = 4, ∆minD: n = 5, ∆mcdA: n = 4, ∆flhG: n = 4, ∆parC: n = 4 biologically independent samples. Brown-Forsythe and Welch ANOVA test p-values: ∆parA: 0.0013, ∆minD: 0.0642, ∆mcdA: 0.1141, ∆flhG: 0.0043, ∆parC: 0.0012) and b assembly (n = 455 biologically independent cells. Kruskal-Wallis test p-values: ∆parA: <0.0001, ∆minD: <0.0001, ∆mcdA: 0.0171, ∆flhG: <0.0001, ∆parC: <0.0001). Only deletion of flhG substantially influenced flagella c number and d assembly (n = 851 biologically independent cells. Kruskal–Wallis test p-values: ∆parA: 0.1161, ∆minD: 0.4433, ∆mcdA: 0.0184, ∆flhG: <0.0001, ∆parC: 0.0051). Source data are provided as a Source Data file.
Fig. 6 Deletion of parA, minD, or flhG influences chemotaxis cluster assembly. Deletion of parA, minD, or flhG influences chemotaxis cluster a number (WT: n = 4, ∆parA: n = 4, ∆minD: n = 5, ∆mcdA: n = 4, ∆flhG: n = 4, ∆parC: n = 4 biologically independent samples. Brown-Forsythe and Welch ANOVA test p-values: ∆parA: 0.0013, ∆minD: 0.0642, ∆mcdA: 0.1141, ∆flhG: 0.0043, ∆parC: 0.0012) and b assembly (n = 455 biologically independent cells. Kruskal-Wallis test p-values: ∆parA: <0.0001, ∆minD: <0.0001, ∆mcdA: 0.0171, ∆flhG: <0.0001, ∆parC: <0.0001). Only deletion of flhG substantially influenced flagella c number and d assembly (n = 851 biologically independent cells. Kruskal–Wallis test p-values: ∆parA: 0.1161, ∆minD: 0.4433, ∆mcdA: 0.0184, ∆flhG: <0.0001, ∆parC: 0.0051). Source data are provided as a Source Data file.CC BY · PubMed Central
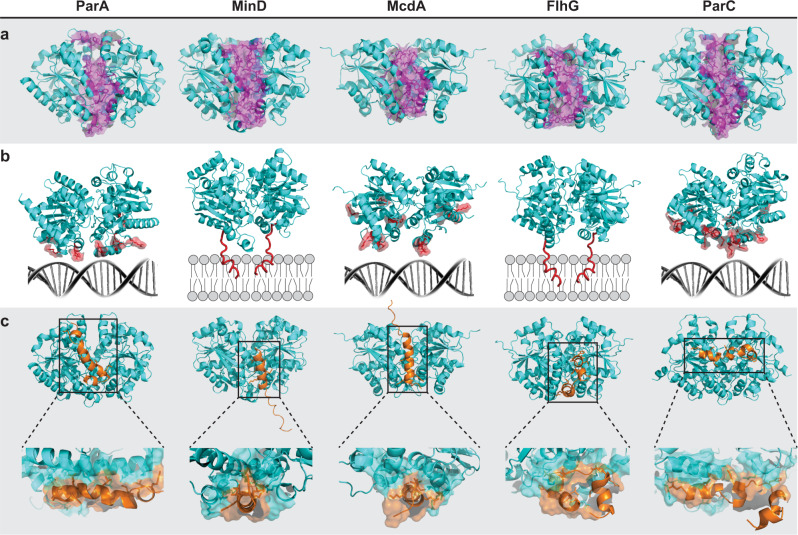
Fig. 7 A/D ATPases have unique interfaces that confer cargo-positioning specificity. a Homodimer structures of the A/D ATPases in H. neapolitanus were generated using AlphaFold2 (cyan). Putative residues for homodimer specificity are highlighted magenta. b Dimers from a are oriented over their positioning matrix—nucleoid DNA or membrane. Putative residues critical for binding nucleoid DNA or membrane are highlighted red. c Dimer structures docked with the N-terminal interacting peptide from putative partner proteins (orange), which confer cargo specificity. Zoomed box: Predicted residues critical for this association are space-filled cyan on the ATPase and orange on the partner protein.
Fig. 7 A/D ATPases have unique interfaces that confer cargo-positioning specificity. a Homodimer structures of the A/D ATPases in H. neapolitanus were generated using AlphaFold2 (cyan). Putative residues for homodimer specificity are highlighted magenta. b Dimers from a are oriented over their positioning matrix—nucleoid DNA or membrane. Putative residues critical for binding nucleoid DNA or membrane are highlighted red. c Dimer structures docked with the N-terminal interacting peptide from putative partner proteins (orange), which confer cargo specificity. Zoomed box: Predicted residues critical for this association are space-filled cyan on the ATPase and orange on the partner protein.CC BY · PubMed Central

Verification

Claims the paper makes

The claims and statistics of this paper haven’t been checked yet.

Run the check — free, no account needed. It reads the open-access text and checks the sources it cites.

A few free checks a day · papers already verified open instantly · results are public

Self-check

Percentages, sums and reported differences re-computed from the paper’s own numbers.

The self-check needs the paper’s full text.

Citations

Cites

Metadata

Authors
Pulianmackal, L., Limcaoco, J. M., Ravi, K., Yang, S., Zhang, J., Tran, M., O'Meara, M., & Vecchiarelli, A.
Affiliations
  • University of Michigan (US)
  • University of Michigan
Corresponding author
Vecchiarelli, Anthony
Venue
Nature Communications
Published
2023-01-20
Volume
14
Issue
1
Pages
3255-3255
ISSN
2041-1723 (ISSN-L)
OpenAlex
W4379471404
Cited by
23
References
1
Citations by year
2026: 2 · 2025: 14 · 2024: 5 · 2023: 2
FWCI
3.82
Type
journal article
Language
en
Open access
Locations
  • Nature Communications (publishedVersion, cc-by)
  • Research Square (acceptedVersion, cc-by)
  • PubMed Central (publishedVersion, cc-by)
  • PubMed (publishedVersion)
  • DOAJ (DOAJ: Directory of Open Access Journals) (submittedVersion, cc-by-sa)
Funders
National Science Foundation (1817478, 1941966, 1841052)
Topics
  • Life Sciences › Biochemistry, Genetics and Molecular Biology › Genetics › Bacterial Genetics and Biotechnology
  • Life Sciences › Biochemistry, Genetics and Molecular Biology › Cell Biology › Microtubule and mitosis dynamics
  • Life Sciences › Biochemistry, Genetics and Molecular Biology › Molecular Biology › Genomics and Chromatin Dynamics
Keywords
bacterial chromosome segregation, Halothiobacillus neapolitanus, cell division, spatial regulation
MeSH terms
Adenosine Triphosphatases, Bacteria, Bacterial Proteins, Biological Transport, Cell Division, Chromosome Segregation

About these checks

Registry, retraction, Cites and statistics results are computed, not judged, with one exception: a printed reference that no index lists is read once by a model before it counts as a citation error. Claims are extracted by a model and kept only when their quote appears verbatim in the text; each cited source is then checked, with a model’s help, for whether it says what the claim relies on. Those verdicts can be wrong — read the claim’s quote and the cited source before relying on one.

Statistics and arithmetic are recomputed, not judged.

Confidence bands are shown only for fields calibrated on our annotated test set. None is calibrated yet, so no band is shown.

What counts as a claim ›How we measure confidence ›How we check this ›

Are you an author, or do you see a problem with this page? Request a review