PreprintCited by 18Treatment of Major DepressionNeurotransmitter Receptor Influence on BehaviorNeuroscience and Neuropharmacology Research

The DOI matches its Crossref record; 1 of the 1 references it cites were found in a registry or an index.

Serotonin is a Common Thread Linking Different Classes of Antidepressants

Open access

Preprint — published as 10.1016/j.chembiol.2023.10.009 · Paper page

Abstract

Depression pathology remains elusive. The monoamine hypothesis has placed much focus on serotonin, but due to the variable clinical efficacy of monoamine reuptake inhibitors, the community is looking for alternative therapies such as ketamine (synaptic plasticity and neurogenesis theory of antidepressant action). There is evidence that different classes of antidepressants may affect serotonin levels; a notion we test here. We measure hippocampal serotonin in mice with voltammetry and study the effects of acute challenges of antidepressants. We find that pseudo-equivalent doses of these drugs similarly raise ambient serotonin levels, despite their differing pharmacodynamics because of differences in Uptake 1 and 2, rapid SERT trafficking and modulation of serotonin by histamine. These antidepressants have different pharmacodynamics but have strikingly similar effects on extracellular serotonin. Our findings suggest that serotonin is a common thread that links clinically effective antidepressants, synergizing different theories of depression (synaptic plasticity, neurogenesis and the monoamine hypothesis).

Overview

The claims and statistics of this paper haven’t been checked yet.

Run the check — free, no account needed. It reads the open-access text and checks the sources it cites.

A few free checks a day · papers already verified open instantly · results are public

Integrity signals

Registry

Crossref · 10.21203/rs.3.rs-2741902/v1

Cites

1 of 1 references verified0 citation errors · 0 not checkable

Statistics

Figures

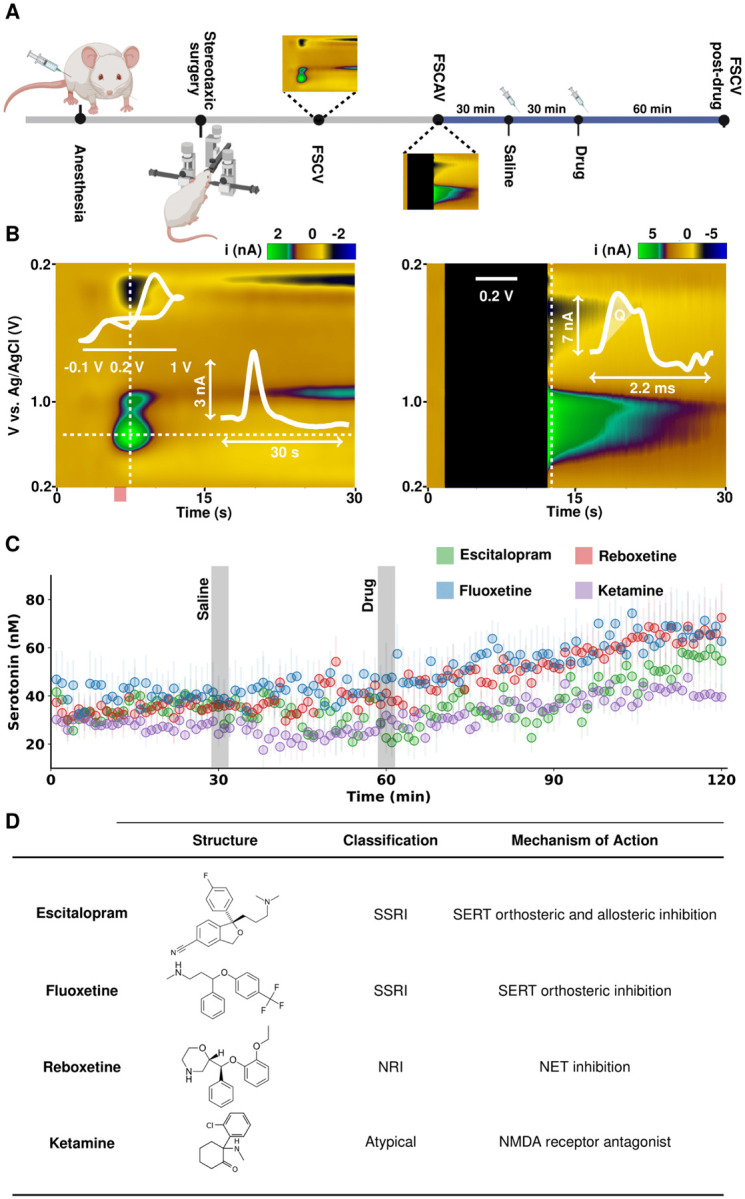
Figure 1. (A) Illustration of experimental paradigm for in vivo voltammetry for serotonin measurements with FSCV and FSCAV. (B) Representative in vivo serotonin color plots from FSCV (left) and FSCAV (right) signals. The FSCV plot has an inset cyclic voltammogram (top) and current vs. time trace (bottom). The FSCAV plot has an inset cyclic voltammogram where the serotonin peak is integrated for its charge (Q). (C) Effect of antidepressant therapies on ambient serotonin levels. After 30 minutes of baseline measurements, 5 mL kg−1 saline was administered (i.p.). Then, 20 mg kg−1 fluoxetine (blue), 10 mg kg−1 escitalopram (green), 20 mg kg−1 reboxetine (red) or 10 mg kg−1 ketamine (purple) was administered i.p. 30 minutes after saline. Each trace shows the average (n = 5 mice from a mixed sex cohort) and associated standard error of the mean (SEM) as error bars. (D) Table outlining the antidepressants used in this study, their structure, classification as an antidepressant and proposed mechanisms of action.
Figure 1. (A) Illustration of experimental paradigm for in vivo voltammetry for serotonin measurements with FSCV and FSCAV. (B) Representative in vivo serotonin color plots from FSCV (left) and FSCAV (right) signals. The FSCV plot has an inset cyclic voltammogram (top) and current vs. time trace (bottom). The FSCAV plot has an inset cyclic voltammogram where the serotonin peak is integrated for its charge (Q). (C) Effect of antidepressant therapies on ambient serotonin levels. After 30 minutes of baseline measurements, 5 mL kg−1 saline was administered (i.p.). Then, 20 mg kg−1 fluoxetine (blue), 10 mg kg−1 escitalopram (green), 20 mg kg−1 reboxetine (red) or 10 mg kg−1 ketamine (purple) was administered i.p. 30 minutes after saline. Each trace shows the average (n = 5 mice from a mixed sex cohort) and associated standard error of the mean (SEM) as error bars. (D) Table outlining the antidepressants used in this study, their structure, classification as an antidepressant and proposed mechanisms of action.CC BY · PubMed Central
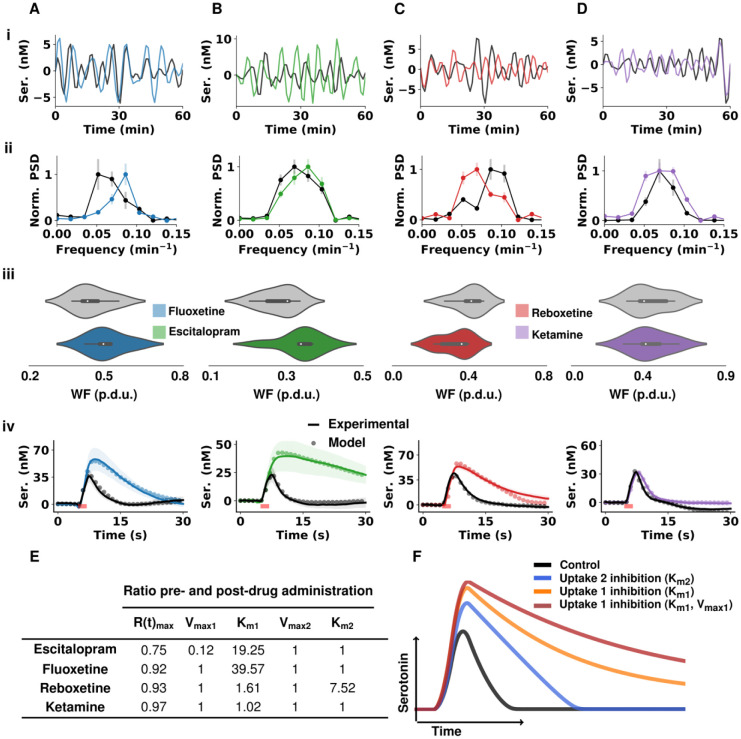
Figure 2. (A) data representing fluoxetine (B) data representing escitalopram (C) data representing reboxetine (D) data representing ketamine (i) Representative FSCAV serotonin (ser.) extracellular oscillations over 60 minutes with control in black and post-drug administration in color. Time series were bandpass filtered (3rd order Butterworth filter with cutoff frequencies of 0.0008 Hz and 0.005 Hz to remove high frequency noise and slow drug effects on the serotonin extracellular levels. (ii) Normalized mean and SEM (n = 5 animals) power spectrum density of control FSCAV data (black) and post-drug data (color). (iii) Violin plots of the distribution of power-weighted frequencies (n = 5 animals for each drug) of the power spectra pre- (gray) and post-drug (color) administration shown in ii. (iv) current vs. time profiles from stimulated serotonin release in the CA2 pre- and post-drug administration (n = 5 mice for fluoxetine, reboxetine and ketamine and n = 9 for escitalopram). The solid black traces are from control files and the colored traces are 60 minutes post-drug administration (i.p.). Modeled data are laid over their respective traces with dots. The start and end of stimulation is shown with a red bar. (E) Table of M-M terms from modeled data in iv. Each value is the ratio of change post-drug with respect to the control state. (F) Modeled traces with varied M-M terms. Control modeled trace is shown in black (Km1 = 2 nM, Vmax1 = 12 nM s−1, Km2 = 170 nM, Vmax2 = 780 nM s−1), competitive Uptake 2 inhibition (Km2 is 10-fold the control value) in blue, Uptake 1 competitive inhibition (Km1 is 10-fold the control value) in orange and Uptake 1 (Km1 is 10-fold and Vmax1 is 50% of the control values) in red.
Figure 2. (A) data representing fluoxetine (B) data representing escitalopram (C) data representing reboxetine (D) data representing ketamine (i) Representative FSCAV serotonin (ser.) extracellular oscillations over 60 minutes with control in black and post-drug administration in color. Time series were bandpass filtered (3rd order Butterworth filter with cutoff frequencies of 0.0008 Hz and 0.005 Hz to remove high frequency noise and slow drug effects on the serotonin extracellular levels. (ii) Normalized mean and SEM (n = 5 animals) power spectrum density of control FSCAV data (black) and post-drug data (color). (iii) Violin plots of the distribution of power-weighted frequencies (n = 5 animals for each drug) of the power spectra pre- (gray) and post-drug (color) administration shown in ii. (iv) current vs. time profiles from stimulated serotonin release in the CA2 pre- and post-drug administration (n = 5 mice for fluoxetine, reboxetine and ketamine and n = 9 for escitalopram). The solid black traces are from control files and the colored traces are 60 minutes post-drug administration (i.p.). Modeled data are laid over their respective traces with dots. The start and end of stimulation is shown with a red bar. (E) Table of M-M terms from modeled data in iv. Each value is the ratio of change post-drug with respect to the control state. (F) Modeled traces with varied M-M terms. Control modeled trace is shown in black (Km1 = 2 nM, Vmax1 = 12 nM s−1, Km2 = 170 nM, Vmax2 = 780 nM s−1), competitive Uptake 2 inhibition (Km2 is 10-fold the control value) in blue, Uptake 1 competitive inhibition (Km1 is 10-fold the control value) in orange and Uptake 1 (Km1 is 10-fold and Vmax1 is 50% of the control values) in red.CC BY · PubMed Central
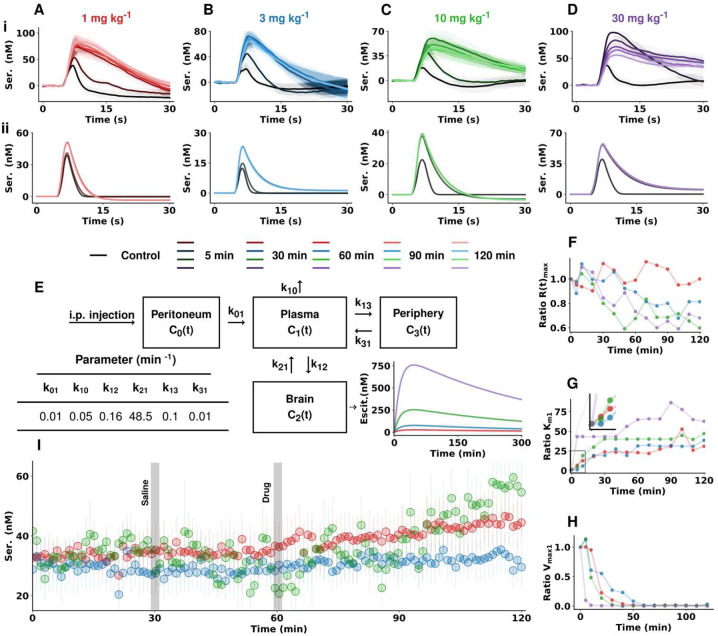
Figure 3. Escitalopram data for (A) 1 mg kg−1 (B) 3 mg kg−1 (C) 10 mg kg−1 (D) 30 mg kg−1. (i) Evoked serotonin concentration vs. time traces from the CA2 region of the hippocampus of female mice before and after escitalopram (escit) administration (n = 4 animals each dose, mean ± SEM). (ii) Modeled serotonin concentration vs. time traces from the control data and after changing Km1 based on a simulated concentration of escitalopram in the hippocampus with time according to the pharmacokinetic model depicted in (E) (see Methods section for a detailed description of the model). Compartment rate constants are obtained from literature of previous pharmacokinetic models of escitalopram in mice(11) (F-H) Modeled changes in maximum release rate of serotonin (F), Km1 (G) and Vmax1 (H) for each dose and over time after drug injection. (I) FSCAV recordings of absolute concentrations of extracellular serotonin following the same experimental paradigm as described in Figure 1 for 3 different doses of escitalopram (mixed sex cohorts, n = 5 animals for 1 mg kg−1 dose, n = 7 animals for 3 mg kg−1 and 10 mg kg−1 doses).
Figure 3. Escitalopram data for (A) 1 mg kg−1 (B) 3 mg kg−1 (C) 10 mg kg−1 (D) 30 mg kg−1. (i) Evoked serotonin concentration vs. time traces from the CA2 region of the hippocampus of female mice before and after escitalopram (escit) administration (n = 4 animals each dose, mean ± SEM). (ii) Modeled serotonin concentration vs. time traces from the control data and after changing Km1 based on a simulated concentration of escitalopram in the hippocampus with time according to the pharmacokinetic model depicted in (E) (see Methods section for a detailed description of the model). Compartment rate constants are obtained from literature of previous pharmacokinetic models of escitalopram in mice(11) (F-H) Modeled changes in maximum release rate of serotonin (F), Km1 (G) and Vmax1 (H) for each dose and over time after drug injection. (I) FSCAV recordings of absolute concentrations of extracellular serotonin following the same experimental paradigm as described in Figure 1 for 3 different doses of escitalopram (mixed sex cohorts, n = 5 animals for 1 mg kg−1 dose, n = 7 animals for 3 mg kg−1 and 10 mg kg−1 doses).CC BY · PubMed Central
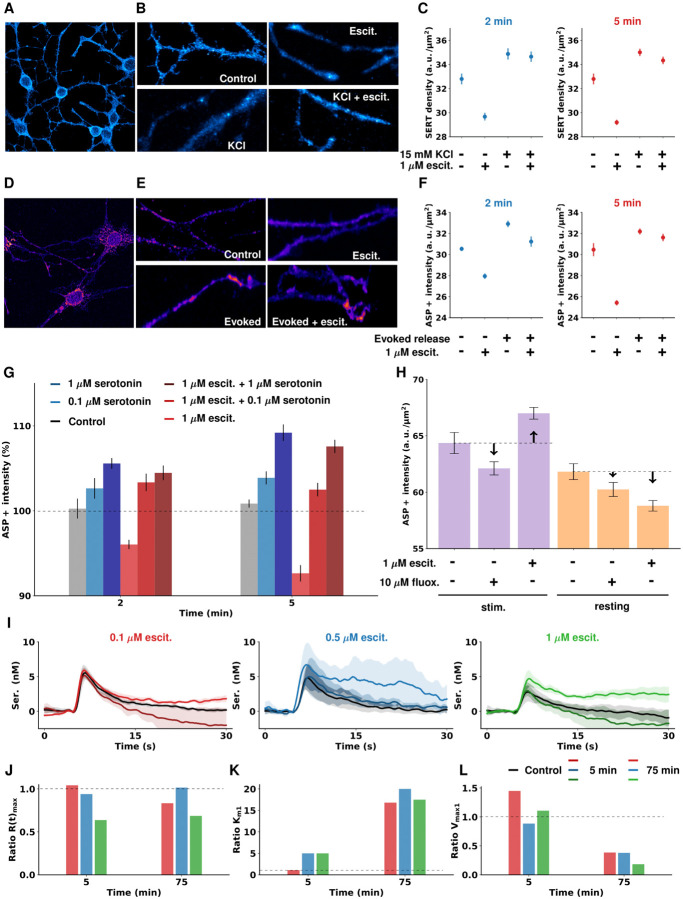
Figure 4. (A) Immunofluorescence of cell surface-located SERT molecules. Fluorescence signals for SERT antibodies targeted against the second extracellular loop localized to neurites and cell bodies of 1C115-HT. (B) Representative regions of interest used for quantification of SERT cell surface density in absence and presence of 1 μM escitalopram with and without high potassium-induced serotonin release 2 min after administration. (C) Average and SEM (n = 80) calculated SERT density in cell cultures 2 and 5 minutes after 15 mM KCl and/or 1 μM escitalopram administration. High potassium-evoked serotonin release results in elevated SERT cell surface densities and diminishes acute escitalopram-induced SERT internalization. (D) The fluorescent SERT substrate ASP+ is taken up by 1C115-HT cells and localizes to neurites and cell bodies. (E) Representative regions of interest used for quantification of SERT uptake in absence and presence of 1 μM escitalopram with (evoked) and without (resting) electrical stimulation for serotonin release. (F) Average and SEM (n = 37) ASP+ uptake measurements in cell cultures after evoked release of serotonin and/or 1 μM escitalopram administration. Electrically evoked serotonin release results in increased uptake of fluorescent SERT substrate 2 and 5 minutes after stimulation while escitalopram treatment on its own diminishes SERT-dependent uptake. (Note: more uptake reflects more functional SERT molecules; less uptake means either internalized or inhibited SERT molecules). (G) Average and SEM (n = 37) ASP+ uptake under administration of serotonin (0.1 μM or 1 μM), escitalopram (1 μM) or both. (H) Mean and SEM (n = 50) comparison of ASP+ uptake by 1C115-HT exposed to either 1 μM escitalopram or 10 μM fluoxetine (fluox.) during rest or 5 minutes after electrical stimulation. Compared to escitalopram treatment, fluoxetine treatment did not significantly affect ASP+ uptake. (I) Mean and SEM (n = 3 cell dishes) evoked voltammetric recordings of serotonin release in control state and 5 and 75 minutes after escitalopram administration (0.1 μM, 0.5 μM, 1 μM). (J, K, L) Fitted Michaelis-Menten parameters (R(t)max, Km1 and Vmax1) of the concentration vs. time traces shown in panel I. Dashed lines represent a ratio of 1 in G and J-L and the control levels in H.
Figure 4. (A) Immunofluorescence of cell surface-located SERT molecules. Fluorescence signals for SERT antibodies targeted against the second extracellular loop localized to neurites and cell bodies of 1C115-HT. (B) Representative regions of interest used for quantification of SERT cell surface density in absence and presence of 1 μM escitalopram with and without high potassium-induced serotonin release 2 min after administration. (C) Average and SEM (n = 80) calculated SERT density in cell cultures 2 and 5 minutes after 15 mM KCl and/or 1 μM escitalopram administration. High potassium-evoked serotonin release results in elevated SERT cell surface densities and diminishes acute escitalopram-induced SERT internalization. (D) The fluorescent SERT substrate ASP+ is taken up by 1C115-HT cells and localizes to neurites and cell bodies. (E) Representative regions of interest used for quantification of SERT uptake in absence and presence of 1 μM escitalopram with (evoked) and without (resting) electrical stimulation for serotonin release. (F) Average and SEM (n = 37) ASP+ uptake measurements in cell cultures after evoked release of serotonin and/or 1 μM escitalopram administration. Electrically evoked serotonin release results in increased uptake of fluorescent SERT substrate 2 and 5 minutes after stimulation while escitalopram treatment on its own diminishes SERT-dependent uptake. (Note: more uptake reflects more functional SERT molecules; less uptake means either internalized or inhibited SERT molecules). (G) Average and SEM (n = 37) ASP+ uptake under administration of serotonin (0.1 μM or 1 μM), escitalopram (1 μM) or both. (H) Mean and SEM (n = 50) comparison of ASP+ uptake by 1C115-HT exposed to either 1 μM escitalopram or 10 μM fluoxetine (fluox.) during rest or 5 minutes after electrical stimulation. Compared to escitalopram treatment, fluoxetine treatment did not significantly affect ASP+ uptake. (I) Mean and SEM (n = 3 cell dishes) evoked voltammetric recordings of serotonin release in control state and 5 and 75 minutes after escitalopram administration (0.1 μM, 0.5 μM, 1 μM). (J, K, L) Fitted Michaelis-Menten parameters (R(t)max, Km1 and Vmax1) of the concentration vs. time traces shown in panel I. Dashed lines represent a ratio of 1 in G and J-L and the control levels in H.CC BY · PubMed Central
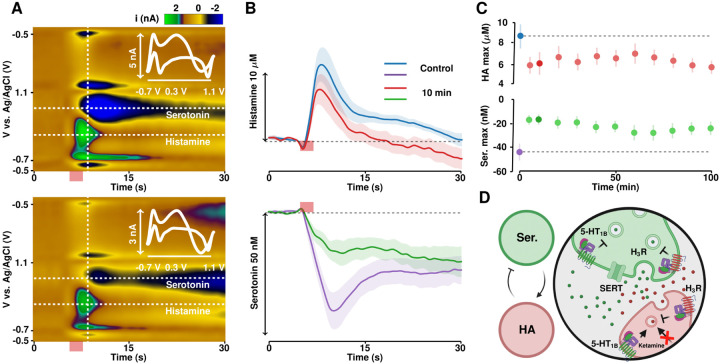
Figure 5. (A) Representative color plots for simultaneous histamine and serotonin monitoring pre-ketamine administration (top) and 40 minutes post-ketamine administration (bottom) with the associated cyclic voltammograms interlaid. (B) IT curves for histamine (top) and serotonin (bottom) pre-and post-ketamine. (C) Evoked histamine amplitude (top) and serotonin inhibition (bottom) over time. (D) Suggested mechanism of action of ketamine on histamine and serotonin.
Figure 5. (A) Representative color plots for simultaneous histamine and serotonin monitoring pre-ketamine administration (top) and 40 minutes post-ketamine administration (bottom) with the associated cyclic voltammograms interlaid. (B) IT curves for histamine (top) and serotonin (bottom) pre-and post-ketamine. (C) Evoked histamine amplitude (top) and serotonin inhibition (bottom) over time. (D) Suggested mechanism of action of ketamine on histamine and serotonin.CC BY · PubMed Central

Verification

Claims the paper makes

The claims and statistics of this paper haven’t been checked yet.

Run the check — free, no account needed. It reads the open-access text and checks the sources it cites.

A few free checks a day · papers already verified open instantly · results are public

Self-check

Percentages, sums and reported differences re-computed from the paper’s own numbers.

The self-check needs the paper’s full text.

Citations

Cites

Metadata

Authors
Witt, C. E., Mena, S., Holmes, J., Hersey, M., Buchanan, A. M., Parke, B., Saylor, R., Honan, L. E., Berger, S. N., Lumbreras, S., Nijhout, F. H., Reed, M. C., Best, J., Fadel, J., Schloss, P., Lau, T., & Hashemi, P.
Affiliations
  • University of South Carolina (US)
  • Imperial College London (GB)
  • Heidelberg University (DE)
  • Duke University (US)
  • The Ohio State University (US)
Corresponding author
Hashemi, Parastoo
Venue
Cell chemical biology
Published
2023-03-28
Volume
30
Issue
12
Pages
1557-1570.e6
ISSN
2451-9448 (ISSN-L)
OpenAlex
W4388871305
Cited by
18
References
1
Citations by year
2026: 7 · 2025: 3 · 2024: 7 · 2023: 1
FWCI
2.79
Type
journal article
Language
en
Open access
Locations
  • Cell chemical biology (publishedVersion)
  • Research Square (acceptedVersion, cc-by)
  • PubMed (publishedVersion)
  • PubMed Central (submittedVersion, cc-by)
Funders
  • University of South Carolina (R01AG050518, R01MH106563)
  • Chinese Academy of Medical Sciences
  • National Institutes of Health
  • National Institute on Aging (RF1AG050518, R01AG050518)
  • National Institute of Mental Health (R01MH106563)
  • National Institute of Diabetes and Digestive and Kidney Diseases (T32DK062710, P30DK056336)
  • Chinese American Medical Society
Topics
  • Health Sciences › Medicine › Pharmacology (medical) › Treatment of Major Depression
  • Life Sciences › Neuroscience › Cellular and Molecular Neuroscience › Neurotransmitter Receptor Influence on Behavior
  • Life Sciences › Neuroscience › Cellular and Molecular Neuroscience › Neuroscience and Neuropharmacology Research
Keywords
serotonin, antidepressants, depression, hippocampus, extracellular serotonin, monoamine hypothesis, monoamine reuptake inhibitors, escitalopram, fluoxetine, reboxetine, ketamine, serotonin transporter, neurogenesis, synaptic plasticity, voltammetry

About these checks

Registry, retraction, Cites and statistics results are computed, not judged, with one exception: a printed reference that no index lists is read once by a model before it counts as a citation error. Claims are extracted by a model and kept only when their quote appears verbatim in the text; each cited source is then checked, with a model’s help, for whether it says what the claim relies on. Those verdicts can be wrong — read the claim’s quote and the cited source before relying on one.

Statistics and arithmetic are recomputed, not judged.

Confidence bands are shown only for fields calibrated on our annotated test set. None is calibrated yet, so no band is shown.

What counts as a claim ›How we measure confidence ›How we check this ›

Are you an author, or do you see a problem with this page? Request a review