CoChat

GTalign: High-performance protein structure alignment, superposition, and search

Open access
Margelevicius, Mindaugas · 2024 · Nature Communications

Preprint — published as 10.1038/s41467-024-51669-z

The DOI matches its Crossref record; its reference list is not available.

Abstract

In response to the challenge posed by vast protein structure repositories, GTalign offers an innovative solution to protein structure alignment and search—an algorithm that achieves optimal superposition at unprecedented speeds. Rigorous evaluation across diverse datasets reveals GTalign as the most accurate among structure aligners while presenting orders of magnitude in speedup at state-of-the-art accuracy.

Overview

The claims and statistics of this paper haven’t been checked yet.

Free: it reads the open-access text and checks the first 5 claims that cite a source we can check. Create a free account to check every claim.

A few free checks a day · papers already verified open instantly · results are public

Integrity signals

Registry

Crossref · 10.21203/rs.3.rs-3820640/v1

Cites

Statistics

Figures

Fig. 1 Results. a Illustration of matching protein structures with O(1) time complexity. GTalign explores numerous superpositions in parallel. Upon obtaining a superposition, the alignment between the query protein (red) and the subject protein (blue) is generated using the subject protein’s spatial index. This index allows for the independent retrieval of the nearest residue in the subject protein for each residue in the query protein, enabling parallel processing. b Benchmarking results on the SCOPe40 2.08 dataset with 2045 queries and 15,177 database entries. Parameterized runs of GTalign, TM-align, and Foldseek are included. The left panel plots the cumulative TM-score (normalized by the shorter protein length) against the number of top alignments ranked by a tool’s measure (TM-score, Z-score, or P-value). In the middle panel, the alignments are sorted by their (TM-align-obtained) TM-score. Vertical lines indicate the number of alignments with a TM-score ≥0.5. The arrow denotes the largest difference in that number between GTalign (732,024) and Foldseek (13,371). The right panel shows the cumulative TM-score plotted against runtime in seconds. c Benchmarking results on the PDB20 dataset with 186 queries and 18,801 database entries. d Benchmarking results on the Swiss-Prot dataset with 40 queries and 542,378 database entries. DeepAlign, Dali, and FATCAT are excluded due to their long projected execution times. The Foldseek curves appear truncated due to the total number of hits it produced. The axes scales in Panels b–d are chosen to accommodate the maximum values of the cumulative TM-score and the number of top hits with a TM-score ≥0.5. Source data are provided as a Source data file.
Fig. 1 Results. a Illustration of matching protein structures with O(1) time complexity. GTalign explores numerous superpositions in parallel. Upon obtaining a superposition, the alignment between the query protein (red) and the subject protein (blue) is generated using the subject protein’s spatial index. This index allows for the independent retrieval of the nearest residue in the subject protein for each residue in the query protein, enabling parallel processing. b Benchmarking results on the SCOPe40 2.08 dataset with 2045 queries and 15,177 database entries. Parameterized runs of GTalign, TM-align, and Foldseek are included. The left panel plots the cumulative TM-score (normalized by the shorter protein length) against the number of top alignments ranked by a tool’s measure (TM-score, Z-score, or P-value). In the middle panel, the alignments are sorted by their (TM-align-obtained) TM-score. Vertical lines indicate the number of alignments with a TM-score ≥0.5. The arrow denotes the largest difference in that number between GTalign (732,024) and Foldseek (13,371). The right panel shows the cumulative TM-score plotted against runtime in seconds. c Benchmarking results on the PDB20 dataset with 186 queries and 18,801 database entries. d Benchmarking results on the Swiss-Prot dataset with 40 queries and 542,378 database entries. DeepAlign, Dali, and FATCAT are excluded due to their long projected execution times. The Foldseek curves appear truncated due to the total number of hits it produced. The axes scales in Panels b–d are chosen to accommodate the maximum values of the cumulative TM-score and the number of top hits with a TM-score ≥0.5. Source data are provided as a Source data file.CC BY · PubMed Central
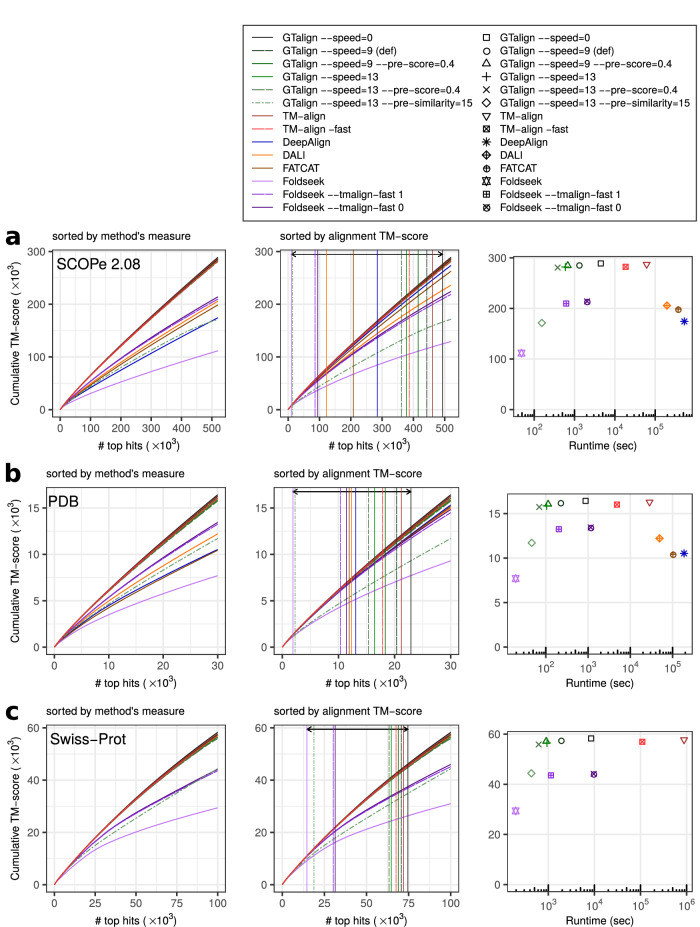
Fig. 2 Alignment evaluation results based on the TM-score normalized by the query length. a Benchmarking results on the SCOPe40 2.08 dataset with 2045 queries and 15,177 database entries. The left panel plots the cumulative TM-score (normalized by the query length) against the number of top alignments ranked by a tool’s measure (TM-score, Z-score, or P-value). In the middle panel, the alignments are sorted by the TM-align-obtained TM-score. Vertical lines denote the number of alignments with a TM-score ≥0.5. The arrow highlights the largest difference in that number between GTalign (492,887) and Foldseek (10,375). The right panel shows the cumulative TM-score plotted against runtime in seconds. b Results on the PDB20 dataset with 186 queries and 18,801 database entries. c Results on the Swiss-Prot dataset with 40 queries and 542,378 database entries. Excluding DeepAlign, Dali, and FATCAT due to their long projected execution times. Source data are provided as a Source data file.
Fig. 2 Alignment evaluation results based on the TM-score normalized by the query length. a Benchmarking results on the SCOPe40 2.08 dataset with 2045 queries and 15,177 database entries. The left panel plots the cumulative TM-score (normalized by the query length) against the number of top alignments ranked by a tool’s measure (TM-score, Z-score, or P-value). In the middle panel, the alignments are sorted by the TM-align-obtained TM-score. Vertical lines denote the number of alignments with a TM-score ≥0.5. The arrow highlights the largest difference in that number between GTalign (492,887) and Foldseek (10,375). The right panel shows the cumulative TM-score plotted against runtime in seconds. b Results on the PDB20 dataset with 186 queries and 18,801 database entries. c Results on the Swiss-Prot dataset with 40 queries and 542,378 database entries. Excluding DeepAlign, Dali, and FATCAT due to their long projected execution times. Source data are provided as a Source data file.CC BY · PubMed Central
Fig. 3 Benchmarking results on the HOMSTRAD dataset. Each plot illustrates the distribution of TM-scores between two tools. The black line indicates identical distributions. 100 structure pairs for which Dali did not produce any alignment are excluded from the corresponding plot. “Reference” represents the original alignments in the database. Source data are provided as a Source data file.
Fig. 3 Benchmarking results on the HOMSTRAD dataset. Each plot illustrates the distribution of TM-scores between two tools. The black line indicates identical distributions. 100 structure pairs for which Dali did not produce any alignment are excluded from the corresponding plot. “Reference” represents the original alignments in the database. Source data are provided as a Source data file.CC BY · PubMed Central
Fig. 4 Results of local alignment evaluation. Alignment evaluation results for the SCOPe40 2.08, PDB20, and Swiss-Prot datasets using RMSD (root-mean-squared deviation, a) and GDT_TS (global distance test) scores (b) normalized by the number of aligned residue pairs. The panels display the cumulative RMSD and GDT_TS scores plotted against the number of top alignments ranked by a tool’s measure (TM-score, Z-score, or P-value). Foldseek alignments were ranked by Foldseek’s TM-score, resulting in lower RMSDs and higher GDT_TS scores. The curves of the TM-align and GTalign variants, excluding GTalign --speed=13--pre-similarity=15, closely match. Source data are provided as a Source data file.
Fig. 4 Results of local alignment evaluation. Alignment evaluation results for the SCOPe40 2.08, PDB20, and Swiss-Prot datasets using RMSD (root-mean-squared deviation, a) and GDT_TS (global distance test) scores (b) normalized by the number of aligned residue pairs. The panels display the cumulative RMSD and GDT_TS scores plotted against the number of top alignments ranked by a tool’s measure (TM-score, Z-score, or P-value). Foldseek alignments were ranked by Foldseek’s TM-score, resulting in lower RMSDs and higher GDT_TS scores. The curves of the TM-align and GTalign variants, excluding GTalign --speed=13--pre-similarity=15, closely match. Source data are provided as a Source data file.CC BY · PubMed Central
Fig. 5 Weighted precision-recall (PR) curves at the family, superfamily, and fold levels. The areas under these PR curves are reported in Supplementary Table S7. a False positives for calculating precision and recall are pairs of structures from different SCOPe 2.08 folds, with the exception that those pairs belonging to Rossman-like (c.2–c.5, c.27, c.28, c.30, and c.31) or beta-propeller (b.66–b.70) folds are ignored35. b False positives correspond to pairs from different SCOPe 2.08 folds without exceptions. Source data are provided as a Source data file.
Fig. 5 Weighted precision-recall (PR) curves at the family, superfamily, and fold levels. The areas under these PR curves are reported in Supplementary Table S7. a False positives for calculating precision and recall are pairs of structures from different SCOPe 2.08 folds, with the exception that those pairs belonging to Rossman-like (c.2–c.5, c.27, c.28, c.30, and c.31) or beta-propeller (b.66–b.70) folds are ignored35. b False positives correspond to pairs from different SCOPe 2.08 folds without exceptions. Source data are provided as a Source data file.CC BY · PubMed Central
Fig. 6 Distributions of TM-scores (>0.5) for domain pairs within the same and different SCOPe 2.08 folds, presented in bins of width 0.1. TM-scores, normalized by the length of the shorter protein, were calculated by aligning query and subject structures from the SCOPe40 2.08 dataset using TM-align. Representative examples of structure pairs from different folds and classes are provided for each TM-score bin. These examples, along with numerous other significantly structurally similar pairs from different folds and classes, are considered errors (false positives) in the reference SCOPe-based evaluation. Source data are provided as a Source data file.
Fig. 6 Distributions of TM-scores (>0.5) for domain pairs within the same and different SCOPe 2.08 folds, presented in bins of width 0.1. TM-scores, normalized by the length of the shorter protein, were calculated by aligning query and subject structures from the SCOPe40 2.08 dataset using TM-align. Representative examples of structure pairs from different folds and classes are provided for each TM-score bin. These examples, along with numerous other significantly structurally similar pairs from different folds and classes, are considered errors (false positives) in the reference SCOPe-based evaluation. Source data are provided as a Source data file.CC BY · PubMed Central
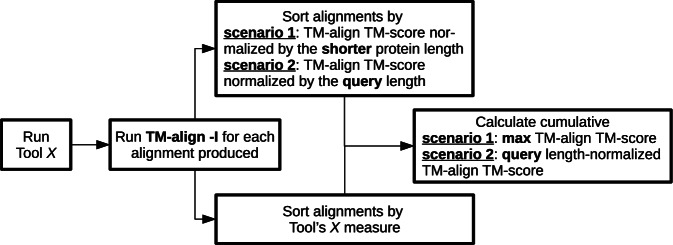
Fig. 7 Schematic for benchmarking structure alignment tools. The entire procedure can be described as follows: (i) Run a structure alignment tool; (ii) Use TM-align to calculate the TM-score for each produced alignment; (iii) Sort the alignments by the tool’s measure (e.g., P-value, Z-score, etc.); (iv) In addition, sort the alignments by the TM-score calculated by TM-align; (v) Finally, calculate the cumulative TM-score for the results, considering both the sorting by the tool’s measure and the sorting by the TM-align-obtained TM-score. This provides a comprehensive measure of how accurately the tool produces alignments and their rate. It’s worth noting that seemingly subtle differences in cumulative TM-score can be significant, especially considering the narrow gap between successive TM-scores; a mere 0.2 difference can distinguish between an accurate and inaccurate alignment.
Fig. 7 Schematic for benchmarking structure alignment tools. The entire procedure can be described as follows: (i) Run a structure alignment tool; (ii) Use TM-align to calculate the TM-score for each produced alignment; (iii) Sort the alignments by the tool’s measure (e.g., P-value, Z-score, etc.); (iv) In addition, sort the alignments by the TM-score calculated by TM-align; (v) Finally, calculate the cumulative TM-score for the results, considering both the sorting by the tool’s measure and the sorting by the TM-align-obtained TM-score. This provides a comprehensive measure of how accurately the tool produces alignments and their rate. It’s worth noting that seemingly subtle differences in cumulative TM-score can be significant, especially considering the narrow gap between successive TM-scores; a mere 0.2 difference can distinguish between an accurate and inaccurate alignment.CC BY · PubMed Central

Verification

Claims the paper makes

The claims and statistics of this paper haven’t been checked yet.

Free: it reads the open-access text and checks the first 5 claims that cite a source we can check. Create a free account to check every claim.

A few free checks a day · papers already verified open instantly · results are public

Self-check

Percentages, sums and reported differences re-computed from the paper’s own numbers.

The self-check needs the paper’s full text.

Citations

No citation lists for this paper

No citation lists for this paper yet — checked again daily.

References 51 · Cited by 23

Metadata

Authors
Margelevicius, M.
Affiliations
Vilnius University
Venue
Nature Communications
Published
2024-01-18
Volume
15
Issue
1
Pages
7305-7305
ISSN
2041-1723 (ISSN-L)
OpenAlex
W4401841344
Cited by
23
References
51
Citations by year
2026: 10 · 2025: 12 · 2024: 1
FWCI
3.13
Type
journal article
Language
en
Open access
Locations
  • Nature Communications (publishedVersion, cc-by)
  • bioRxiv (Cold Spring Harbor Laboratory) (acceptedVersion, cc-by)
  • Research Square (acceptedVersion, cc-by)
  • PubMed Central (publishedVersion, cc-by)
  • PubMed (publishedVersion)
  • RePEc: Research Papers in Economics (submittedVersion)
  • DOAJ (DOAJ: Directory of Open Access Journals) (submittedVersion)
Funders
Lietuvos Mokslo Taryba (S-MIP-23-104)
Topics
  • Life Sciences › Biochemistry, Genetics and Molecular Biology › Molecular Biology › Protein Structure and Dynamics
  • Life Sciences › Biochemistry, Genetics and Molecular Biology › Structural Biology › Enzyme Structure and Function
  • Life Sciences › Pharmacology, Toxicology and Pharmaceutics › Drug Discovery › Computational Drug Discovery Methods
Keywords
protein structure alignment, protein structure superposition, spatial indexing, protein structure search, parallel algorithms, protein databases, functional inference
MeSH terms
Algorithms, Models, Molecular, Protein Conformation, Proteins, Software, Sequence Alignment, Computational Biology, Databases, Protein

About these checks

Registry, retraction, Cites and statistics results are computed, not judged, with one exception: a printed reference that no index lists is read once by a model before it counts as a citation error. Claims are extracted by a model and kept only when their quote appears verbatim in the text; each cited source is then checked, with a model’s help, for whether it says what the claim relies on. Those verdicts can be wrong — read the claim’s quote and the cited source before relying on one.

Statistics and arithmetic are recomputed, not judged.

Confidence bands are shown only for fields calibrated on our annotated test set. None is calibrated yet, so no band is shown.

What counts as a claim ›How we measure confidence ›How we check this ›

Are you an author, or do you see a problem with this page? Request a review

How to cite

Cite CoChat for the checks on this page, and the paper for its own findings.

This page
CoChat. (2026). Citation check: GTalign: High-performance protein structure alignment, superposition, and search. https://app.cochat.ai/papers/10.21203/rs.3.rs-3820640/v1
The paper
Margelevicius, M. (2024). GTalign: High-performance protein structure alignment, superposition, and search. Nature Communications. https://doi.org/10.21203/rs.3.rs-3820640/v1

Data sources

Bibliographic data: Semantic Scholar, OpenAlex, Crossref.

Contains information from the Semantic Scholar Academic Graph Datasets, made available under the ODC Attribution License (ODC-BY 1.0).

Semantic Scholar’s data is described in: Kinney, R., et al. (2023). The Semantic Scholar Open Data Platform. arXiv:2301.10140.