PreprintCited by 46Plant-Microbe Interactions and ImmunityPlant Micronutrient Interactions and EffectsPlant Molecular Biology Research

The DOI matches its Crossref record; 2 of the 2 references it cites were found in a registry or an index.

The receptor kinase SRF3 coordinates iron-level and flagellin dependent defense and growth responses in plants

Open access

Preprint — published as 10.1038/s41467-022-32167-6 · Paper page

Abstract

Iron is critical for host-pathogen interactions. While pathogens seek to scavenge iron to spread, the host aims at decreasing iron availability to reduce pathogen virulence. Thus, iron sensing and homeostasis are of particular importance to prevent host infection and part of nutritional immunity. While the link between iron homeostasis and immunity pathways is well established in plants, how iron levels are sensed and integrated with immune response pathways remain unknown. We identified a receptor kinase, SRF3 coordinating root growth, iron homeostasis and immunity pathways via regulation of callose synthase activity. These processes are modulated by iron levels and rely on SRF3 extracellular and kinase domain which tune its accumulation and partitioning at the cell surface. Mimicking bacterial elicitation with the flagellin peptide flg22 phenocopies SRF3 regulation upon low iron levels and subsequent SRF3-dependent responses. We propose that SRF3 is part of nutritional immunity responses involved in sensing external iron levels.

Overview

The claims and statistics of this paper haven’t been checked yet.

Run the check — free, no account needed. It reads the open-access text and checks the sources it cites.

A few free checks a day · papers already verified open instantly · results are public

Integrity signals

Registry

Crossref · 10.21203/rs.3.rs-673556/v1

Cites

2 of 2 references verified0 citation errors · 0 not checkable

Statistics

Figures

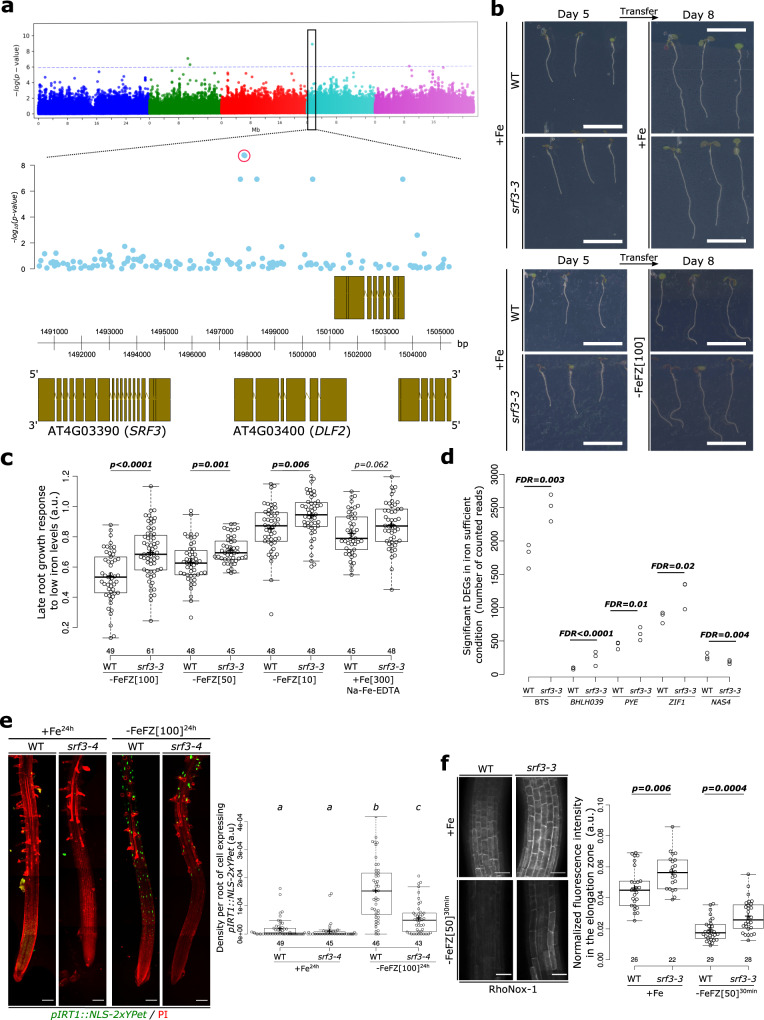
Fig. 1 SRF3 regulates root growth and iron homeostasis upon low iron conditions. a Upper panel: Manhattan plot for GWA mapping of the root growth rate day 4–5 of natural accessions grown under low iron conditions. The horizontal dash dot line corresponds to a 5% false discovery rate threshold. Black box indicates the significantly associated SNP that is in proximity to SRF3 (At4g03390). Lower panel: Magnified associations in the SRF3 region with gene models. b Representative images of 5 day old seedlings of WT and srf3-3 under iron sufficient medium for 5 days (left panel) and then transferred to iron sufficient media (+Fe; upper right panel), or to low iron medium (–FeFZ 100 μM, lower right panel) and grown for 3 days. This phenotype has been observed at least 12 times. Scale bars, 1 cm. c Boxplots of late root growth response of plants grown for 3 days on different iron levels (–FeFZ 10, 50, 100 μM or Na-Fe-EDTA 300 μM) in WT and srf3-3 seedlings [two-ways student test (p < 0.05), n.s. non-significant]. d RNAseq read counts of differentially expressed iron homeostasis genes in roots of WT and srf3-3 in iron sufficient conditions. e 5 day old seedlings stained with propidium iodide (PI; red channel) expressing pIRT1::NLS-2xYPet (green channel) in WT and srf3-4 on sufficient (+Fe) or low (–Fe) iron medium and the related quantification [one-way ANOVA follows by a post hoc Tukey HSD test, letters indicate statistical differences (p < 0.05)]. Scale bars, 100 μm. f Confocal images of 5 day old seedlings stained with RhoNox-1 in WT and srf3-3 on sufficient medium (+Fe; upper panel) or low iron medium (ferrozine 50 μM, 30 min; lower panel) and related quantification [Independent two-ways student test (p < 0.05)]. Scale bars 50 μm.
Fig. 1 SRF3 regulates root growth and iron homeostasis upon low iron conditions. a Upper panel: Manhattan plot for GWA mapping of the root growth rate day 4–5 of natural accessions grown under low iron conditions. The horizontal dash dot line corresponds to a 5% false discovery rate threshold. Black box indicates the significantly associated SNP that is in proximity to SRF3 (At4g03390). Lower panel: Magnified associations in the SRF3 region with gene models. b Representative images of 5 day old seedlings of WT and srf3-3 under iron sufficient medium for 5 days (left panel) and then transferred to iron sufficient media (+Fe; upper right panel), or to low iron medium (–FeFZ 100 μM, lower right panel) and grown for 3 days. This phenotype has been observed at least 12 times. Scale bars, 1 cm. c Boxplots of late root growth response of plants grown for 3 days on different iron levels (–FeFZ 10, 50, 100 μM or Na-Fe-EDTA 300 μM) in WT and srf3-3 seedlings [two-ways student test (p < 0.05), n.s. non-significant]. d RNAseq read counts of differentially expressed iron homeostasis genes in roots of WT and srf3-3 in iron sufficient conditions. e 5 day old seedlings stained with propidium iodide (PI; red channel) expressing pIRT1::NLS-2xYPet (green channel) in WT and srf3-4 on sufficient (+Fe) or low (–Fe) iron medium and the related quantification [one-way ANOVA follows by a post hoc Tukey HSD test, letters indicate statistical differences (p < 0.05)]. Scale bars, 100 μm. f Confocal images of 5 day old seedlings stained with RhoNox-1 in WT and srf3-3 on sufficient medium (+Fe; upper panel) or low iron medium (ferrozine 50 μM, 30 min; lower panel) and related quantification [Independent two-ways student test (p < 0.05)]. Scale bars 50 μm.CC BY · PubMed Central
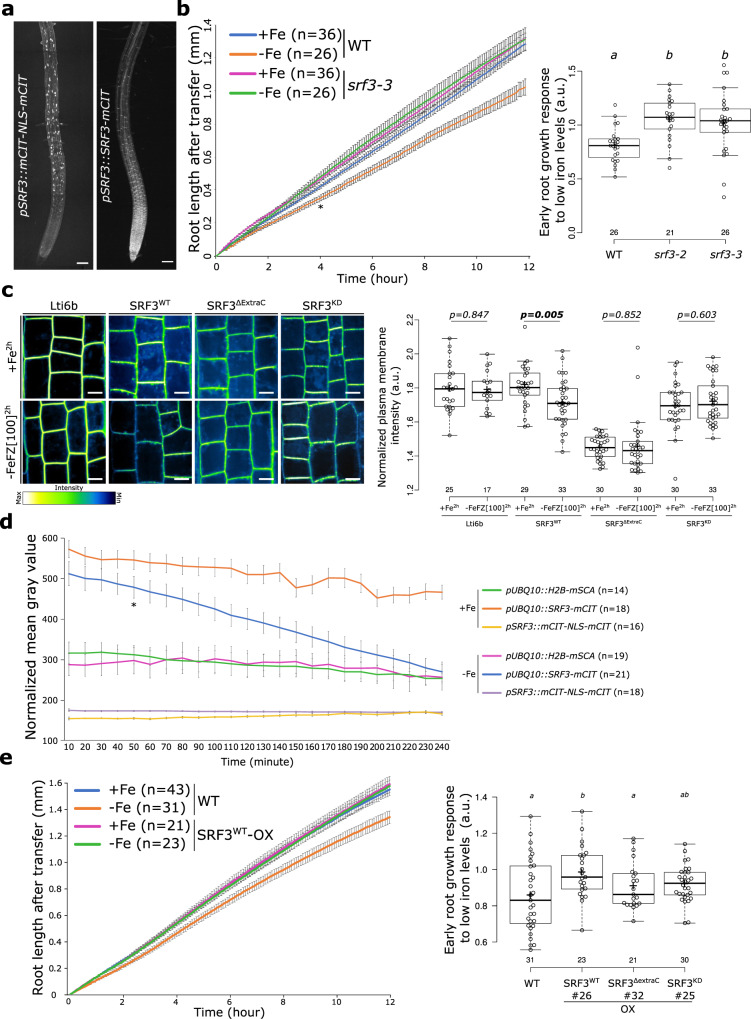
Fig. 2 SRF3 regulates early root growth response and undergoes degradation upon low iron levels. a Maximum intensity projection of confocal images of root tips of 5 day old seedlings expressing pSRF3::mCITRINE-NLS-mCITRINE and pSRF3::SRF3-mCITRINE in Col-0. This pattern has been observed at least hundreds of times. Scale bars, 100 μm. b Graph showing time-lapse analysis for 12 h of the root length of WT and srf3-3 under sufficient (+Fe) and low (–Fe) iron media [error bars indicate standard error of the mean (SEM); Asterix: first timepoint with significant difference between WT in +Fe and –Fe conditions according to a mixed effect model (p < 0.05)] and the related quantification including the srf3-2 mutant [ANOVA with post hoc Tukey test; Letters: statistical differences (p < 0.05)]. c Confocal images of root epidermal cells in the elongation zone of 5 day old seedlings expressing p35s::eGFP-Lti6b/col-0, pUBQ10::SRF3WT-mCITRINE/col-0, pUBQ10::SRF3ΔExtraC-mCITRINE/col-0, pUBQ10::SRF3KD-mCITRINE/col-0 under iron sufficient (+Fe, 2 h) and low iron levels (–FeFZ 100 μM, 2 h) and the related quantification [two-ways student test (p < 0.05), n.s.: non-significant]. Scale bars 10 μm. Note that the pictures have been pseudo-colored in green fire blue to emphasize changes in fluorescence intensity. d Graph representing the fluorescence intensity in the root tip of the indicated protein fusions under sufficient (+Fe) and low (–Fe) iron media [error bars indicate SEM; Asterix: first timepoint with significant difference between +Fe and –Fe for pUBQ10::SRF3-mCITRINE according to a mixed effect model (p < 0.05)]. e Graph showing time-lapse analysis for 12 h of the root length of WT and SRF3WT-OX under sufficient (+Fe) and low (–Fe) iron media [error bars indicate SEM] and related quantification including SRF3ΔExtraC and SRF3KD [ANOVA with post hoc Fisher test; Letters: statistical differences (p < 0.05)].
Fig. 2 SRF3 regulates early root growth response and undergoes degradation upon low iron levels. a Maximum intensity projection of confocal images of root tips of 5 day old seedlings expressing pSRF3::mCITRINE-NLS-mCITRINE and pSRF3::SRF3-mCITRINE in Col-0. This pattern has been observed at least hundreds of times. Scale bars, 100 μm. b Graph showing time-lapse analysis for 12 h of the root length of WT and srf3-3 under sufficient (+Fe) and low (–Fe) iron media [error bars indicate standard error of the mean (SEM); Asterix: first timepoint with significant difference between WT in +Fe and –Fe conditions according to a mixed effect model (p < 0.05)] and the related quantification including the srf3-2 mutant [ANOVA with post hoc Tukey test; Letters: statistical differences (p < 0.05)]. c Confocal images of root epidermal cells in the elongation zone of 5 day old seedlings expressing p35s::eGFP-Lti6b/col-0, pUBQ10::SRF3WT-mCITRINE/col-0, pUBQ10::SRF3ΔExtraC-mCITRINE/col-0, pUBQ10::SRF3KD-mCITRINE/col-0 under iron sufficient (+Fe, 2 h) and low iron levels (–FeFZ 100 μM, 2 h) and the related quantification [two-ways student test (p < 0.05), n.s.: non-significant]. Scale bars 10 μm. Note that the pictures have been pseudo-colored in green fire blue to emphasize changes in fluorescence intensity. d Graph representing the fluorescence intensity in the root tip of the indicated protein fusions under sufficient (+Fe) and low (–Fe) iron media [error bars indicate SEM; Asterix: first timepoint with significant difference between +Fe and –Fe for pUBQ10::SRF3-mCITRINE according to a mixed effect model (p < 0.05)]. e Graph showing time-lapse analysis for 12 h of the root length of WT and SRF3WT-OX under sufficient (+Fe) and low (–Fe) iron media [error bars indicate SEM] and related quantification including SRF3ΔExtraC and SRF3KD [ANOVA with post hoc Fisher test; Letters: statistical differences (p < 0.05)].CC BY · PubMed Central
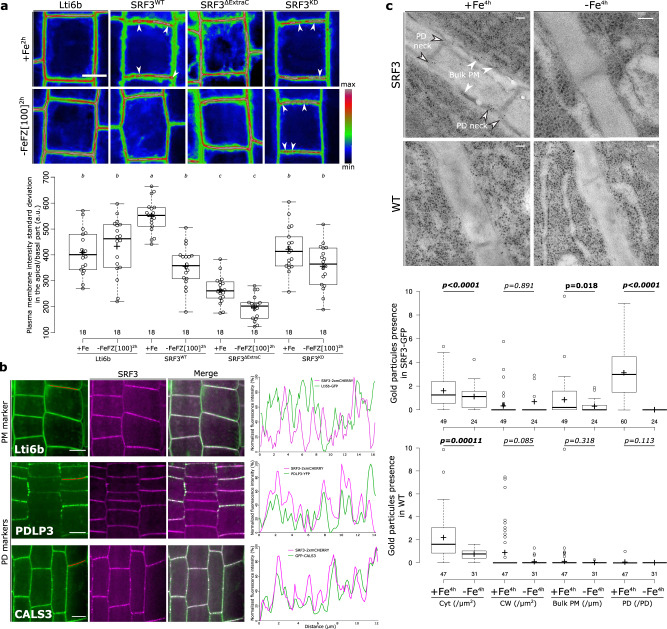
Fig. 3 SRF3 co-exists in two sub-populations at the plasma membrane, which decrease under low iron levels. a Confocal images of root epidermal cells of 5 day old seedlings expressing p35s::eGFP-Lti6b, pUBQ10::SRF3-mCITRINE, pUBQ10::SRF3WT-mCITRINE, pUBQ10::SRF3ΔExtraC-mCITRINE, pUBQ10::SRF3KD-mCITRINE under iron sufficient (+Fe, 2 h) or low iron (–FeFZ 100 μM, 2 h) conditions and the related quantification [ANOVA with post hoc Tukey test; Letters: statistical differences (p < 0.05)]. Note that the pictures have been pseudo-colored in rainbow RGB and intensities are optimized to emphasize changes in plasma membrane polarity and localization in the punctuated foci. Arrows indicate punctuated structures. Scale bars, 10 μm. b Confocal images of root epidermal cells in the transition-elongation of 5 day old seedlings co-expressing, p35s::eGFP-Lti6b, pPDLP3-PDLP3-YFP, 35s::CALS3-GFP, left, with pUBQ10::SRF3-2xmCHERRY, middle and the relative merge of the two pictures. Red line on the left image indicates where the scan line has been traced. Right panel: graphs showing the signal intensity in both channel on the apical-basal part of the cell along the scan line. This co-localization has been observed on three independent experiments on at least 4 roots. Scale bars, 10 μm. c Electron micrograph of gold particle detected with anti-GFP antibody in plants expressing pSRF3::SRF3-GFP (SRF3) and the related control in Ler-0 background under sufficient (+Fe, 4 h) and low (–Fe, 4 h) iron media and the related quantification [two-ways Mann-Whitney test coupled with Montecarlo correction (p = 0.05)]. Cyt, cytosol; CW, cell wall; PM plasma membrane; PD plasmodesmata. Scale bars, 50 nm.
Fig. 3 SRF3 co-exists in two sub-populations at the plasma membrane, which decrease under low iron levels. a Confocal images of root epidermal cells of 5 day old seedlings expressing p35s::eGFP-Lti6b, pUBQ10::SRF3-mCITRINE, pUBQ10::SRF3WT-mCITRINE, pUBQ10::SRF3ΔExtraC-mCITRINE, pUBQ10::SRF3KD-mCITRINE under iron sufficient (+Fe, 2 h) or low iron (–FeFZ 100 μM, 2 h) conditions and the related quantification [ANOVA with post hoc Tukey test; Letters: statistical differences (p < 0.05)]. Note that the pictures have been pseudo-colored in rainbow RGB and intensities are optimized to emphasize changes in plasma membrane polarity and localization in the punctuated foci. Arrows indicate punctuated structures. Scale bars, 10 μm. b Confocal images of root epidermal cells in the transition-elongation of 5 day old seedlings co-expressing, p35s::eGFP-Lti6b, pPDLP3-PDLP3-YFP, 35s::CALS3-GFP, left, with pUBQ10::SRF3-2xmCHERRY, middle and the relative merge of the two pictures. Red line on the left image indicates where the scan line has been traced. Right panel: graphs showing the signal intensity in both channel on the apical-basal part of the cell along the scan line. This co-localization has been observed on three independent experiments on at least 4 roots. Scale bars, 10 μm. c Electron micrograph of gold particle detected with anti-GFP antibody in plants expressing pSRF3::SRF3-GFP (SRF3) and the related control in Ler-0 background under sufficient (+Fe, 4 h) and low (–Fe, 4 h) iron media and the related quantification [two-ways Mann-Whitney test coupled with Montecarlo correction (p = 0.05)]. Cyt, cytosol; CW, cell wall; PM plasma membrane; PD plasmodesmata. Scale bars, 50 nm.CC BY · PubMed Central
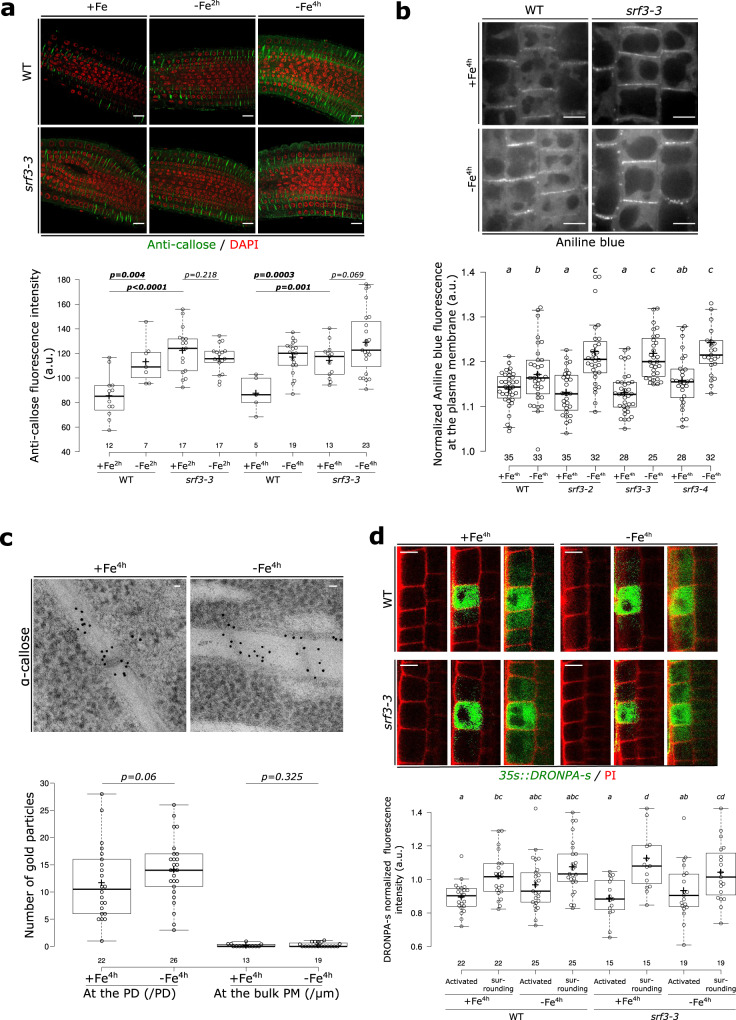
Fig. 4 SRF3 is a negative regulator of callose deposition but does not regulate cell-to-cell movement of proteins. a Confocal images of root meristems of 5 day old seedlings stained with callose antibody (green) and DAPI to stain the nucleus (red) under sufficient (+Fe, 2 h and 4 h) and low (–Fe, 2 h and 4 h) iron media and the related quantification [two-ways student test (p < 0.05), n.s.: non-significant]. Scale bars, 10 μm. b Confocal images of root epidermal cells in the elongation zone of 5 day old seedling stained with aniline blue under sufficient (+Fe, 4 h) and low (–Fe, 4 h) iron media in WT and srf3-3 and the related quantification [ANOVA with post hoc Fisher test; Letters: statistical differences (p < 0.05)]. Scale bars, 10 μm. c Electron micrograph of gold particle detected with anti-callose antibody in plants expressing pSRF3::SRF3-GFP (SRF3) grown on sufficient (+Fe, 4 h) and low (–Fe, 4 h) iron media and the related quantification [one-way student test (p < 0.1), n.s.: non-significant]. PD, plasmodesmata; PM, Plasma membrane. Scale bars, 50 nm. d Confocal images of root epidermal cells in the transition-elongation zone of 5 day old seedlings expressing p35s::DRONPA-s in WT and srf3-3 under sufficient (+Fe) and low (–Fe) iron media and the related quantification [ANOVA with post hoc Fisher test; Letters: statistical differences (p < 0.05)]. Scale bars, 10 μm.
Fig. 4 SRF3 is a negative regulator of callose deposition but does not regulate cell-to-cell movement of proteins. a Confocal images of root meristems of 5 day old seedlings stained with callose antibody (green) and DAPI to stain the nucleus (red) under sufficient (+Fe, 2 h and 4 h) and low (–Fe, 2 h and 4 h) iron media and the related quantification [two-ways student test (p < 0.05), n.s.: non-significant]. Scale bars, 10 μm. b Confocal images of root epidermal cells in the elongation zone of 5 day old seedling stained with aniline blue under sufficient (+Fe, 4 h) and low (–Fe, 4 h) iron media in WT and srf3-3 and the related quantification [ANOVA with post hoc Fisher test; Letters: statistical differences (p < 0.05)]. Scale bars, 10 μm. c Electron micrograph of gold particle detected with anti-callose antibody in plants expressing pSRF3::SRF3-GFP (SRF3) grown on sufficient (+Fe, 4 h) and low (–Fe, 4 h) iron media and the related quantification [one-way student test (p < 0.1), n.s.: non-significant]. PD, plasmodesmata; PM, Plasma membrane. Scale bars, 50 nm. d Confocal images of root epidermal cells in the transition-elongation zone of 5 day old seedlings expressing p35s::DRONPA-s in WT and srf3-3 under sufficient (+Fe) and low (–Fe) iron media and the related quantification [ANOVA with post hoc Fisher test; Letters: statistical differences (p < 0.05)]. Scale bars, 10 μm.CC BY · PubMed Central
Fig. 5 Regulation of IRT1 and root growth by SRF3-dependent callose synthase activity under low iron levels. a Graph representing the quantification of pIRT1::NLS-2xYPet time-lapse analysis under mock (+Fe) and low iron levels (–Fe) [error bars indicate Standard error of the mean (SEM)]. b Graph representing the percentage of root showing IRT1 promotor activation under sufficient (+Fe, 16 h) and low (–Fe, 16 h) iron media in WT and srf3-4 in presence or absence of DDG. [ANOVA with post hoc Tukey test; Letters: statistical differences (p < 0.05)]. c Micrographs of 5 day old seedlings taken in the root elongation zone of plants expressing 35s::GFP-CALS3 (upper) and UBQ10::SRF3-2xmCHERRY (middle) and merge channel (lower) acquired by TIRF microscopy. This pattern has been observed on at least 15 roots throughout 2 independent experiments. Scale bars, 5 μm. d Picture of 9 day old seedlings of WT, cals3-3d, pUBQ10::SRF3-mCITRINE (SRF3-OX) and cals3-3d/SRF3-OX and the related quantification [two-ways student test (p < 0.05), n.s. non-significant]. Scale bar, 1 cm. e, f Boxplots of late root growth response of plants grown for 3 days in low iron levels. [ANOVA with post hoc Fisher (e) and Tukey tests (f); Letters: statistical differences (p < 0.05). g Graph showing time-lapse of the root length for 12 h of srf3-3 under low iron (–Fe) media in presence or absence of DDG and the related quantification including the srf3-2 mutant [ANOVA with post hoc Tukey test; Letters: statistical differences (p < 0.05); Error bars indicate SEM].
Fig. 5 Regulation of IRT1 and root growth by SRF3-dependent callose synthase activity under low iron levels. a Graph representing the quantification of pIRT1::NLS-2xYPet time-lapse analysis under mock (+Fe) and low iron levels (–Fe) [error bars indicate Standard error of the mean (SEM)]. b Graph representing the percentage of root showing IRT1 promotor activation under sufficient (+Fe, 16 h) and low (–Fe, 16 h) iron media in WT and srf3-4 in presence or absence of DDG. [ANOVA with post hoc Tukey test; Letters: statistical differences (p < 0.05)]. c Micrographs of 5 day old seedlings taken in the root elongation zone of plants expressing 35s::GFP-CALS3 (upper) and UBQ10::SRF3-2xmCHERRY (middle) and merge channel (lower) acquired by TIRF microscopy. This pattern has been observed on at least 15 roots throughout 2 independent experiments. Scale bars, 5 μm. d Picture of 9 day old seedlings of WT, cals3-3d, pUBQ10::SRF3-mCITRINE (SRF3-OX) and cals3-3d/SRF3-OX and the related quantification [two-ways student test (p < 0.05), n.s. non-significant]. Scale bar, 1 cm. e, f Boxplots of late root growth response of plants grown for 3 days in low iron levels. [ANOVA with post hoc Fisher (e) and Tukey tests (f); Letters: statistical differences (p < 0.05). g Graph showing time-lapse of the root length for 12 h of srf3-3 under low iron (–Fe) media in presence or absence of DDG and the related quantification including the srf3-2 mutant [ANOVA with post hoc Tukey test; Letters: statistical differences (p < 0.05); Error bars indicate SEM].CC BY · PubMed Central
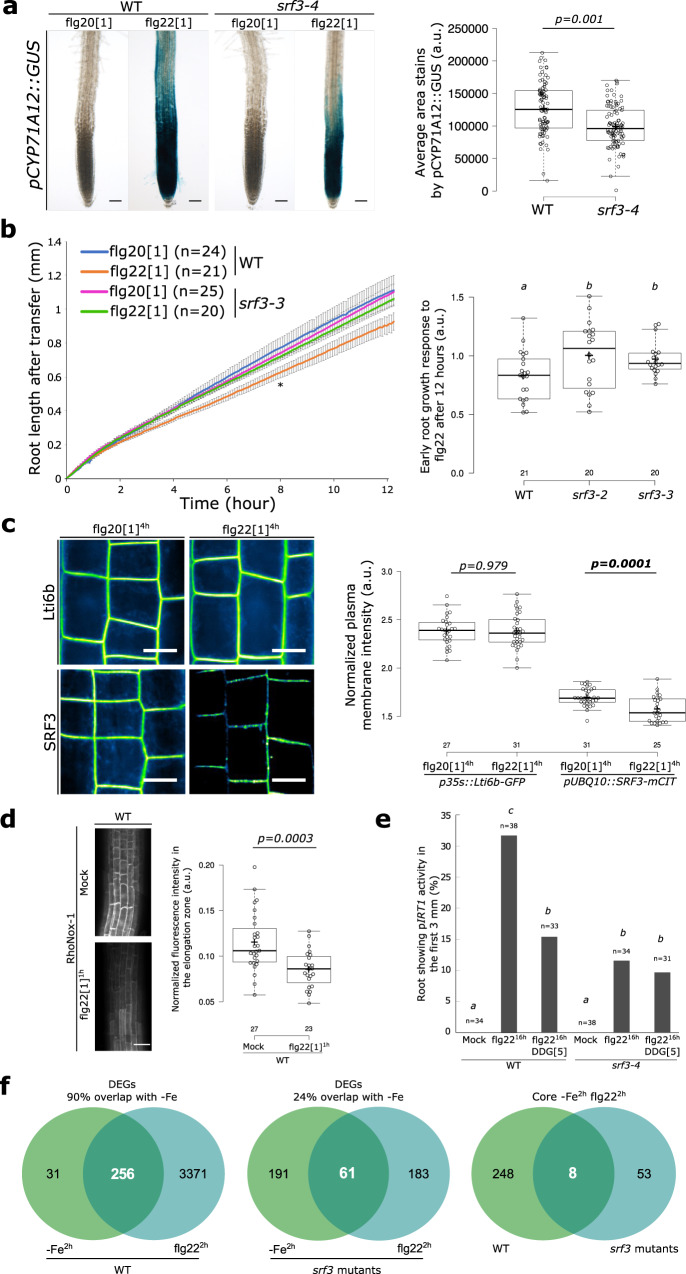
Fig. 6 Coordination of bacterial immunity and iron homeostasis signaling pathways by SRF3. a Representative pictures of roots expressing pCYP71A12::GUS in WT and srf3-4 under flg20 and flg22 treatment (1 μM, 24 h) and the related quantification [two-ways student test (p < 0.05)]. Scale bars, 50μm. b Graph showing time-lapse analysis of root length of WT and srf3-3 upon flg20 and flg22 treatments (1 μM) [error bars indicates standard error of the mean (SEM); Asterix: first timepoint with significant difference between +Fe and –Fe for the WT according to a mixed effect model (p < 0.05)] and the related quantification including the srf3-2 mutant [ANOVA with post hoc Tukey test; Letters: statistical differences (p < 0.05)]. c Confocal images of root epidermal cells of 5-day-old seedling expressing p35S::eGFP-Lti6b and pUBQ10::SRF3-mCITRINE in flg20 and flg22 (1 μM, 4 h) and the related quantification [two-ways student test (p < 0.05); n.s.: non-significant]. Scale bars, 10 μm. d Confocal images of root epidermal cells of 5 day old seedlings stained with RhoNox-1 in WT in mock or flg22 (1 μM, 1 h) and the related quantification in the elongation zone [two-ways student test (p < 0.05)]. Scale bars, 50 μm. e Graph representing the percentage of root showing IRT1 promotor activation under mock and flg22 (1 μM, 16 h) treatment in WT and srf3-4 in presence or absence of DDG. [ANOVA with post hoc Tukey test; Letters: statistical differences (p < 0.05)]. f Venn diagram of differentially expressed genes under low iron levels (–Fe, 2 h) and flg22 (1 μM, 2 h) in WT (left) in srf3 (middle) and DEGs in both condition between WT and srf3.
Fig. 6 Coordination of bacterial immunity and iron homeostasis signaling pathways by SRF3. a Representative pictures of roots expressing pCYP71A12::GUS in WT and srf3-4 under flg20 and flg22 treatment (1 μM, 24 h) and the related quantification [two-ways student test (p < 0.05)]. Scale bars, 50μm. b Graph showing time-lapse analysis of root length of WT and srf3-3 upon flg20 and flg22 treatments (1 μM) [error bars indicates standard error of the mean (SEM); Asterix: first timepoint with significant difference between +Fe and –Fe for the WT according to a mixed effect model (p < 0.05)] and the related quantification including the srf3-2 mutant [ANOVA with post hoc Tukey test; Letters: statistical differences (p < 0.05)]. c Confocal images of root epidermal cells of 5-day-old seedling expressing p35S::eGFP-Lti6b and pUBQ10::SRF3-mCITRINE in flg20 and flg22 (1 μM, 4 h) and the related quantification [two-ways student test (p < 0.05); n.s.: non-significant]. Scale bars, 10 μm. d Confocal images of root epidermal cells of 5 day old seedlings stained with RhoNox-1 in WT in mock or flg22 (1 μM, 1 h) and the related quantification in the elongation zone [two-ways student test (p < 0.05)]. Scale bars, 50 μm. e Graph representing the percentage of root showing IRT1 promotor activation under mock and flg22 (1 μM, 16 h) treatment in WT and srf3-4 in presence or absence of DDG. [ANOVA with post hoc Tukey test; Letters: statistical differences (p < 0.05)]. f Venn diagram of differentially expressed genes under low iron levels (–Fe, 2 h) and flg22 (1 μM, 2 h) in WT (left) in srf3 (middle) and DEGs in both condition between WT and srf3.CC BY · PubMed Central

Verification

Claims the paper makes

The claims and statistics of this paper haven’t been checked yet.

Run the check — free, no account needed. It reads the open-access text and checks the sources it cites.

A few free checks a day · papers already verified open instantly · results are public

Self-check

Percentages, sums and reported differences re-computed from the paper’s own numbers.

The self-check needs the paper’s full text.

Citations

Cites

Metadata

Authors
Platre, M., Satbhai, S., Brent, L., Gleason, M., Grison, M., Glavier, M., Zhang, L., Cao, M., Gaillochet, C., Göschl, C., Giovannetti, M., Enugutti, B., von Reth, M., Alcázar, R., Parker, J., Vert, G., Bayer, E., & Busch, W.
Affiliations
  • Salk Institute for Biological Studies (US)
  • Centre National de la Recherche Scientifique (FR)
  • Gregor Mendel Institute of Molecular Plant Biology (AT)
  • Max Planck Institute for Plant Breeding Research (DE)
  • Cluster of Excellence on Plant Sciences (DE)
  • Plant Science Research Laboratory (LRSV), UMR5546 CNRS/Université Toulouse 3
Corresponding author
Busch, Wolfgang
Venue
Nature Communications
Published
2021-07-12
Volume
13
Issue
1
Pages
4445-4445
ISSN
2041-1723 (ISSN-L)
OpenAlex
W4289313504
Cited by
46
References
2
Citations by year
2026: 10 · 2025: 13 · 2024: 13 · 2023: 7 · 2022: 3
FWCI
4.96
Type
journal article
Language
en
Open access
Locations
  • Nature Communications (publishedVersion, cc-by)
  • bioRxiv (Cold Spring Harbor Laboratory) (acceptedVersion)
  • Research Square (acceptedVersion, cc-by)
  • PubMed Central (publishedVersion, cc-by)
  • PubMed (publishedVersion)
  • Institutional Research Information System University of Turin (University of Turin) (submittedVersion, other-oa)
  • HAL (submittedVersion, cc-by)
  • RePEc: Research Papers in Economics (submittedVersion)
  • DOAJ (DOAJ: Directory of Open Access Journals) (submittedVersion, cc-by-sa)
  • Oskar-Bordeaux (Universite de Bordeaux) (submittedVersion, cc-by)
  • Padua Research Archive (University of Padova) (submittedVersion, cc-by)
Funders
  • European Commission (772103, HORIZON2020)
  • Österreichischen Akademie der Wissenschaften
  • Austrian Science Fund (I 2377)
  • International Max Planck Research School for Advanced Methods in Process and Systems Engineering
  • National Institutes of Health (390686111)
  • National Institute of General Medical Sciences (R01GM127759)
Topics
  • Life Sciences › Agricultural and Biological Sciences › Plant Science › Plant-Microbe Interactions and Immunity
  • Life Sciences › Agricultural and Biological Sciences › Plant Science › Plant Micronutrient Interactions and Effects
  • Life Sciences › Agricultural and Biological Sciences › Plant Science › Plant Molecular Biology Research
Keywords
iron homeostasis, nutritional immunity, flagellin, flg22, callose synthase, plant immunity, root growth, iron sensing, kinase domain, extracellular domain, host-pathogen interaction
MeSH terms
Flagellin, Iron, Protein Kinases, Arabidopsis, Arabidopsis Proteins

About these checks

Registry, retraction, Cites and statistics results are computed, not judged, with one exception: a printed reference that no index lists is read once by a model before it counts as a citation error. Claims are extracted by a model and kept only when their quote appears verbatim in the text; each cited source is then checked, with a model’s help, for whether it says what the claim relies on. Those verdicts can be wrong — read the claim’s quote and the cited source before relying on one.

Statistics and arithmetic are recomputed, not judged.

Confidence bands are shown only for fields calibrated on our annotated test set. None is calibrated yet, so no band is shown.

What counts as a claim ›How we measure confidence ›How we check this ›

Are you an author, or do you see a problem with this page? Request a review