PreprintCited by 11Bacterial biofilms and quorum sensingBacterial Genetics and BiotechnologyVibrio bacteria research studies

The DOI matches its Crossref record; 1 of the 1 references it cites were found in a registry or an index.

Quorum Sensing and Iron-Dependent Coordinated Control of Autoinducer-2 Production via Small RNA RyhB in Vibrio vulnificus

Open access

Preprint — published as 10.1038/s41598-021-04757-9

Abstract

Roles for the non-coding small RNA RyhB in quorum-sensing and iron-dependent gene modulation in the human pathogen V. vulnificus were assessed in this study. Both the quorum sensing master regulator SmcR and the Fur-iron complex were observed to bind to the region upstream of the non-coding small RNA RyhB gene to repress expression, which suggests that RyhB is associated with both quorum-sensing and iron-dependent signaling in this pathogen. We found that expression of LuxS, which is responsible for the biosynthesis of autoinducer-2 (AI-2), was higher in wild type than in a ryhB-deletion isotype. RyhB binds directly to the 5'-UTR of the luxS transcript to form a heteroduplex, which not only stabilizes LuxS mRNA but also disrupts the secondary structure that normally obscures the translational start codon and thereby allows translation of LuxS to begin. The binding of RyhB to LuxS mRNA requires the chaperone protein Hfq, which stabilizes RyhB. These results demonstrate that the small RNA RyhB is a key element associated with feedback control of AI-2 production, and that it inhibits quorum-sensing signaling in an iron-dependent manner. This study, taken together with previous studies, shows that iron availability and cell density signals are funneled to SmcR and RyhB, and that these regulators coordinate cognate signal pathways that result in the proper balance of protein expression in response to environmental conditions.

Overview

The claims and statistics of this paper haven’t been checked yet.

Run the check — free, no account needed. It reads the open-access text and checks the sources it cites.

A few free checks a day · papers already verified open instantly · results are public

Integrity signals

Registry

Crossref · 10.21203/rs.3.rs-936419/v1

Cites

1 of 1 references verified0 citation errors · 0 not checkable

Statistics

Figures

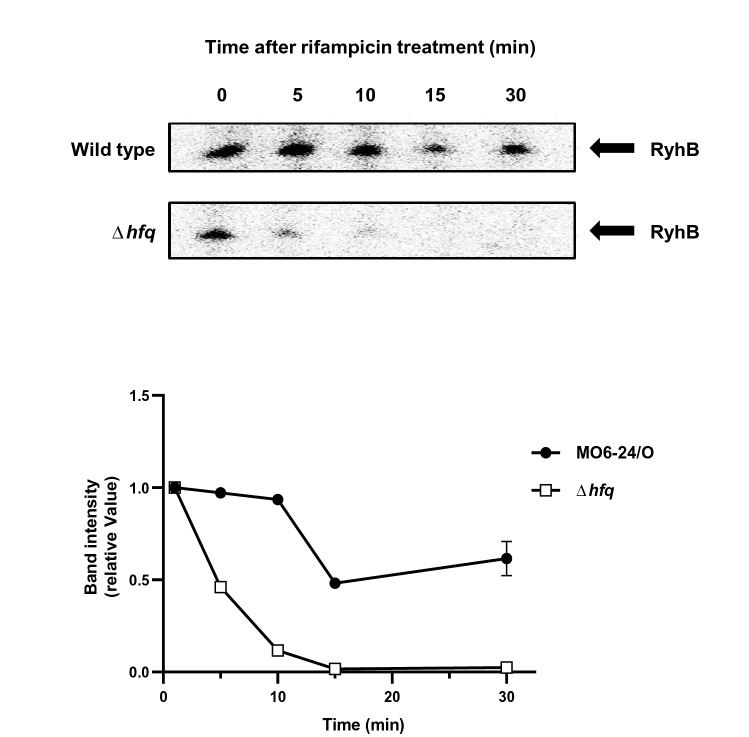
Figure 1 Hfq stabilizes the transcript of ryhB. V. vulnificus MO6 and hfq mutant (Δhfq) were cultured in LB broth for 3 h, at which point 200 μM of 2, 2′-dipyridyl was added and incubation continued for another hour. Samples were then treated with 250 g/ml of rifampicin and collected at time intervals for RNA quantification. Intensities of bands were quantitatively measured using a densitometer and the results are shown as a graph in the lower panel.
Figure 1 Hfq stabilizes the transcript of ryhB. V. vulnificus MO6 and hfq mutant (Δhfq) were cultured in LB broth for 3 h, at which point 200 μM of 2, 2′-dipyridyl was added and incubation continued for another hour. Samples were then treated with 250 g/ml of rifampicin and collected at time intervals for RNA quantification. Intensities of bands were quantitatively measured using a densitometer and the results are shown as a graph in the lower panel.CC BY · PubMed Central
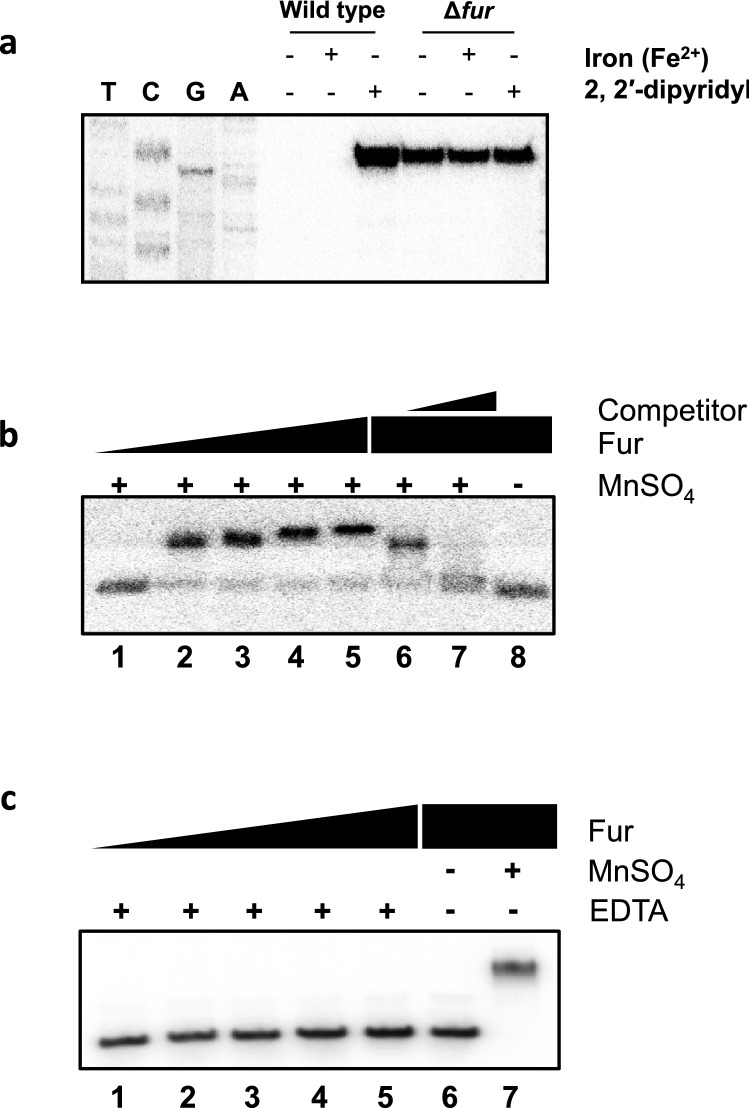
Figure 2 Expression of RyhB is dependent on Fur and iron concentrations. (a) Primer extensions were carried out to assess the level of RyhB expression with and without Fur and iron. Wild type MO6 and a fur mutant were cultured in LB supplemented with either 25 μM of FeSO4 or 200 μM 2, 2′-dipyridyl. After RNA extraction, the RyhB transcript was quantified by primer extension using primer RyhB-PE (Supplementary Table S2). Sequencing ladders generated by the same primer are included. (b) Gel shift assay of a 32P-labeled DNA fragment of the region upstream of ryhB with increasing amounts of Fur in the presence of the divalent cation MnSO4. Lanes 1 through 5 are Fur concentrations of 0, 100, 200, 400, and 600 nM, respectively. Lanes 6 and 7 include 600 nM of Fur incubated with probe in the presence of either 260 ng or 720 ng of non-labeled probe, respectively. (c) Gel shift assay of 32P-labeled ryhB probe with increasing amounts of Fur in the presence of 10 mM EDTA. Lanes 1 through 5 are Fur concentration of 0, 100, 200, 400, and 600 nM, respectively. Lane 6 includes 600 nM of Fur without EDTA, and lane 7 includes 600 nM of Fur and MnSO4. In figs. 2b and c, the upper bands are to be labeled with ‘Fur-probe complex’ and the lower bands with ‘Free probe’ just like in Fig. 4a.
Figure 2 Expression of RyhB is dependent on Fur and iron concentrations. (a) Primer extensions were carried out to assess the level of RyhB expression with and without Fur and iron. Wild type MO6 and a fur mutant were cultured in LB supplemented with either 25 μM of FeSO4 or 200 μM 2, 2′-dipyridyl. After RNA extraction, the RyhB transcript was quantified by primer extension using primer RyhB-PE (Supplementary Table S2). Sequencing ladders generated by the same primer are included. (b) Gel shift assay of a 32P-labeled DNA fragment of the region upstream of ryhB with increasing amounts of Fur in the presence of the divalent cation MnSO4. Lanes 1 through 5 are Fur concentrations of 0, 100, 200, 400, and 600 nM, respectively. Lanes 6 and 7 include 600 nM of Fur incubated with probe in the presence of either 260 ng or 720 ng of non-labeled probe, respectively. (c) Gel shift assay of 32P-labeled ryhB probe with increasing amounts of Fur in the presence of 10 mM EDTA. Lanes 1 through 5 are Fur concentration of 0, 100, 200, 400, and 600 nM, respectively. Lane 6 includes 600 nM of Fur without EDTA, and lane 7 includes 600 nM of Fur and MnSO4. In figs. 2b and c, the upper bands are to be labeled with ‘Fur-probe complex’ and the lower bands with ‘Free probe’ just like in Fig. 4a.CC BY · PubMed Central
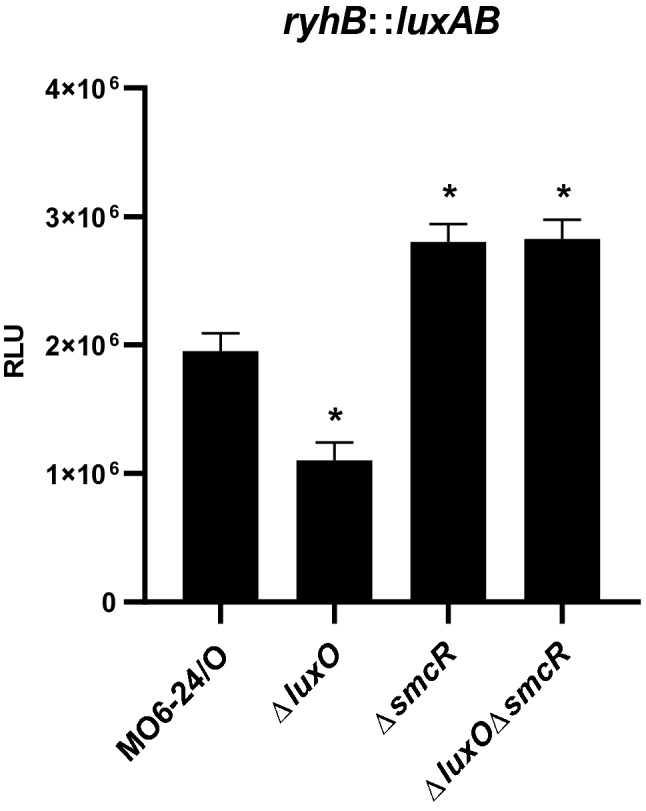
Figure 3 The quorum sensing master regulator SmcR represses the expression of ryhB. Quantitative analysis of ryhB transcription levels using luxAB as reporter genes. Luminescence activity representing the level of ryhB transcription was compared at early stationary phase of growth (A600 ≅ 1.0) for V. vulnificus MO6-24/O, ΔluxO, ΔsmcR, and ΔluxOΔsmcR harboring pHK-ryhB. Relative light units (RLU) were normalized to cell density (luminescence/A600). Values are averages from three independent experiments, and error bars denote standard deviations. The p-values for comparison with MO6-24/O are indicated (Student’s t-test; *, 0.005 ≤ P < 0.05).
Figure 3 The quorum sensing master regulator SmcR represses the expression of ryhB. Quantitative analysis of ryhB transcription levels using luxAB as reporter genes. Luminescence activity representing the level of ryhB transcription was compared at early stationary phase of growth (A600 ≅ 1.0) for V. vulnificus MO6-24/O, ΔluxO, ΔsmcR, and ΔluxOΔsmcR harboring pHK-ryhB. Relative light units (RLU) were normalized to cell density (luminescence/A600). Values are averages from three independent experiments, and error bars denote standard deviations. The p-values for comparison with MO6-24/O are indicated (Student’s t-test; *, 0.005 ≤ P < 0.05).CC BY · PubMed Central
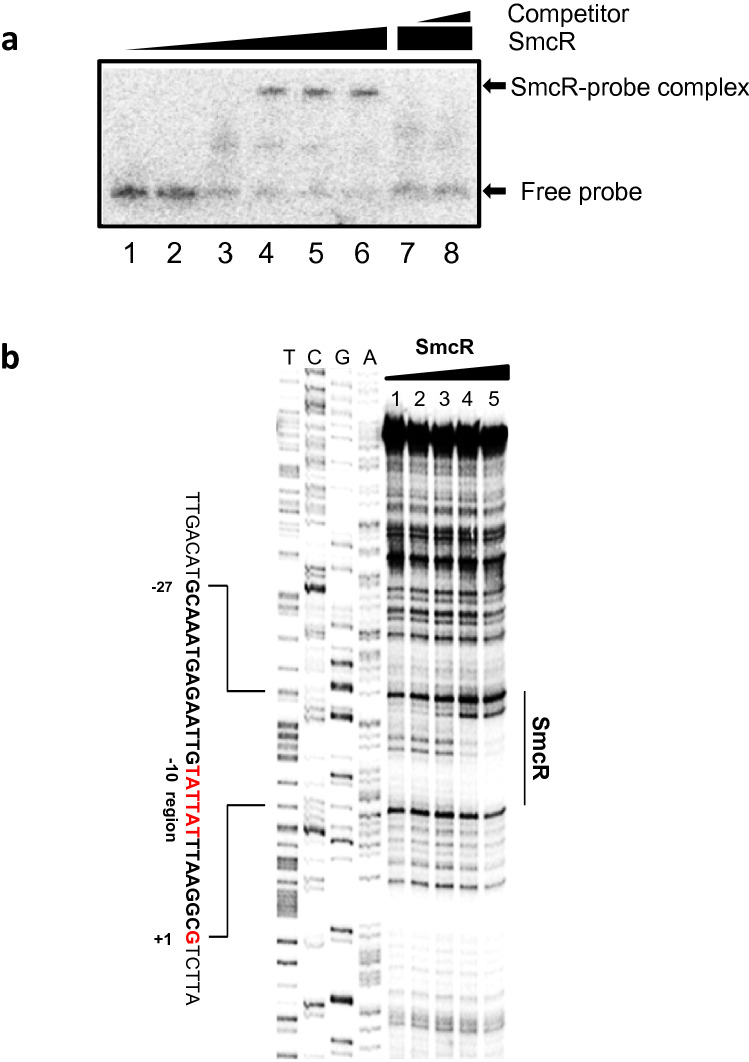
Figure 4 SmcR binds directly to the upstream region of ryhB. (a) Gel mobility shift assay of purified SmcR binding to a DNA fragment of the upstream region of ryhB. Lanes 1 to 6 represent 20 ng of 32P-labeled ryhB probe incubated with 0, 50, 100, 150, 200, and 300 nM of SmcR, respectively. Lanes 5 and 6 represent 20 ng of the labeled ryhB probe incubated with 250 nM of SmcR with the addition of either 260 ng or 780 ng of unlabeled probe as a competitor, respectively. (b) DNase I footprinting to identify the SmcR binding site in the region upstream of ryhB. 32P-labeled ryhB probe (100 ng) with SmcR at 0, 62.5, 125, 250, 500 and 1000 nM is included in lanes 1 to 5, respectively. Sequencing ladders were included for comparison.
Figure 4 SmcR binds directly to the upstream region of ryhB. (a) Gel mobility shift assay of purified SmcR binding to a DNA fragment of the upstream region of ryhB. Lanes 1 to 6 represent 20 ng of 32P-labeled ryhB probe incubated with 0, 50, 100, 150, 200, and 300 nM of SmcR, respectively. Lanes 5 and 6 represent 20 ng of the labeled ryhB probe incubated with 250 nM of SmcR with the addition of either 260 ng or 780 ng of unlabeled probe as a competitor, respectively. (b) DNase I footprinting to identify the SmcR binding site in the region upstream of ryhB. 32P-labeled ryhB probe (100 ng) with SmcR at 0, 62.5, 125, 250, 500 and 1000 nM is included in lanes 1 to 5, respectively. Sequencing ladders were included for comparison.CC BY · PubMed Central
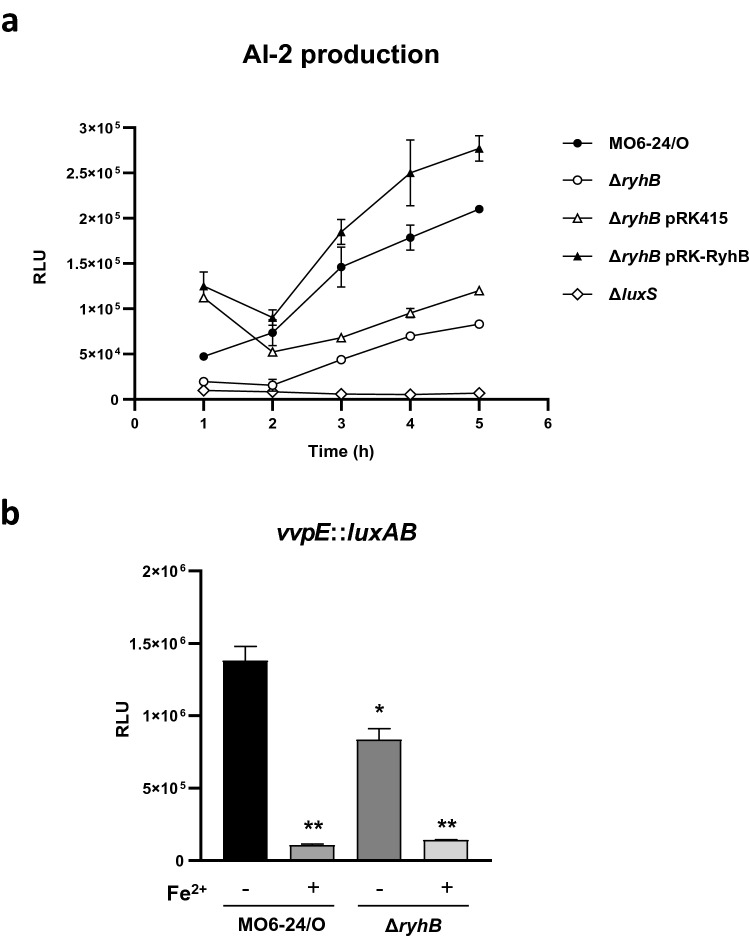
Figure 5 RyhB promotes AI-2 production and vvpE expression. (a) Effects of RyhB on AI-2 production were measured using the AI-2 indicator V. harveyi strain BB170. V. vulnificus strains wild type MO6-24/O, ΔryhB, ΔryhB with a ryhB clone (ΔryhB pBBR12-ryhB), Δhfq, Δhfq with a hfq clone (Δhfq pBBR12-hfq), and ΔluxS were cultured in AB minimal medium and supernatants were collected to measure AI-2 production. (b) Effects of RyhB on the expression of vvpE. vvpE expression was measured using a transcriptional fusion (pHK-vvpE) in either V. vulnificus wild type or the ΔryhB mutant. V. vulnificus was cultured in LBS medium supplemented with 100 μM of 2, 2′-dipyridyl to A600 of about 0.1. Samples were collected at late stationary phase (A600 ≅ 2.5) and both cell density and luminescence were measured. Relative light units (RLU) were normalized to cell density (luminescence/A600). Values are an average of three independent experiments and error bars denote the standard deviations. The p-values for comparison with MO6-24/O (without iron) are indicated (Student’s t-test; *, 0.005 ≤ P < 0.05; **, P < 0.005).
Figure 5 RyhB promotes AI-2 production and vvpE expression. (a) Effects of RyhB on AI-2 production were measured using the AI-2 indicator V. harveyi strain BB170. V. vulnificus strains wild type MO6-24/O, ΔryhB, ΔryhB with a ryhB clone (ΔryhB pBBR12-ryhB), Δhfq, Δhfq with a hfq clone (Δhfq pBBR12-hfq), and ΔluxS were cultured in AB minimal medium and supernatants were collected to measure AI-2 production. (b) Effects of RyhB on the expression of vvpE. vvpE expression was measured using a transcriptional fusion (pHK-vvpE) in either V. vulnificus wild type or the ΔryhB mutant. V. vulnificus was cultured in LBS medium supplemented with 100 μM of 2, 2′-dipyridyl to A600 of about 0.1. Samples were collected at late stationary phase (A600 ≅ 2.5) and both cell density and luminescence were measured. Relative light units (RLU) were normalized to cell density (luminescence/A600). Values are an average of three independent experiments and error bars denote the standard deviations. The p-values for comparison with MO6-24/O (without iron) are indicated (Student’s t-test; *, 0.005 ≤ P < 0.05; **, P < 0.005).CC BY · PubMed Central
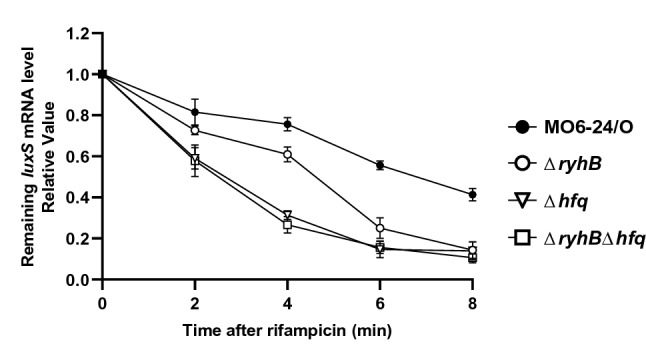
Figure 6 Effects of RyhB on the stability of luxS mRNA. Effects of RyhB and Hfq on the stability of luxS mRNA. The relative levels of luxS mRNA following rifampicin treatment were measured using qRT-PCR. V. vulnificus MO6, ryhB mutant (ΔryhB), hfq mutant (Δhfq) or ryhB, hfq double mutant (ΔryhBΔhfq) were cultured in AB broth for 5 h until reaching an A600 of 0.3. Samples were then collected at 0, 2, 4, 6, and 8 min after the addition of rifampicin (500 μg/ml), and RNA was quantified by qRT-PCR.
Figure 6 Effects of RyhB on the stability of luxS mRNA. Effects of RyhB and Hfq on the stability of luxS mRNA. The relative levels of luxS mRNA following rifampicin treatment were measured using qRT-PCR. V. vulnificus MO6, ryhB mutant (ΔryhB), hfq mutant (Δhfq) or ryhB, hfq double mutant (ΔryhBΔhfq) were cultured in AB broth for 5 h until reaching an A600 of 0.3. Samples were then collected at 0, 2, 4, 6, and 8 min after the addition of rifampicin (500 μg/ml), and RNA was quantified by qRT-PCR.CC BY · PubMed Central
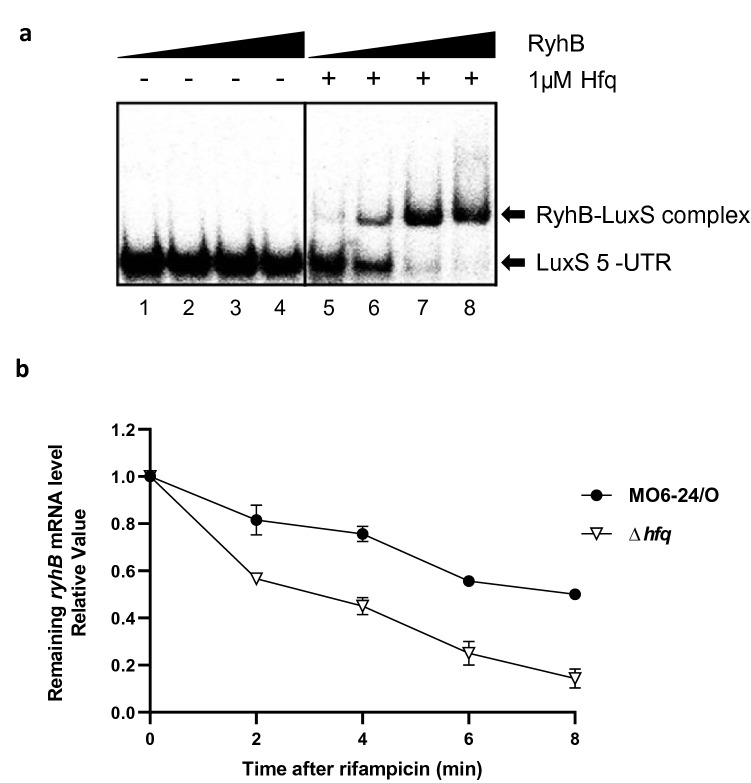
Figure 7 Effects of Hfq on interactions between RyhB and luxS mRNA. (a) Gel shift assay comparing the binding of RyhB to luxS mRNA with and without Hfq. The LuxS 5′-UTR was transcribed and labeled with 32P-UTP using T7 RNA polymerase. Increasing concentrations of purified RyhB were incubated with LuxS 5′-UTR with or without the addition of 1 μM of Hfq. Lanes 1 to 4 include RyhB concentrations of 0, 100, 200, and 400 nM without Hfq, respectively. Lanes 5 to 8 include RyhB concentrations of 0, 100, 200, and 400 nM with Hfq, respectively. The probes bound by RyhB are indicated with arrows. (b) Effects of Hfq on the stability of RyhB mRNA. Relative RyhB mRNA levels following rifampicin treatment were measured using qRT-PCR. V. vulnificus MO6 or the hfq mutant (Δhfq) were cultured in AB broth for 5 h until reaching an A600 of 0.3. Samples were then collected at 0, 2, 4, 6, and 8 min after treatment with 500 μg/ml rifampicin for RNA purification and qRT-PCR analysis.
Figure 7 Effects of Hfq on interactions between RyhB and luxS mRNA. (a) Gel shift assay comparing the binding of RyhB to luxS mRNA with and without Hfq. The LuxS 5′-UTR was transcribed and labeled with 32P-UTP using T7 RNA polymerase. Increasing concentrations of purified RyhB were incubated with LuxS 5′-UTR with or without the addition of 1 μM of Hfq. Lanes 1 to 4 include RyhB concentrations of 0, 100, 200, and 400 nM without Hfq, respectively. Lanes 5 to 8 include RyhB concentrations of 0, 100, 200, and 400 nM with Hfq, respectively. The probes bound by RyhB are indicated with arrows. (b) Effects of Hfq on the stability of RyhB mRNA. Relative RyhB mRNA levels following rifampicin treatment were measured using qRT-PCR. V. vulnificus MO6 or the hfq mutant (Δhfq) were cultured in AB broth for 5 h until reaching an A600 of 0.3. Samples were then collected at 0, 2, 4, 6, and 8 min after treatment with 500 μg/ml rifampicin for RNA purification and qRT-PCR analysis.CC BY · PubMed Central
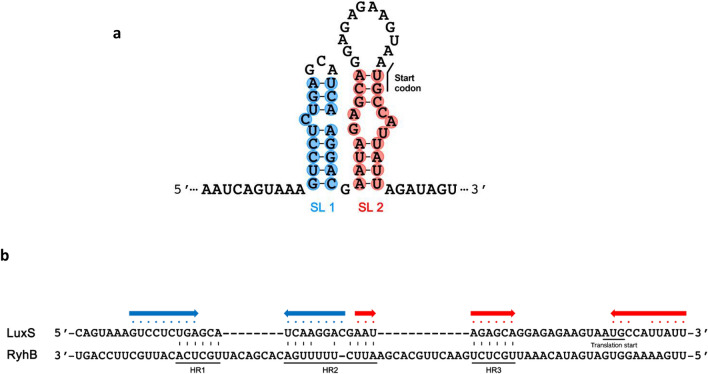
Figure 8 Predicted secondary structure of the 5′ end of luxS mRNA and potential hybridization sites between RyhB and luxS 5′-UTR mRNA. (a) The secondary structure of the 5′ end of luxS mRNA was predicted using mFold software. The nucleotides that potentially form stem structures are shaded in blue (SL1) or red (SL2) and the start codon is noted. (b) Possible regions where RyhB and the luxS 5′-UTR may hybridize. Three possible regions of hybridization (HR1, HR2, and HR3) are indicated and the potential stem structures from (a) are noted with the corresponding colored dots and arrows.
Figure 8 Predicted secondary structure of the 5′ end of luxS mRNA and potential hybridization sites between RyhB and luxS 5′-UTR mRNA. (a) The secondary structure of the 5′ end of luxS mRNA was predicted using mFold software. The nucleotides that potentially form stem structures are shaded in blue (SL1) or red (SL2) and the start codon is noted. (b) Possible regions where RyhB and the luxS 5′-UTR may hybridize. Three possible regions of hybridization (HR1, HR2, and HR3) are indicated and the potential stem structures from (a) are noted with the corresponding colored dots and arrows.CC BY · PubMed Central
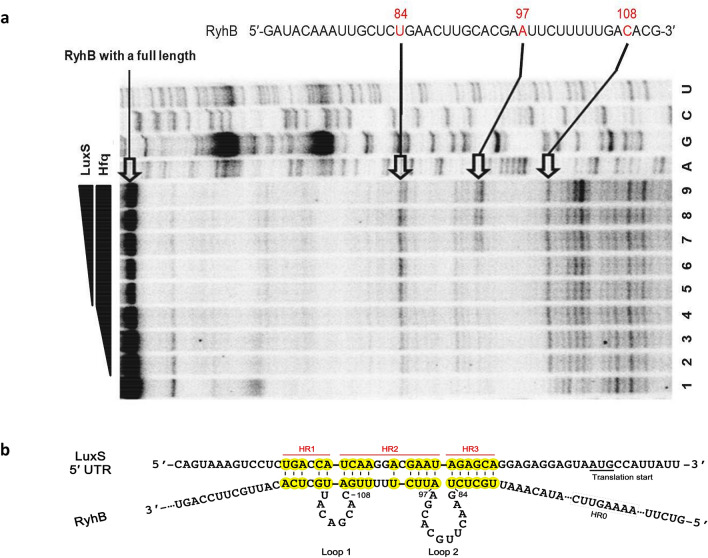
Figure 9 Identification of regions of RyhB RNA that hybridize with luxS mRNA. (a) Primer extension assays to determine the hybridization sites between RyhB and luxS RNA. Lanes 1 to 4 include Hfq at 0, 125, 250, and 500 nM, respectively. Lanes 5 to 9 include luxS RNA at 100, 200, 400, 600, and 800 nM incubated with 1 μM Hfq, respectively. The three distinct bands that represent higher intensities in the presence of Hfq are indicated. Base positions are numbered relative to the transcription start site of RyhB. (b) A model of base pairings between LuxS 5′-UTR and RyhB. Hybridization regions (HR) 1, 2, and 3 are highlighted in yellow. Loops 1 and 2 of RyhB, which form during the hybridization also are indicated. The region labeled HR0 is the site that was mutagenized to generate HR0m as a positive control.
Figure 9 Identification of regions of RyhB RNA that hybridize with luxS mRNA. (a) Primer extension assays to determine the hybridization sites between RyhB and luxS RNA. Lanes 1 to 4 include Hfq at 0, 125, 250, and 500 nM, respectively. Lanes 5 to 9 include luxS RNA at 100, 200, 400, 600, and 800 nM incubated with 1 μM Hfq, respectively. The three distinct bands that represent higher intensities in the presence of Hfq are indicated. Base positions are numbered relative to the transcription start site of RyhB. (b) A model of base pairings between LuxS 5′-UTR and RyhB. Hybridization regions (HR) 1, 2, and 3 are highlighted in yellow. Loops 1 and 2 of RyhB, which form during the hybridization also are indicated. The region labeled HR0 is the site that was mutagenized to generate HR0m as a positive control.CC BY · PubMed Central
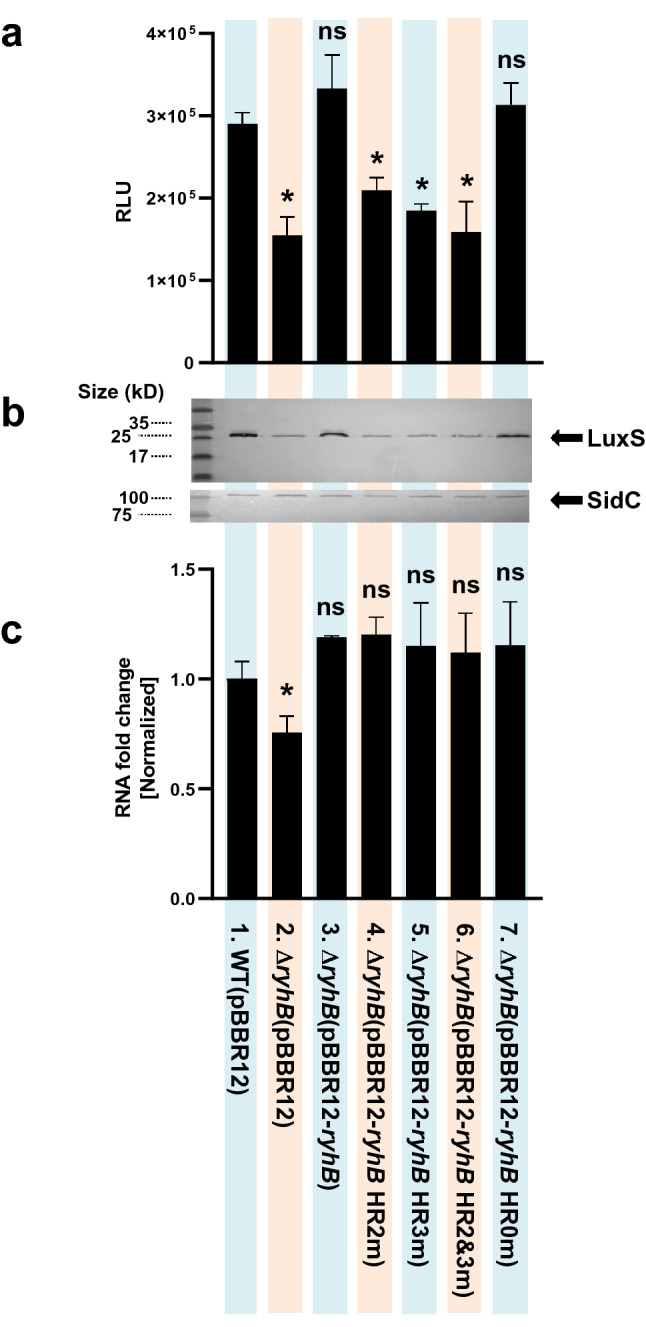
Figure 10 Effects of the hybridization between RhyB and luxS mRNA on expression of LuxS. (a) Influence of hybridization regions HR2 and HR3 on the production of AI-2 by LuxS as measured using the V. harveyi indicator strain BB170. The following V. vulnificus strains were cultured in AB minimal medium and sampled for the presence of AI-2 in the supernatant: 1, wild type (MO6 pBBR12); 2, ryhB deletion mutant (ΔryhB pBBR12); 3, ΔryhB with a wild type ryhB clone (ΔryhB pBBR12-ryhB); 4, ΔryhB with a mutated region HR2 clone (ΔryhB pBBR12-ryhB HR2m); 5, ΔryhB with mutated region HR3 clone (ΔryhB pBBR12-ryhB HR3m); 6, ΔryhB carrying a clone with both HR2 and HR3 mutated (ΔryhB pBBR12-ryhB HR2&3m); 7, ΔryhB with a clone carrying an unrelated mutated region as a control (ΔryhB pBBR12-ryhB HR0m). The presence of AI-2 was measured in RLU, relative light units (luminescence/A600). Values are averages from three independent experiments and error bars denote the standard deviations. The p-values as compared with MO6-24/O pBBR12 are indicated (Student’s t-test; *, 0.005 ≤ P < 0.05; ns, no significant). (b) Effects of HR2 and HR3 on the production of LuxS as measured by western hybridization. Western blot analysis of LuxS levels in whole cell lysates was measured. As a control, insulinase enzyme (SidC) (Kim et al., 2015. J. Biol. Chem. 290:18708), which is not regulated by quorum-sensing, was included. (c) The relative mRNA levels of luxS were measured using qRT-PCR for each of the strains listed in 10A. Cells were cultured in AB broth for 5 h until they reached an A600 of 0.3, at which point samples were collected for RNA purification and qRT-PCR analysis. The p-values for comparison with MO6-24/O pBBR12 are indicated (Student’s t-test; *, 0.005 ≤ P < 0.05; ns, no significant).
Figure 10 Effects of the hybridization between RhyB and luxS mRNA on expression of LuxS. (a) Influence of hybridization regions HR2 and HR3 on the production of AI-2 by LuxS as measured using the V. harveyi indicator strain BB170. The following V. vulnificus strains were cultured in AB minimal medium and sampled for the presence of AI-2 in the supernatant: 1, wild type (MO6 pBBR12); 2, ryhB deletion mutant (ΔryhB pBBR12); 3, ΔryhB with a wild type ryhB clone (ΔryhB pBBR12-ryhB); 4, ΔryhB with a mutated region HR2 clone (ΔryhB pBBR12-ryhB HR2m); 5, ΔryhB with mutated region HR3 clone (ΔryhB pBBR12-ryhB HR3m); 6, ΔryhB carrying a clone with both HR2 and HR3 mutated (ΔryhB pBBR12-ryhB HR2&3m); 7, ΔryhB with a clone carrying an unrelated mutated region as a control (ΔryhB pBBR12-ryhB HR0m). The presence of AI-2 was measured in RLU, relative light units (luminescence/A600). Values are averages from three independent experiments and error bars denote the standard deviations. The p-values as compared with MO6-24/O pBBR12 are indicated (Student’s t-test; *, 0.005 ≤ P < 0.05; ns, no significant). (b) Effects of HR2 and HR3 on the production of LuxS as measured by western hybridization. Western blot analysis of LuxS levels in whole cell lysates was measured. As a control, insulinase enzyme (SidC) (Kim et al., 2015. J. Biol. Chem. 290:18708), which is not regulated by quorum-sensing, was included. (c) The relative mRNA levels of luxS were measured using qRT-PCR for each of the strains listed in 10A. Cells were cultured in AB broth for 5 h until they reached an A600 of 0.3, at which point samples were collected for RNA purification and qRT-PCR analysis. The p-values for comparison with MO6-24/O pBBR12 are indicated (Student’s t-test; *, 0.005 ≤ P < 0.05; ns, no significant).CC BY · PubMed Central

Verification

Claims the paper makes

The claims and statistics of this paper haven’t been checked yet.

Run the check — free, no account needed. It reads the open-access text and checks the sources it cites.

A few free checks a day · papers already verified open instantly · results are public

Self-check

Percentages, sums and reported differences re-computed from the paper’s own numbers.

The self-check needs the paper’s full text.

Citations

Cites

Metadata

Authors
Lee, K.-W., Wen, Y., Park, N.-Y., & Kim, K.-S.
Affiliations
  • Sogang University (KR)
  • Fujian Medical University (CN)
Corresponding author
Kim, Kun-Soo
Venue
Scientific Reports
Published
2021-09-29
Volume
12
Issue
1
Pages
831-831
ISSN
2045-2322 (ISSN-L)
OpenAlex
W4220707098
Cited by
11
References
1
Citations by year
2026: 2 · 2025: 1 · 2023: 2 · 2022: 6
FWCI
0.73
Type
journal article
Language
en
Open access
Locations
  • Scientific Reports (publishedVersion, cc-by)
  • Research Square (acceptedVersion, cc-by)
  • PubMed Central (publishedVersion, cc-by)
  • PubMed (publishedVersion)
  • DOAJ (DOAJ: Directory of Open Access Journals) (submittedVersion, cc-by-sa)
Funders
  • National Research Foundation (NRF-2019R1A2C2084282)
  • National Research Foundation of Korea (NRF-2019R1A2C2084282)
Topics
  • Life Sciences › Biochemistry, Genetics and Molecular Biology › Molecular Biology › Bacterial biofilms and quorum sensing
  • Life Sciences › Biochemistry, Genetics and Molecular Biology › Genetics › Bacterial Genetics and Biotechnology
  • Life Sciences › Immunology and Microbiology › Microbiology › Vibrio bacteria research studies
Keywords
RyhB, small RNA, quorum sensing, autoinducer-2, LuxS, Vibrio vulnificus, mRNA stability, untranslated regions, translational regulation, heteroduplex, iron availability, cell density signaling, feedback control
MeSH terms
Bacterial Proteins, Genes, Bacterial, Homoserine, Iron, Lactones, RNA, Messenger, Carbon-Sulfur Lyases, Signal Transduction, Gene Expression Regulation, Bacterial, 5' Untranslated Regions, Vibrio vulnificus, Quorum Sensing, RNA, Small Untranslated

About these checks

Registry, retraction, Cites and statistics results are computed, not judged, with one exception: a printed reference that no index lists is read once by a model before it counts as a citation error. Claims are extracted by a model and kept only when their quote appears verbatim in the text; each cited source is then checked, with a model’s help, for whether it says what the claim relies on. Those verdicts can be wrong — read the claim’s quote and the cited source before relying on one.

Statistics and arithmetic are recomputed, not judged.

Confidence bands are shown only for fields calibrated on our annotated test set. None is calibrated yet, so no band is shown.

What counts as a claim ›How we measure confidence ›How we check this ›

Are you an author, or do you see a problem with this page? Request a review