Cited by 14

The DOI matches its Crossref record; 2 of the 2 references it cites were found in a registry or an index.

Efficacy and Safety of Mavacamten in Treatment of Hypertrophic Cardiomyopathy: A Systematic Review and Meta-Analysis

Memon, Areeba, Larik, Muhammad Omar, Khan, Zoha, Urooj, Maryam, Irfan, Areeka, Kumari, Beena, Faisal, Mehak, Siddiqui, Rida, Tehrim, Moniba, Hameed, Ishaque·2023·Future Science OA

Overview

The claims and statistics of this paper haven’t been checked yet.

Run the check — free, no account needed. It reads the open-access text and checks the sources it cites.

A few free checks a day · papers already verified open instantly · results are public

Integrity signals

Registry

Crossref · 10.2144/fsoa-2023-0059

Cites

2 of 2 references verified0 citation errors · 0 not checkable

Statistics

Figures

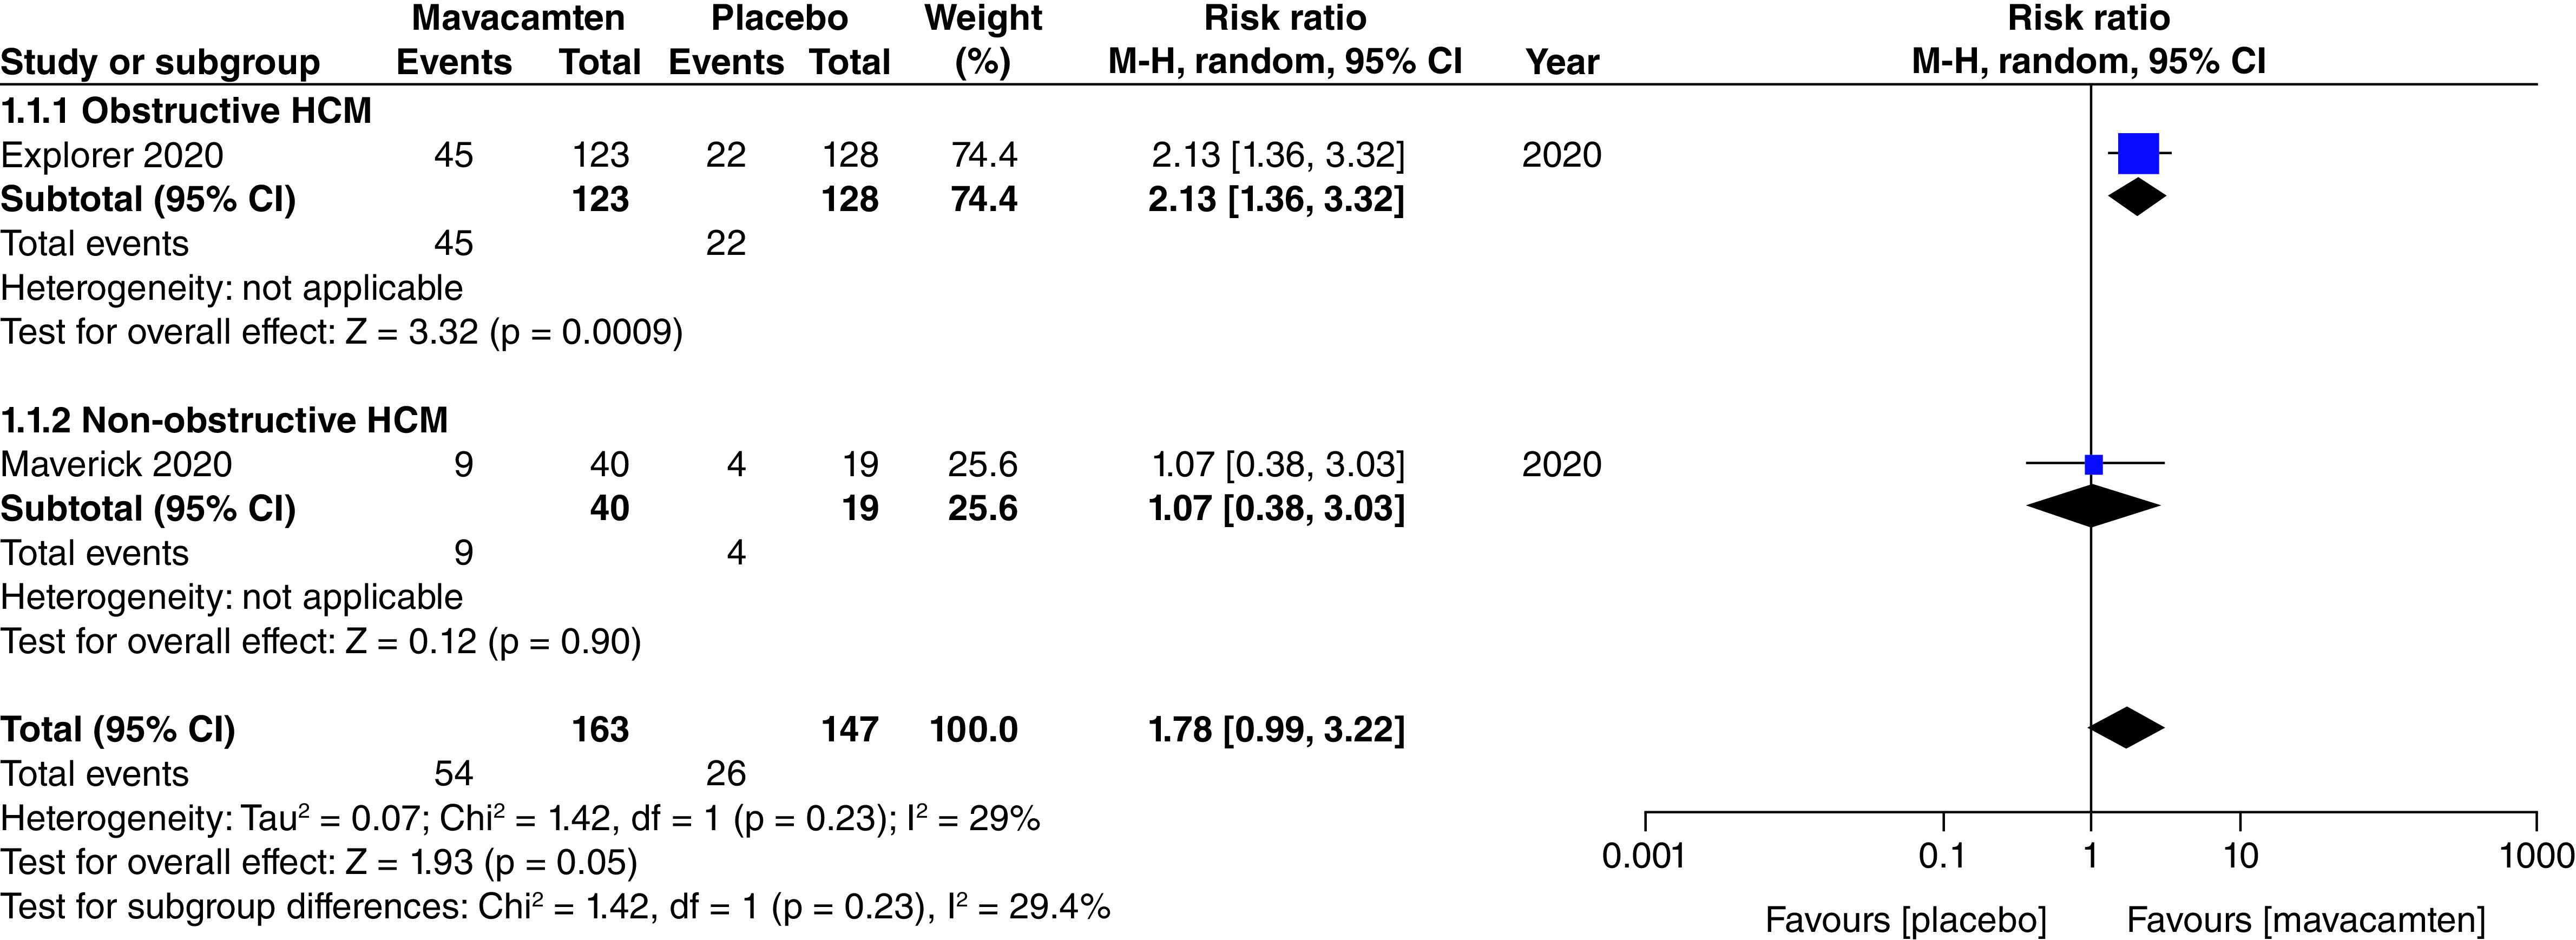
Figure 1. Forest plot of composite functional end point. CI: Confidence interval; HCM: Hypertrophic cardiomyopathy.
Figure 1. Forest plot of composite functional end point. CI: Confidence interval; HCM: Hypertrophic cardiomyopathy.CC BY · PubMed Central
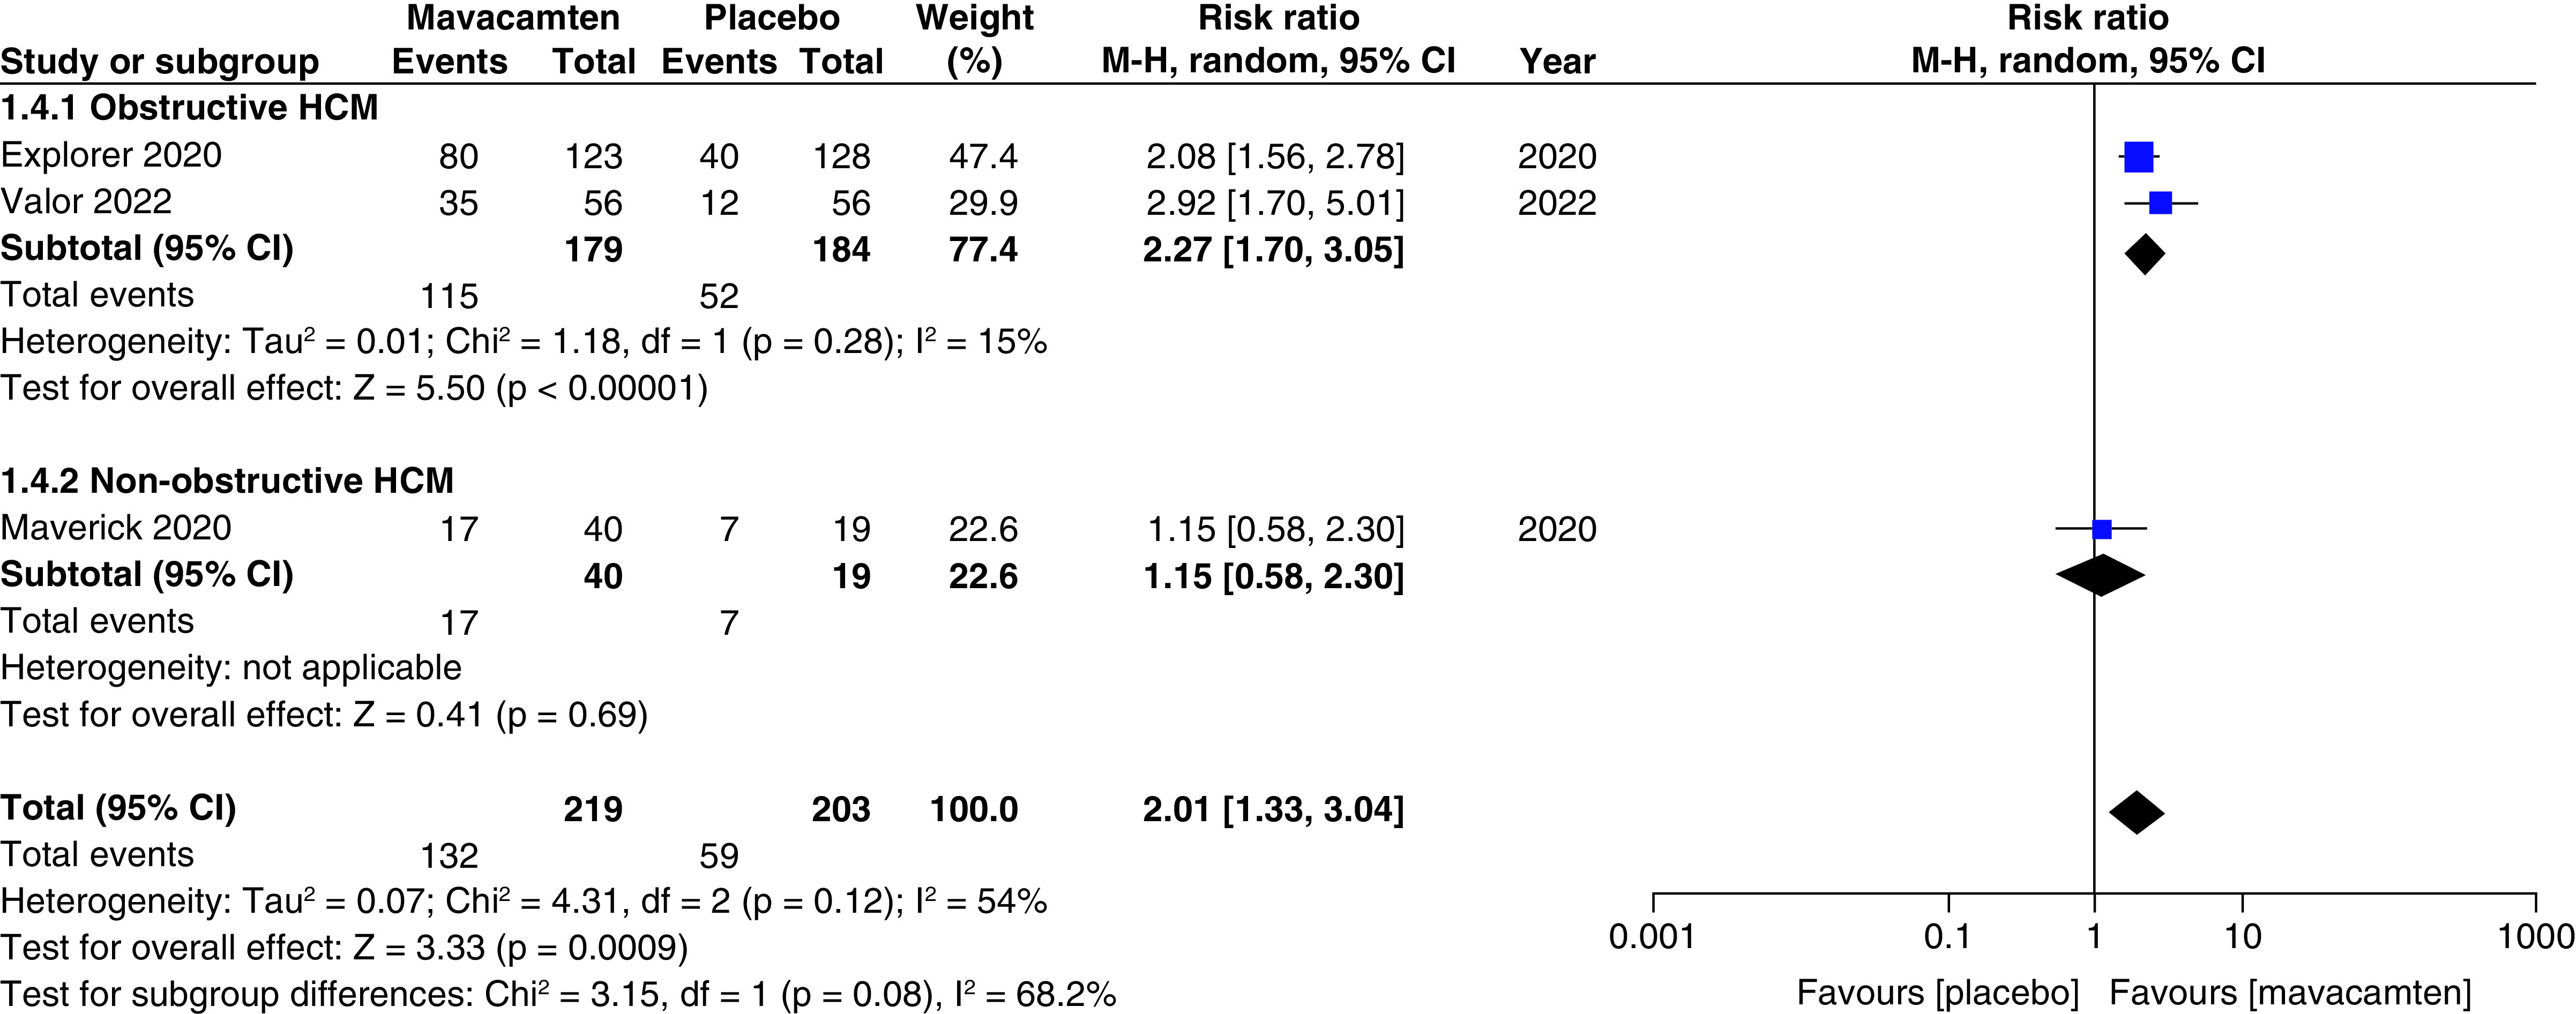
Figure 2. Forest plot of ≥1 New York Heart Association class. CI: Confidence interval; HCM: Hypertrophic cardiomyopathy.
Figure 2. Forest plot of ≥1 New York Heart Association class. CI: Confidence interval; HCM: Hypertrophic cardiomyopathy.CC BY · PubMed Central
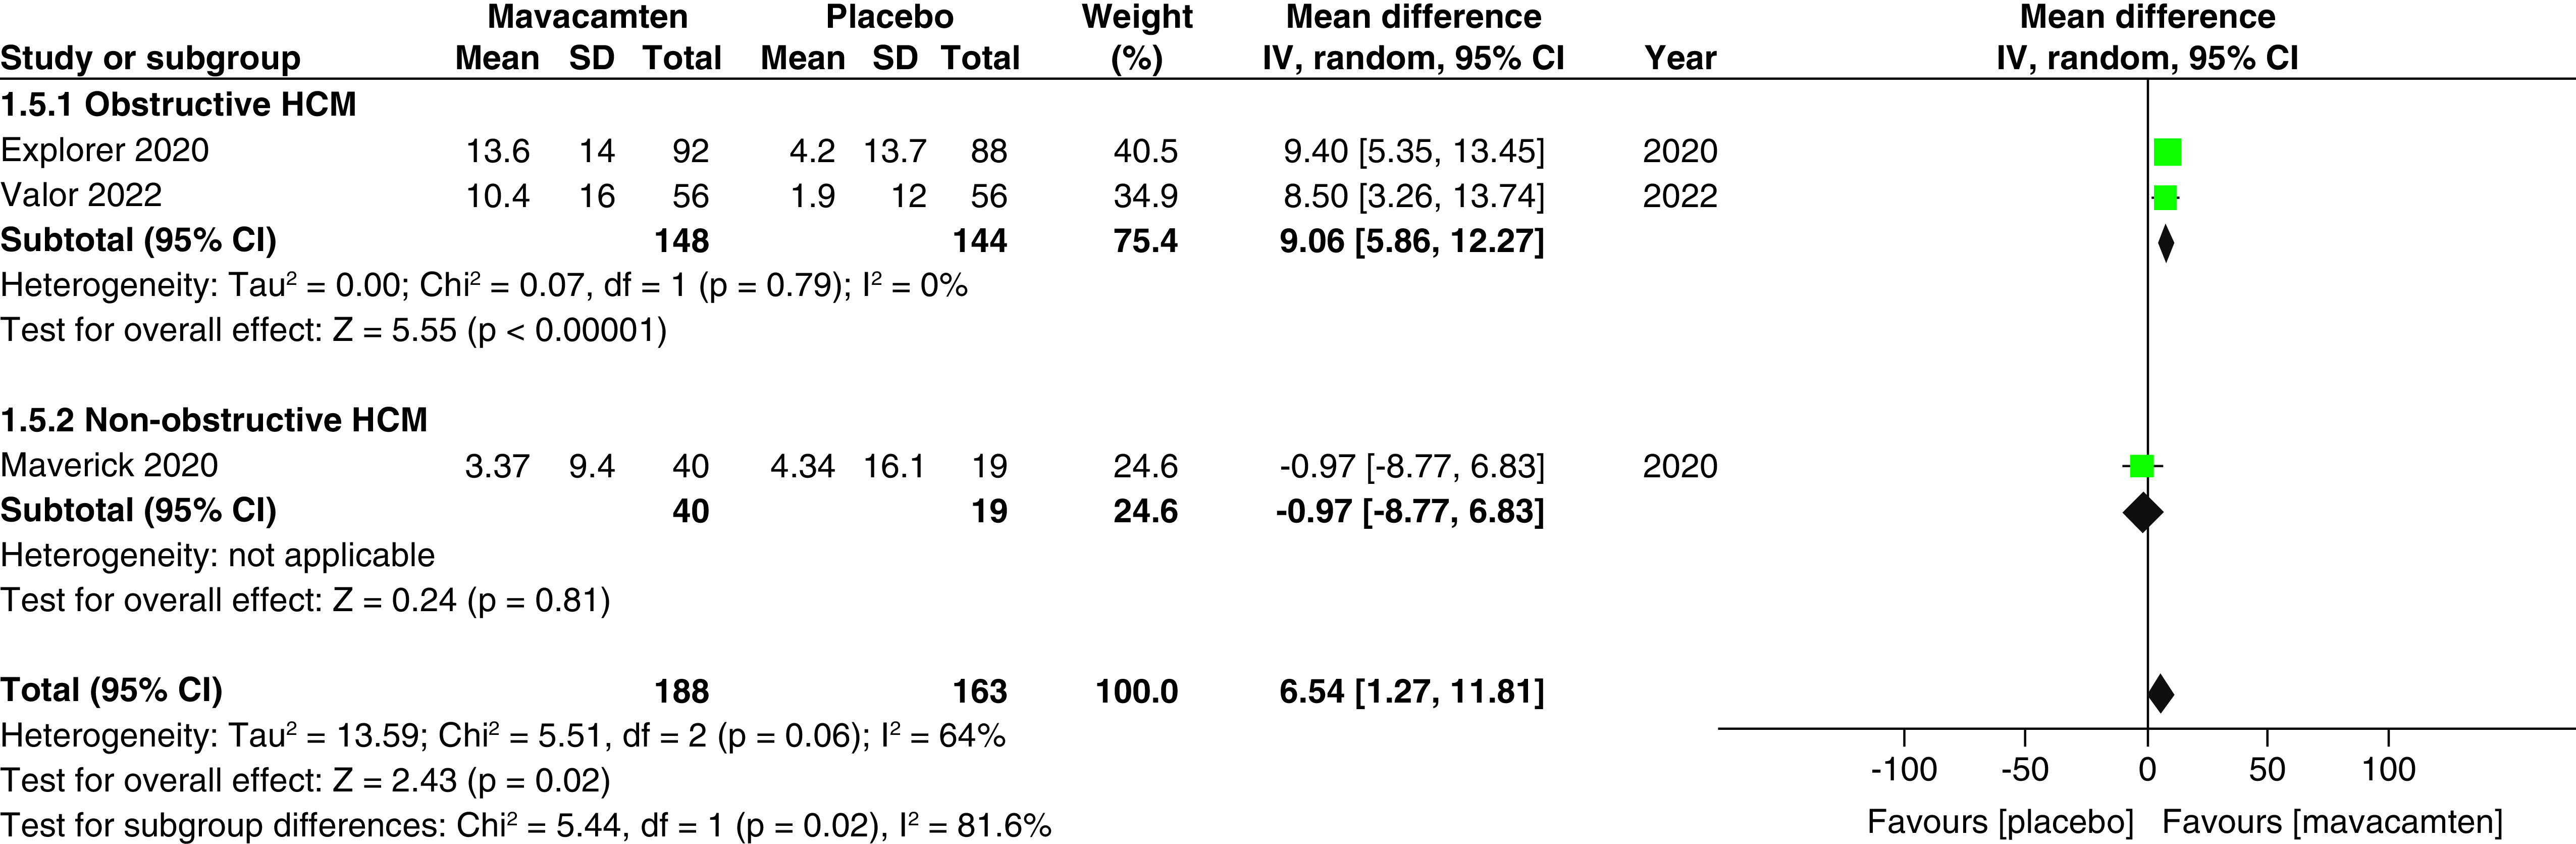
Figure 3. Forest plot of changes from baseline in Clinical Summary Score of the Kansas City Cardiomyopathy Questionnaire score. CI: Confidence interval; HCM: Hypertrophic cardiomyopathy; SD: Standard deviation.
Figure 3. Forest plot of changes from baseline in Clinical Summary Score of the Kansas City Cardiomyopathy Questionnaire score. CI: Confidence interval; HCM: Hypertrophic cardiomyopathy; SD: Standard deviation.CC BY · PubMed Central
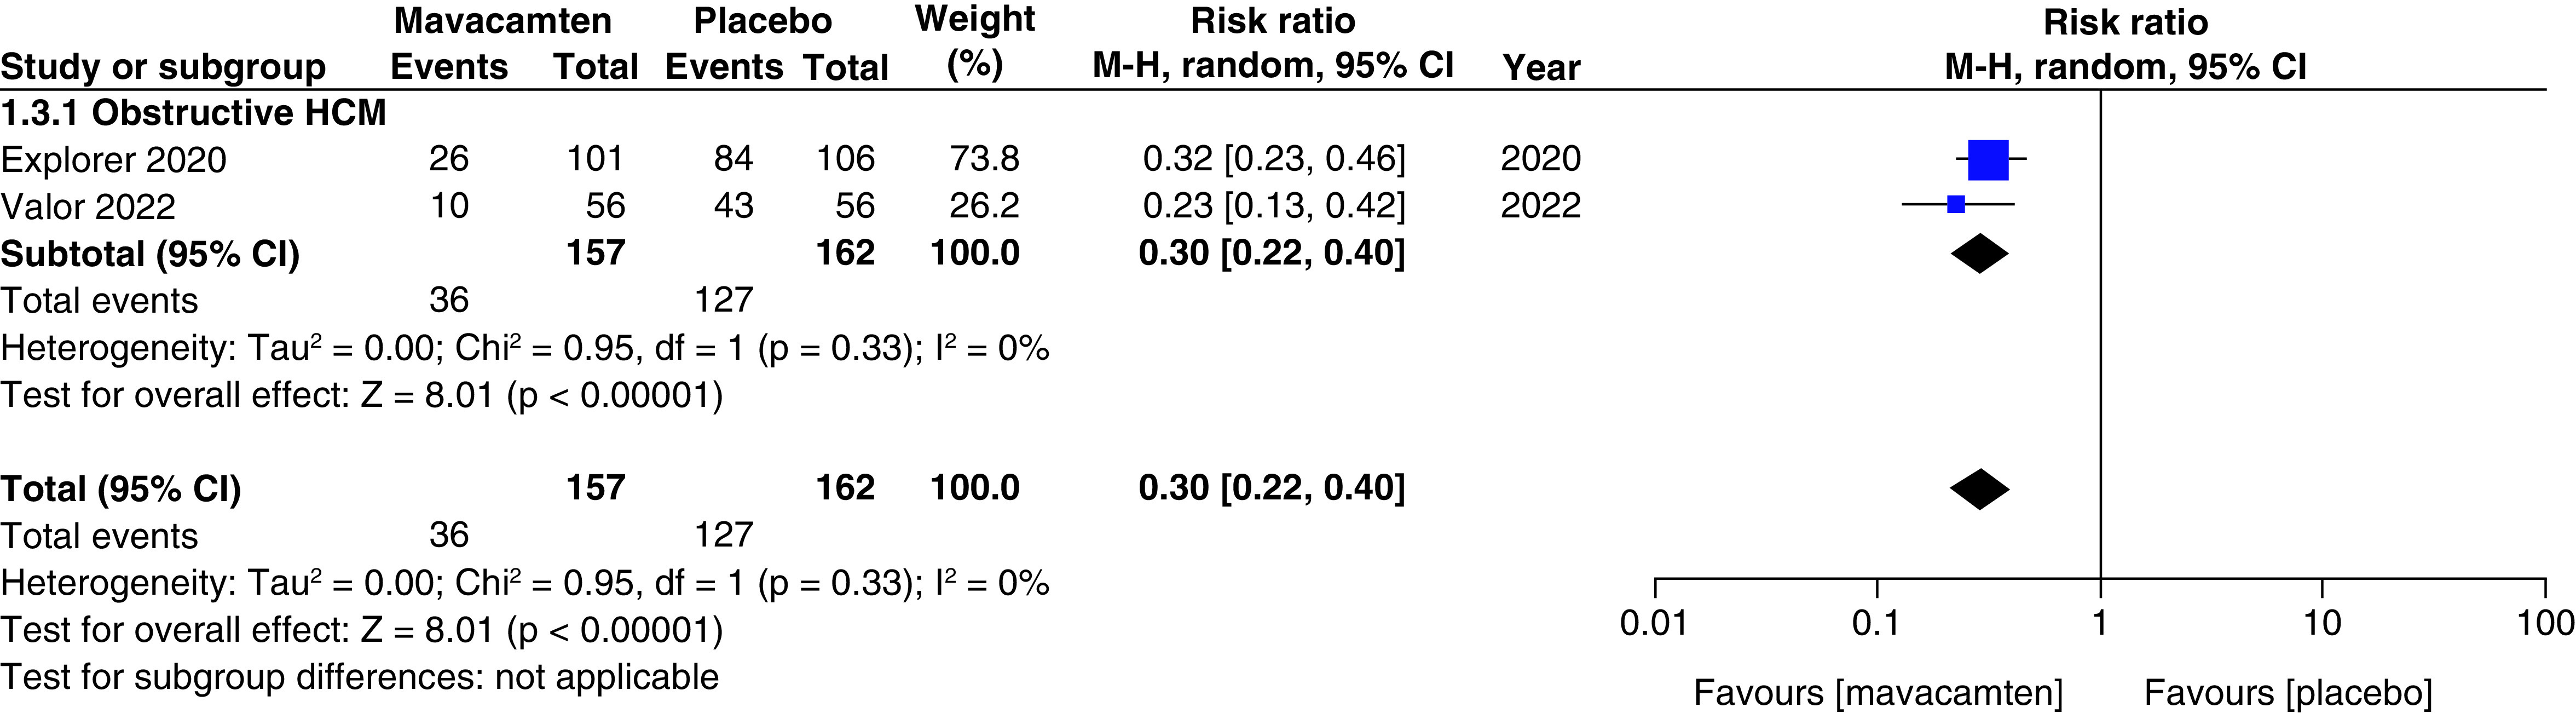
Figure 4. Forest plot of eligibility for septal reduction therapy. CI: Confidence interval; HCM: Hypertrophic cardiomyopathy.
Figure 4. Forest plot of eligibility for septal reduction therapy. CI: Confidence interval; HCM: Hypertrophic cardiomyopathy.CC BY · PubMed Central
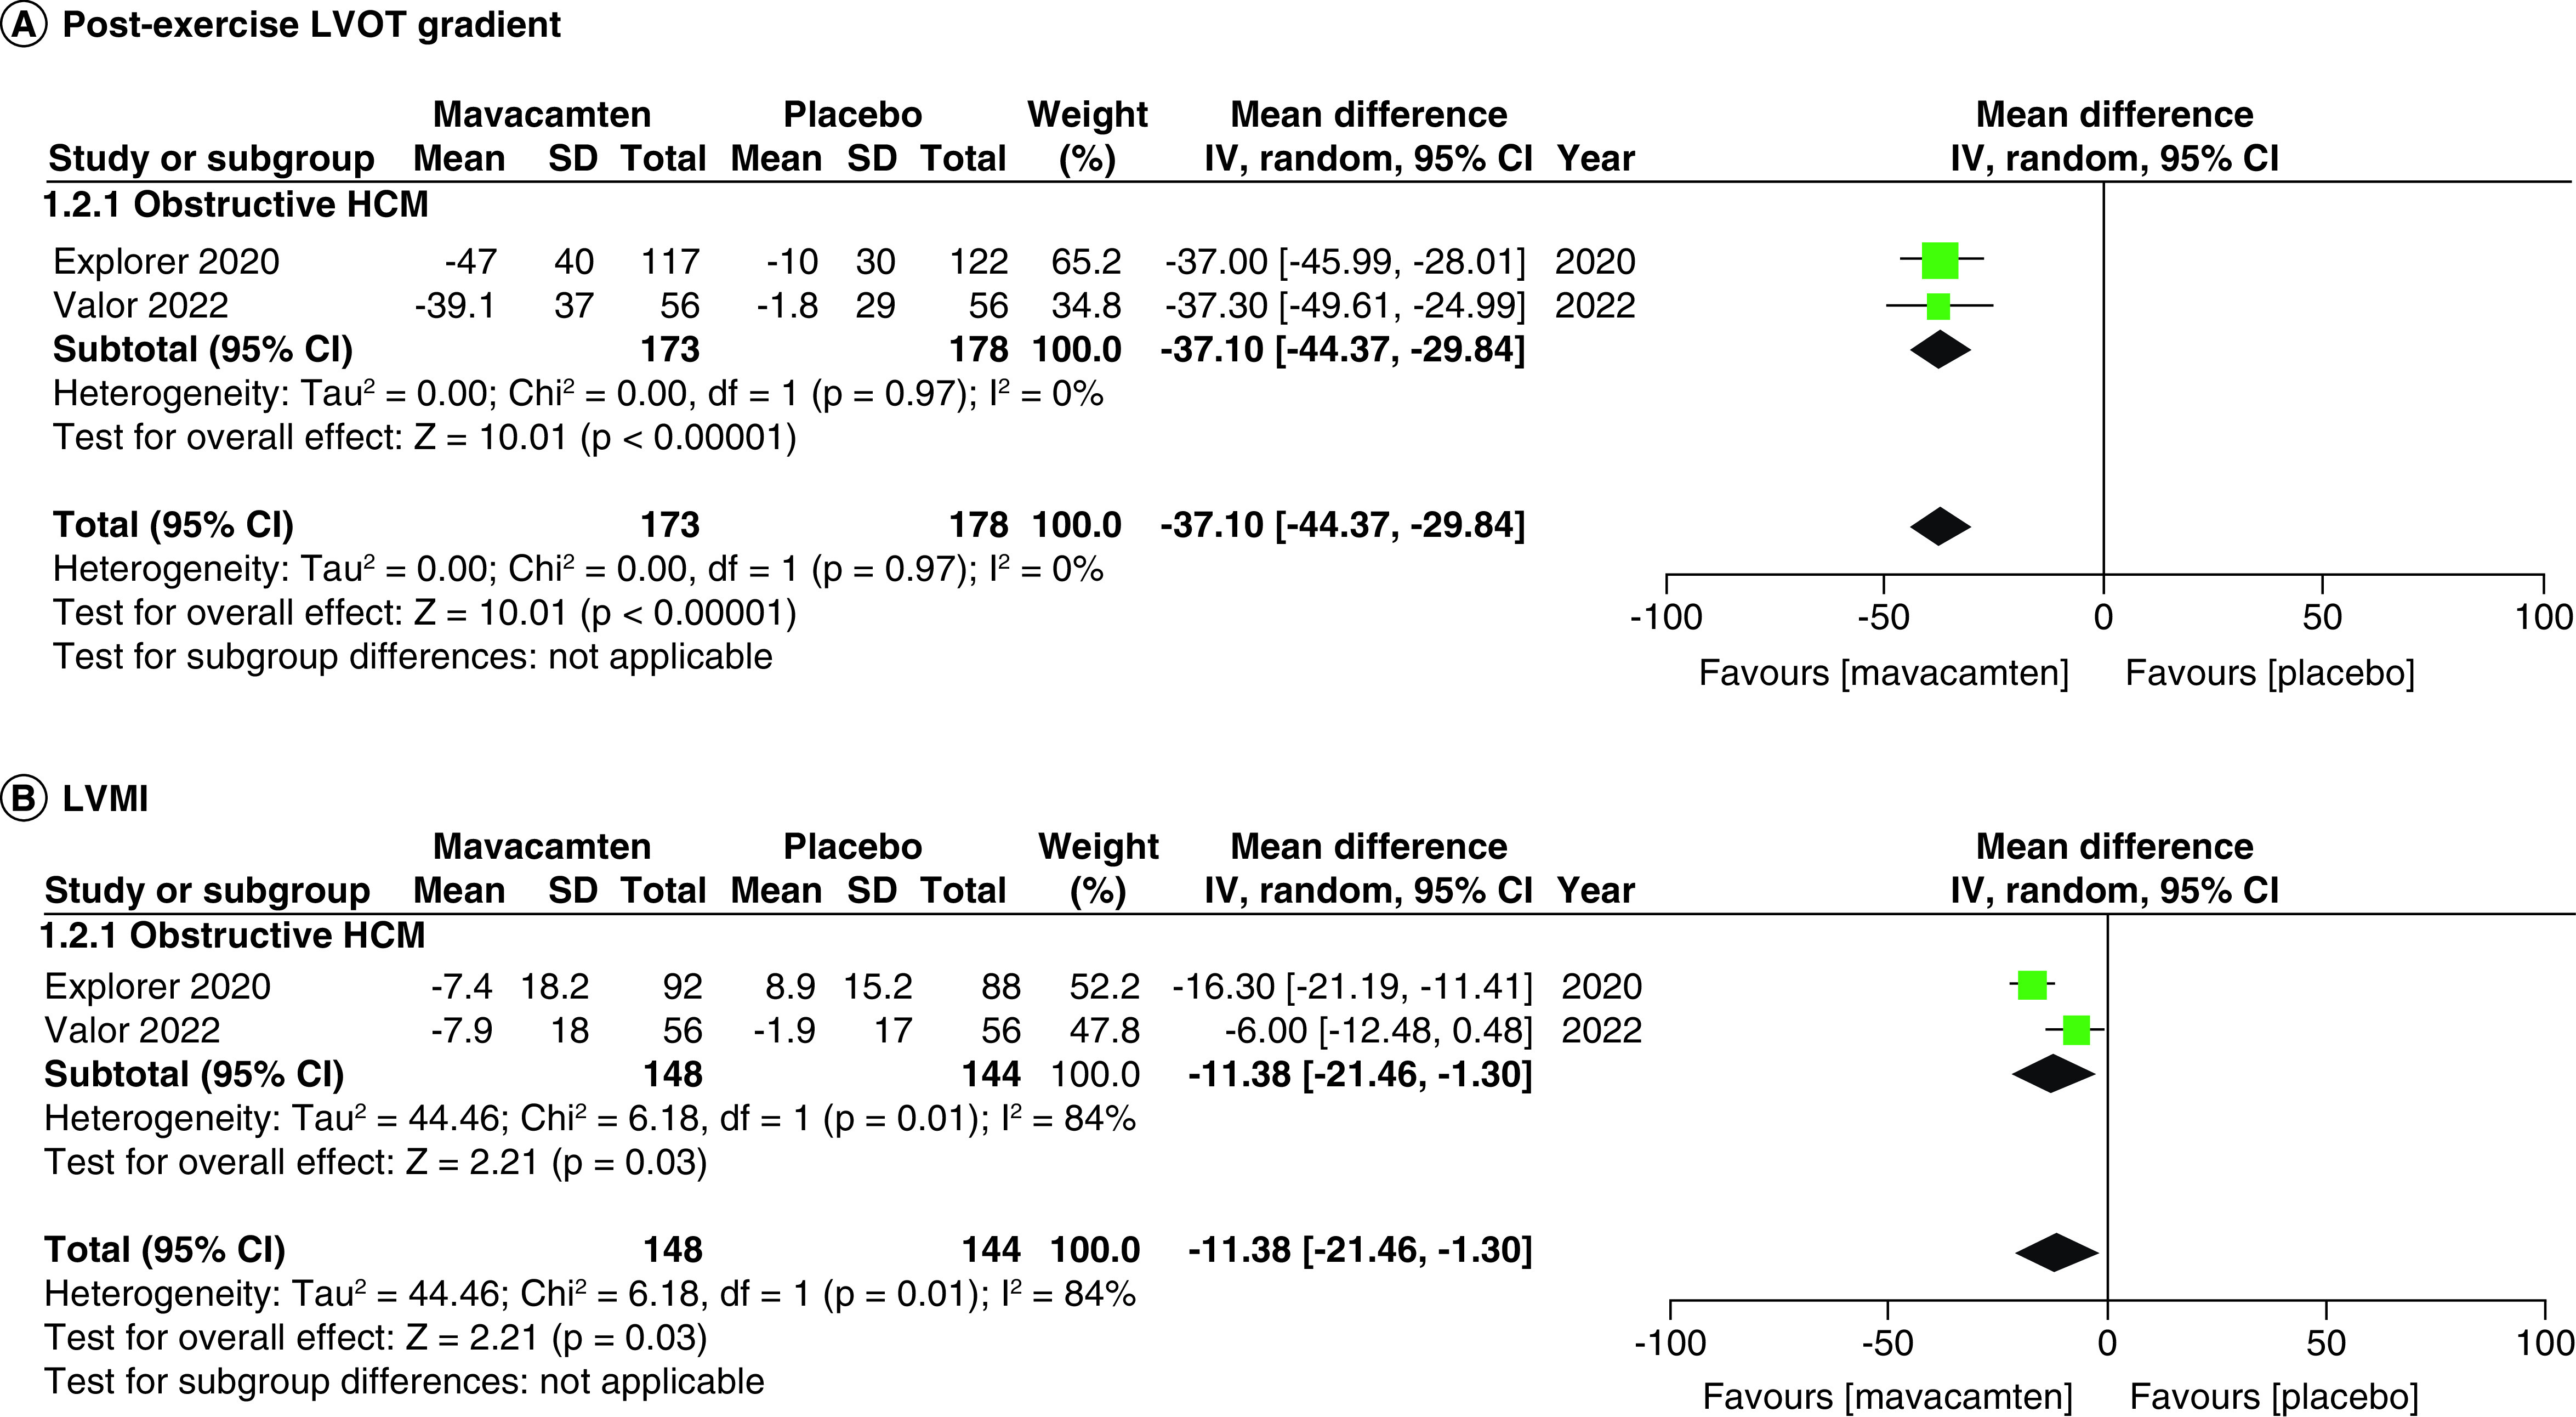
Figure 5. Forest plots of changes from baseline in post-exercise left ventricular outflow tract gradient and left ventricular mass index. (A) Refers to the changes from baseline in post-exercise left ventricular outflow tract gradient. (B) Refers to the changes from baseline in left ventricular mass index. CI: Confidence interval; HCM: Hypertrophic cardiomyopathy; SD: Standard deviation.
Figure 5. Forest plots of changes from baseline in post-exercise left ventricular outflow tract gradient and left ventricular mass index. (A) Refers to the changes from baseline in post-exercise left ventricular outflow tract gradient. (B) Refers to the changes from baseline in left ventricular mass index. CI: Confidence interval; HCM: Hypertrophic cardiomyopathy; SD: Standard deviation.CC BY · PubMed Central
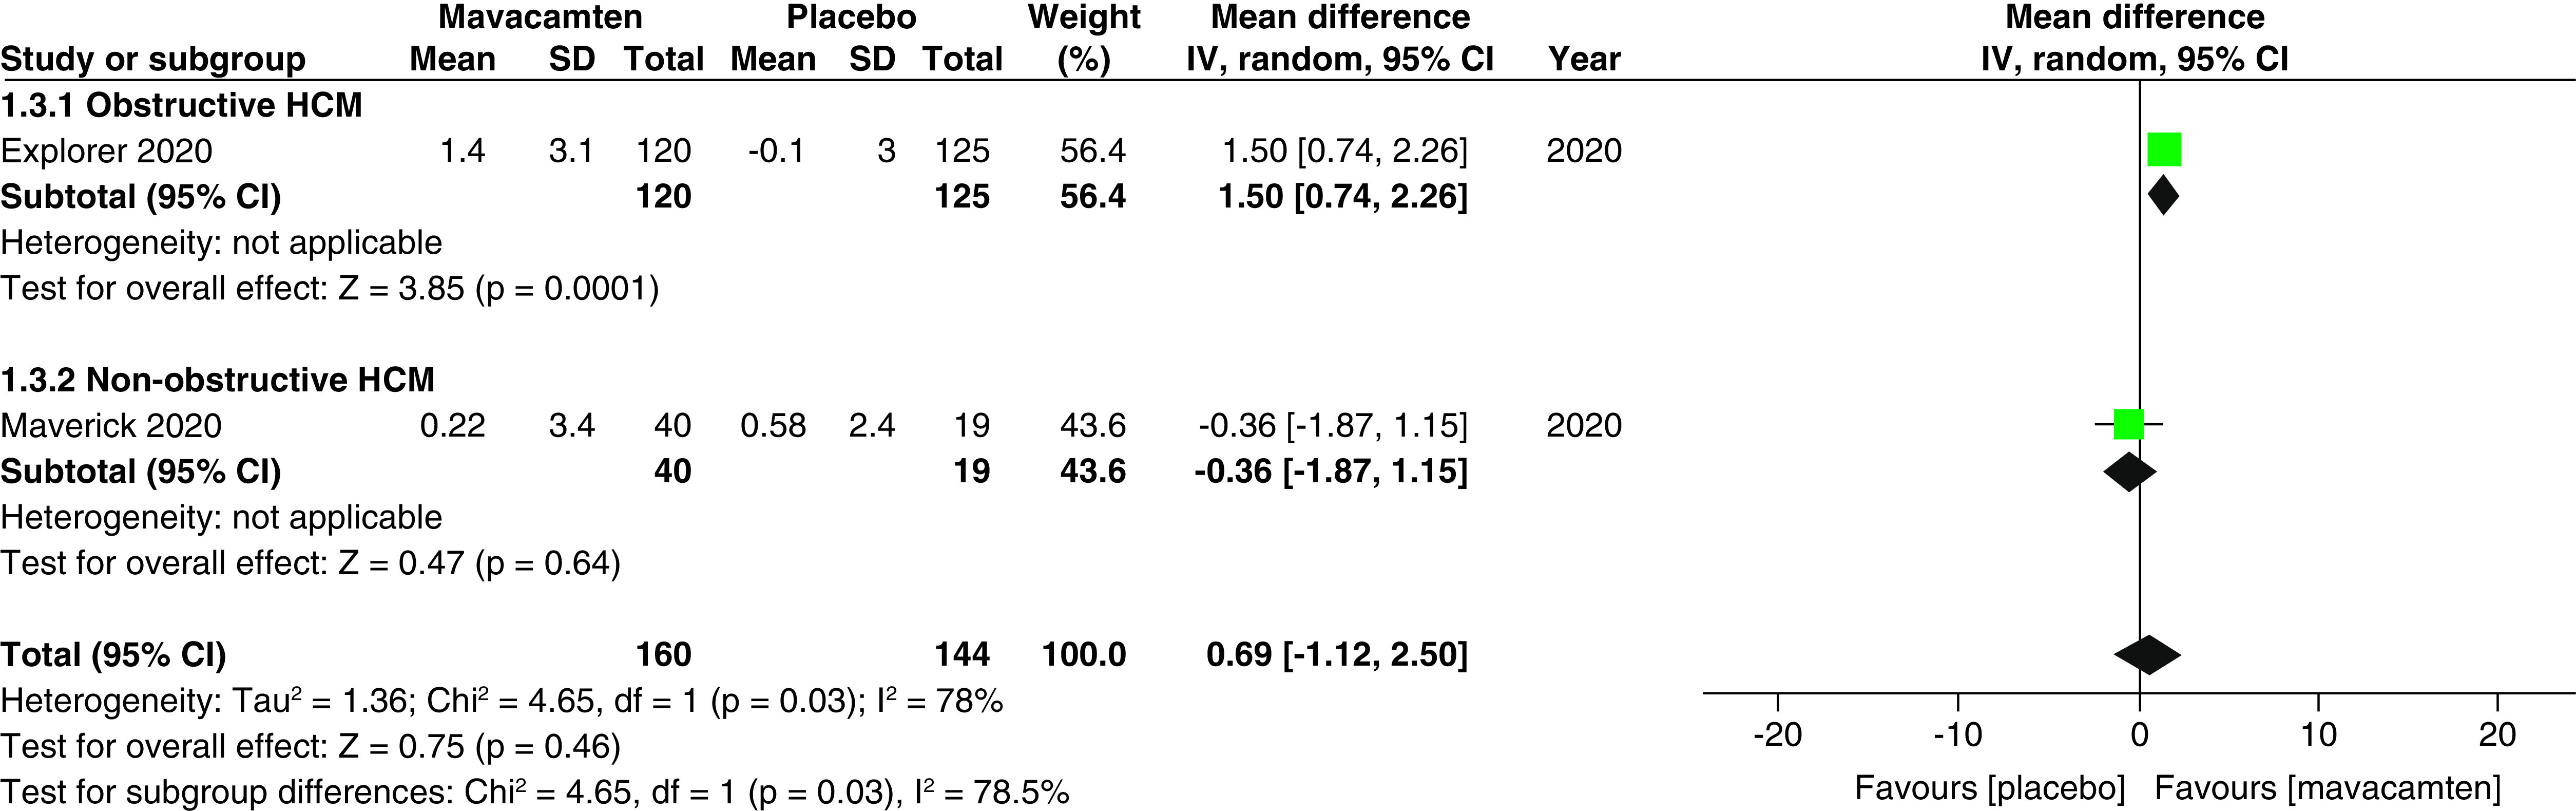
Figure 6. Forest plot of changes from baseline in peak oxygen uptake (pVO2). CI: Confidence interval; HCM: Hypertrophic cardiomyopathy; SD: Standard deviation.
Figure 6. Forest plot of changes from baseline in peak oxygen uptake (pVO2). CI: Confidence interval; HCM: Hypertrophic cardiomyopathy; SD: Standard deviation.CC BY · PubMed Central
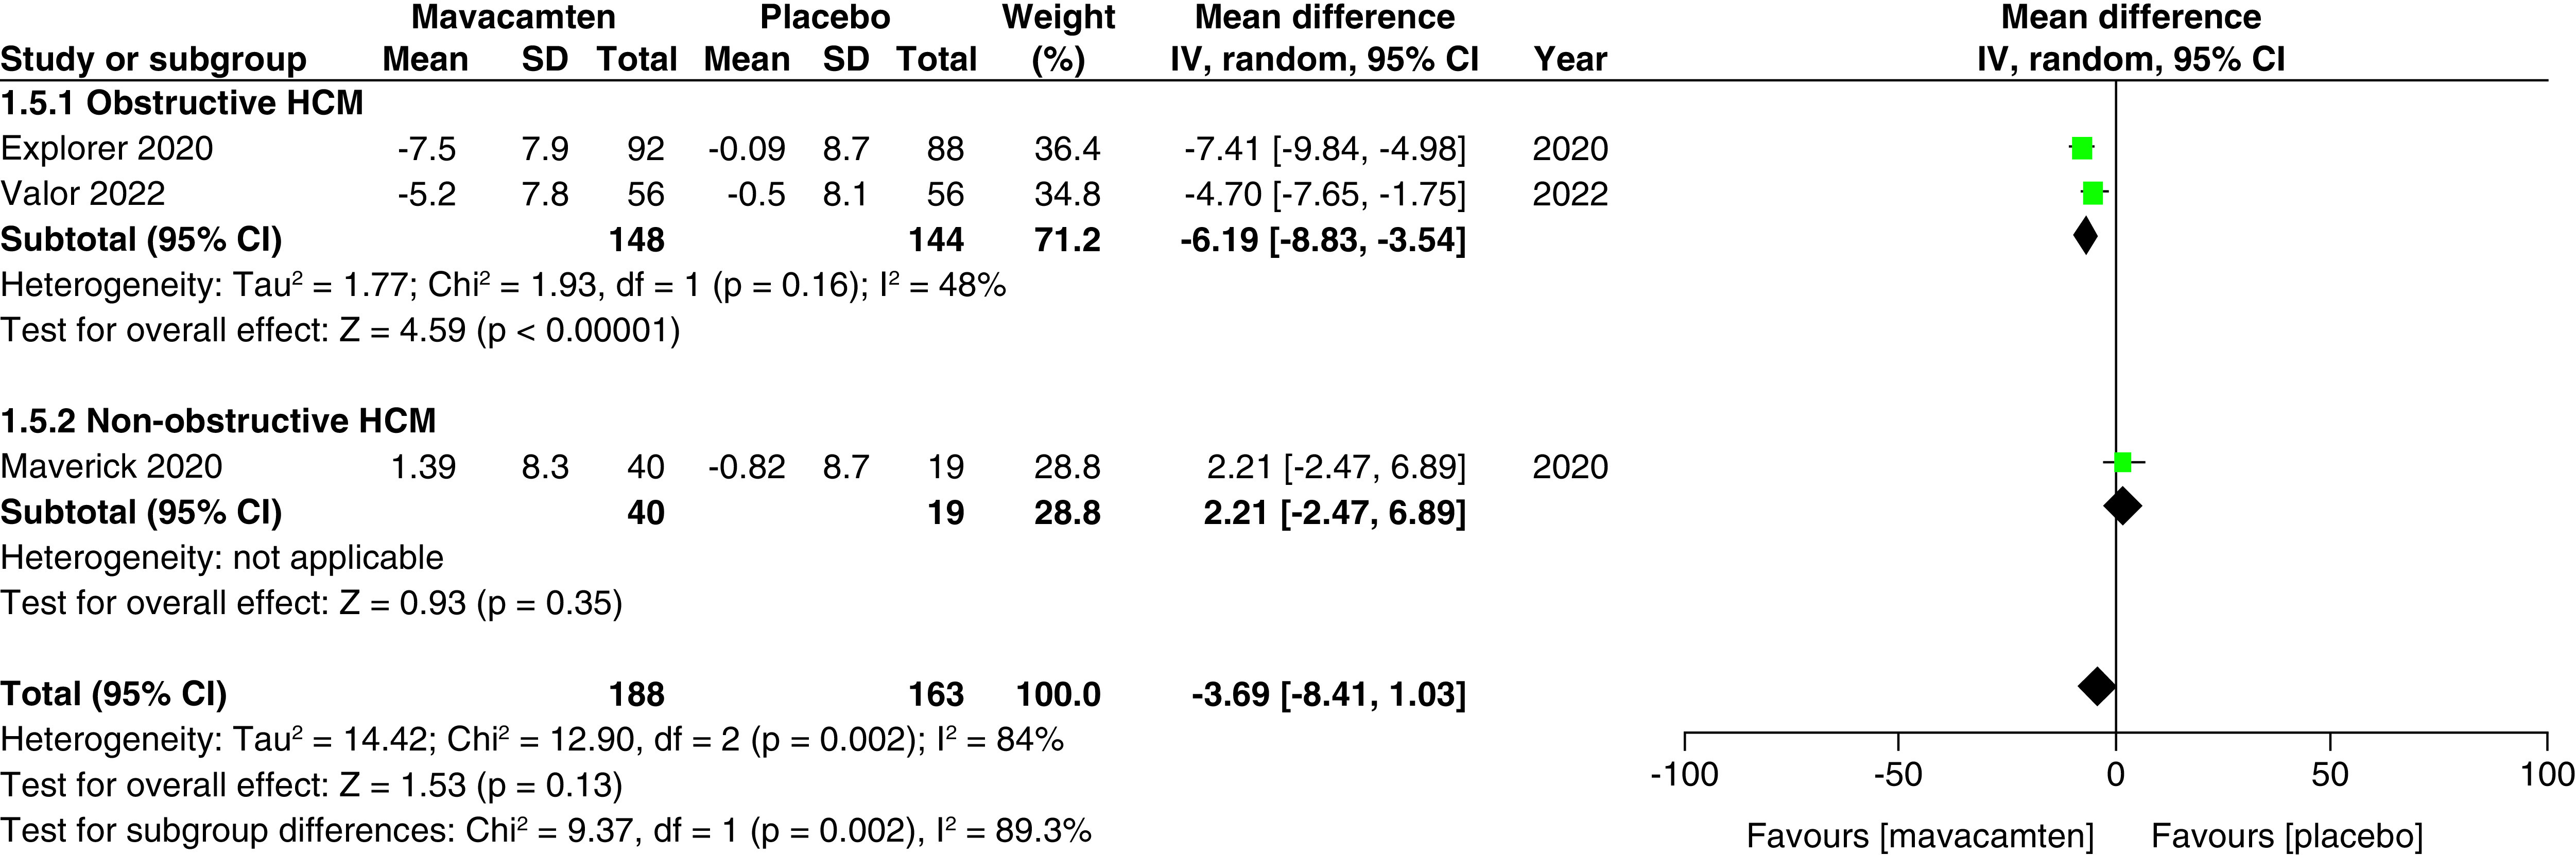
Figure 7. Forest plot of changes from baseline in left atrial volume index. CI: Confidence interval; HCM: Hypertrophic cardiomyopathy; SD: Standard deviation.
Figure 7. Forest plot of changes from baseline in left atrial volume index. CI: Confidence interval; HCM: Hypertrophic cardiomyopathy; SD: Standard deviation.CC BY · PubMed Central
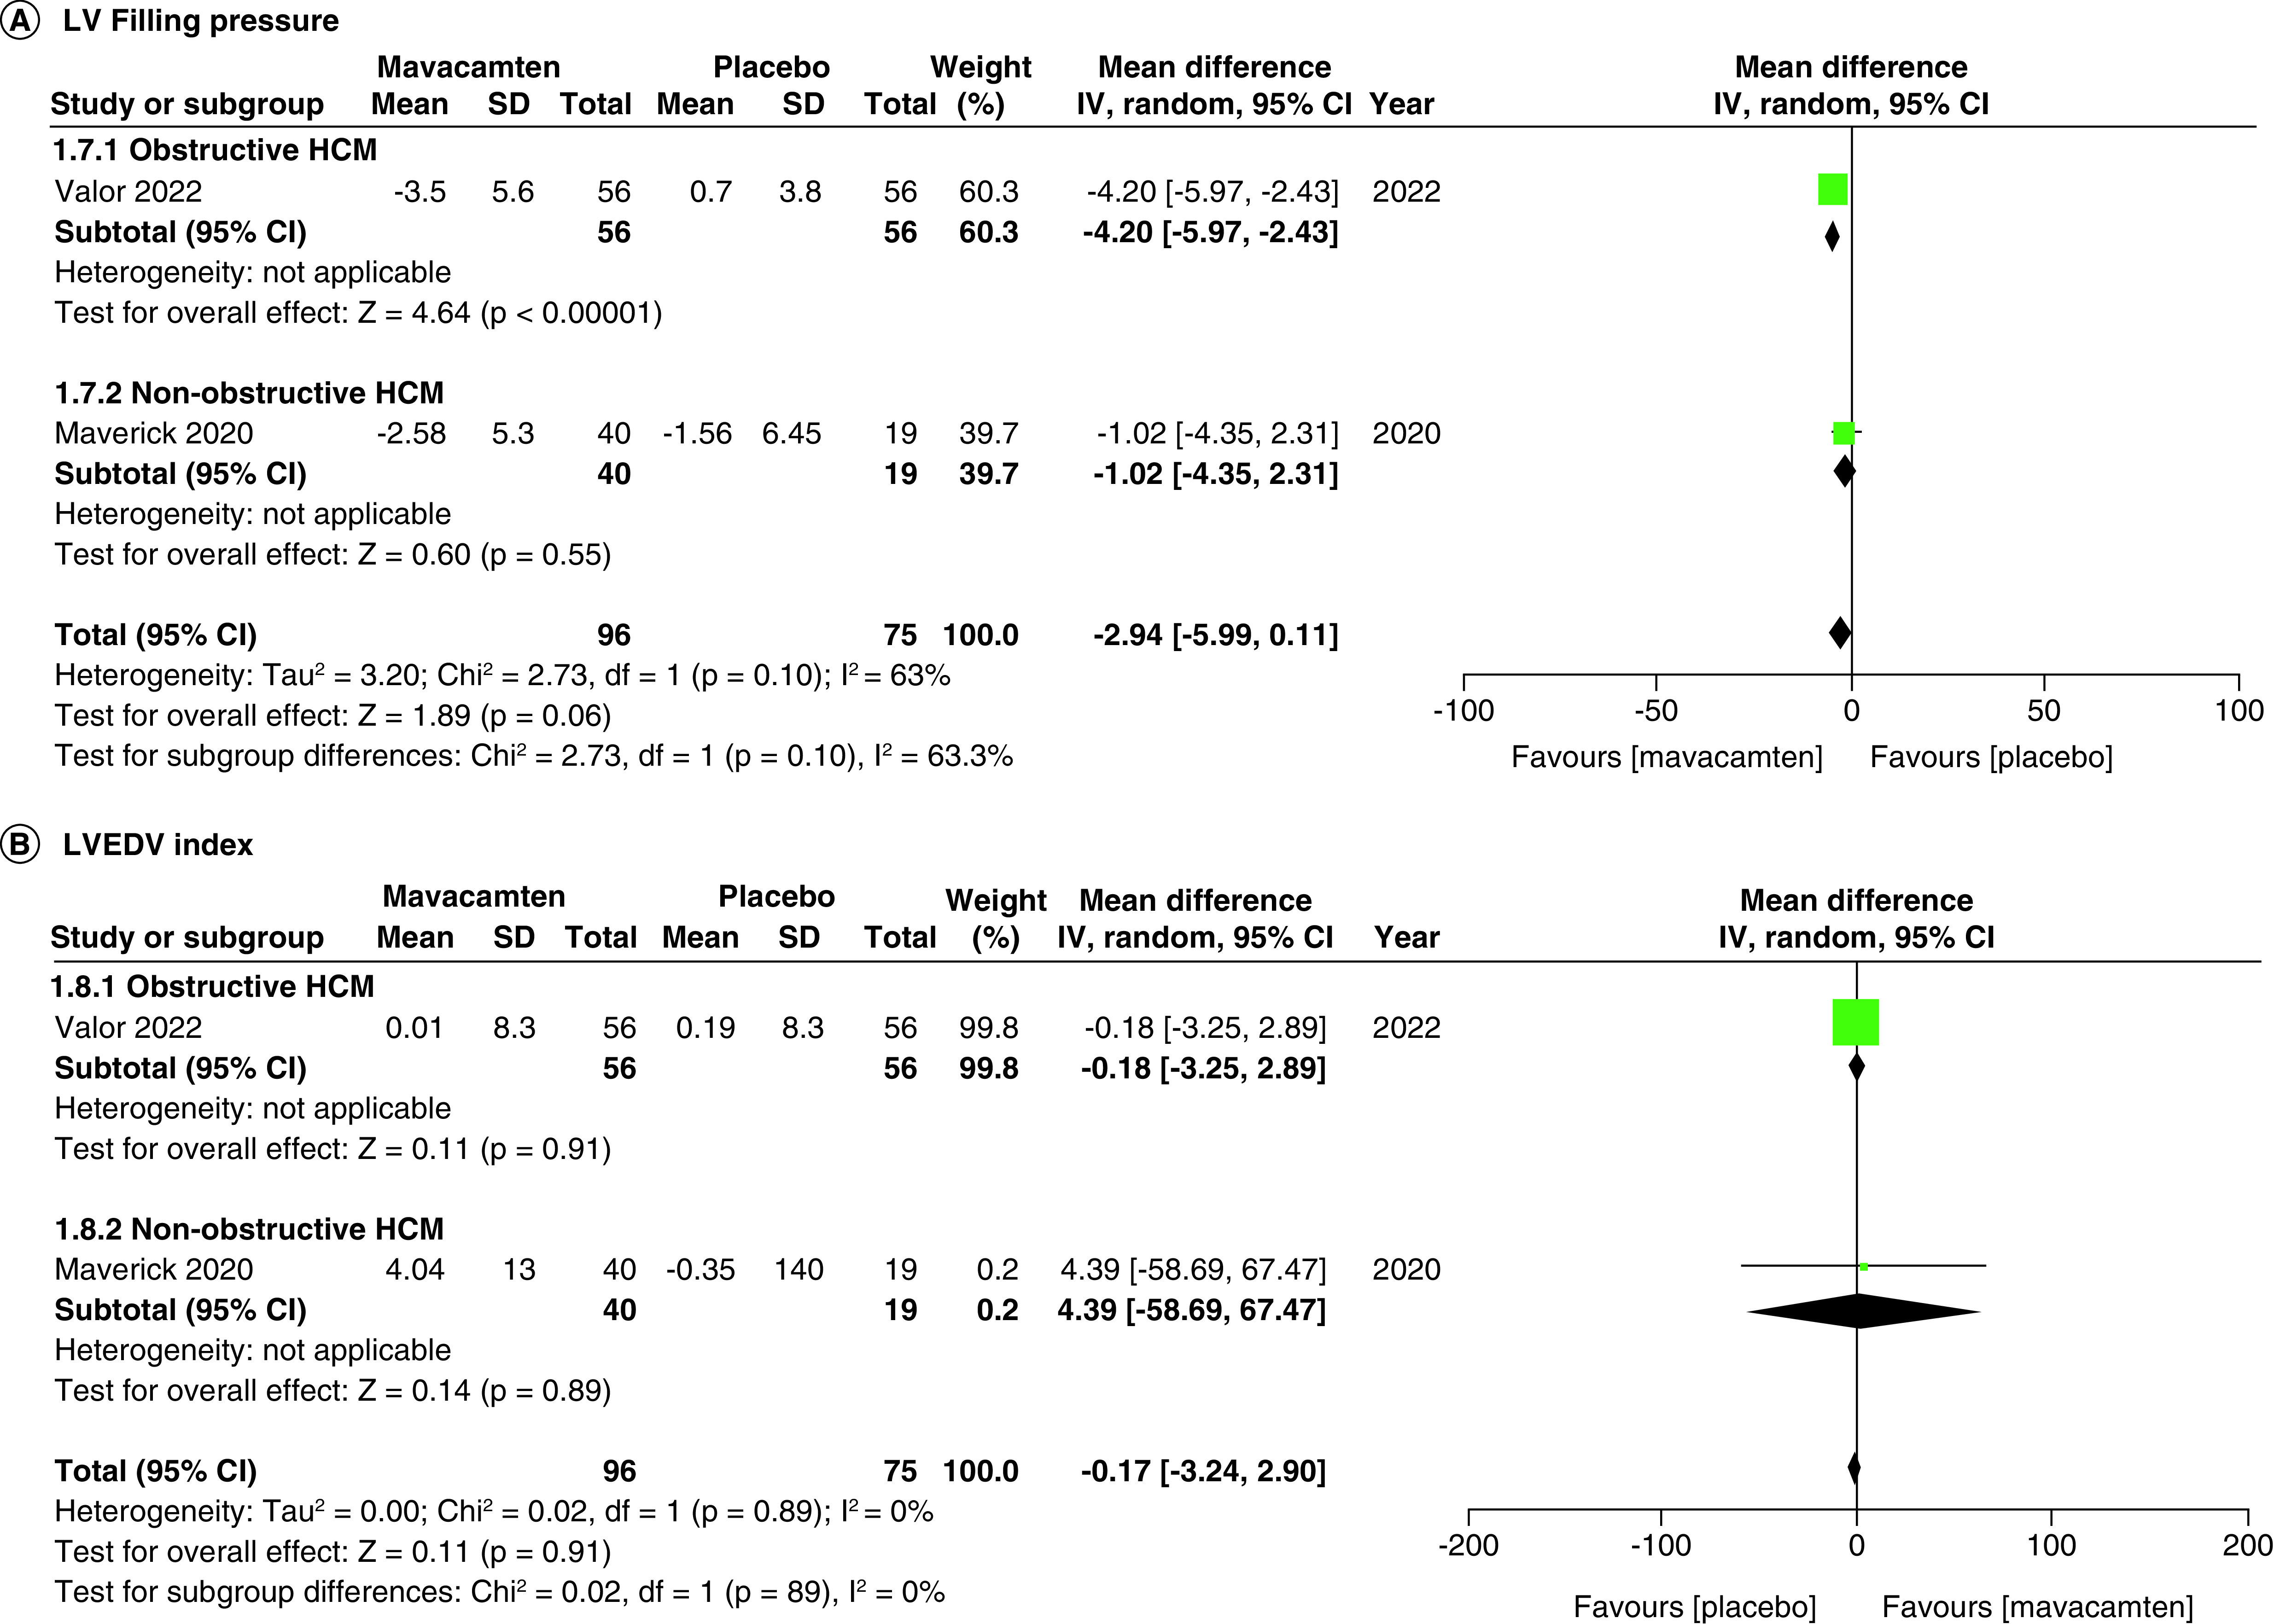
Figure 8. Forest plots of changes from baseline in left ventricular filling pressure and left ventricular end-diastolic volume index. (A) Refers to the changes from baseline in left ventricular filling pressure. (B) Refers to the changes from baseline in left ventricular end-diastolic volume index. CI: Confidence interval; HCM: Hypertrophic cardiomyopathy; SD: Standard deviation.
Figure 8. Forest plots of changes from baseline in left ventricular filling pressure and left ventricular end-diastolic volume index. (A) Refers to the changes from baseline in left ventricular filling pressure. (B) Refers to the changes from baseline in left ventricular end-diastolic volume index. CI: Confidence interval; HCM: Hypertrophic cardiomyopathy; SD: Standard deviation.CC BY · PubMed Central
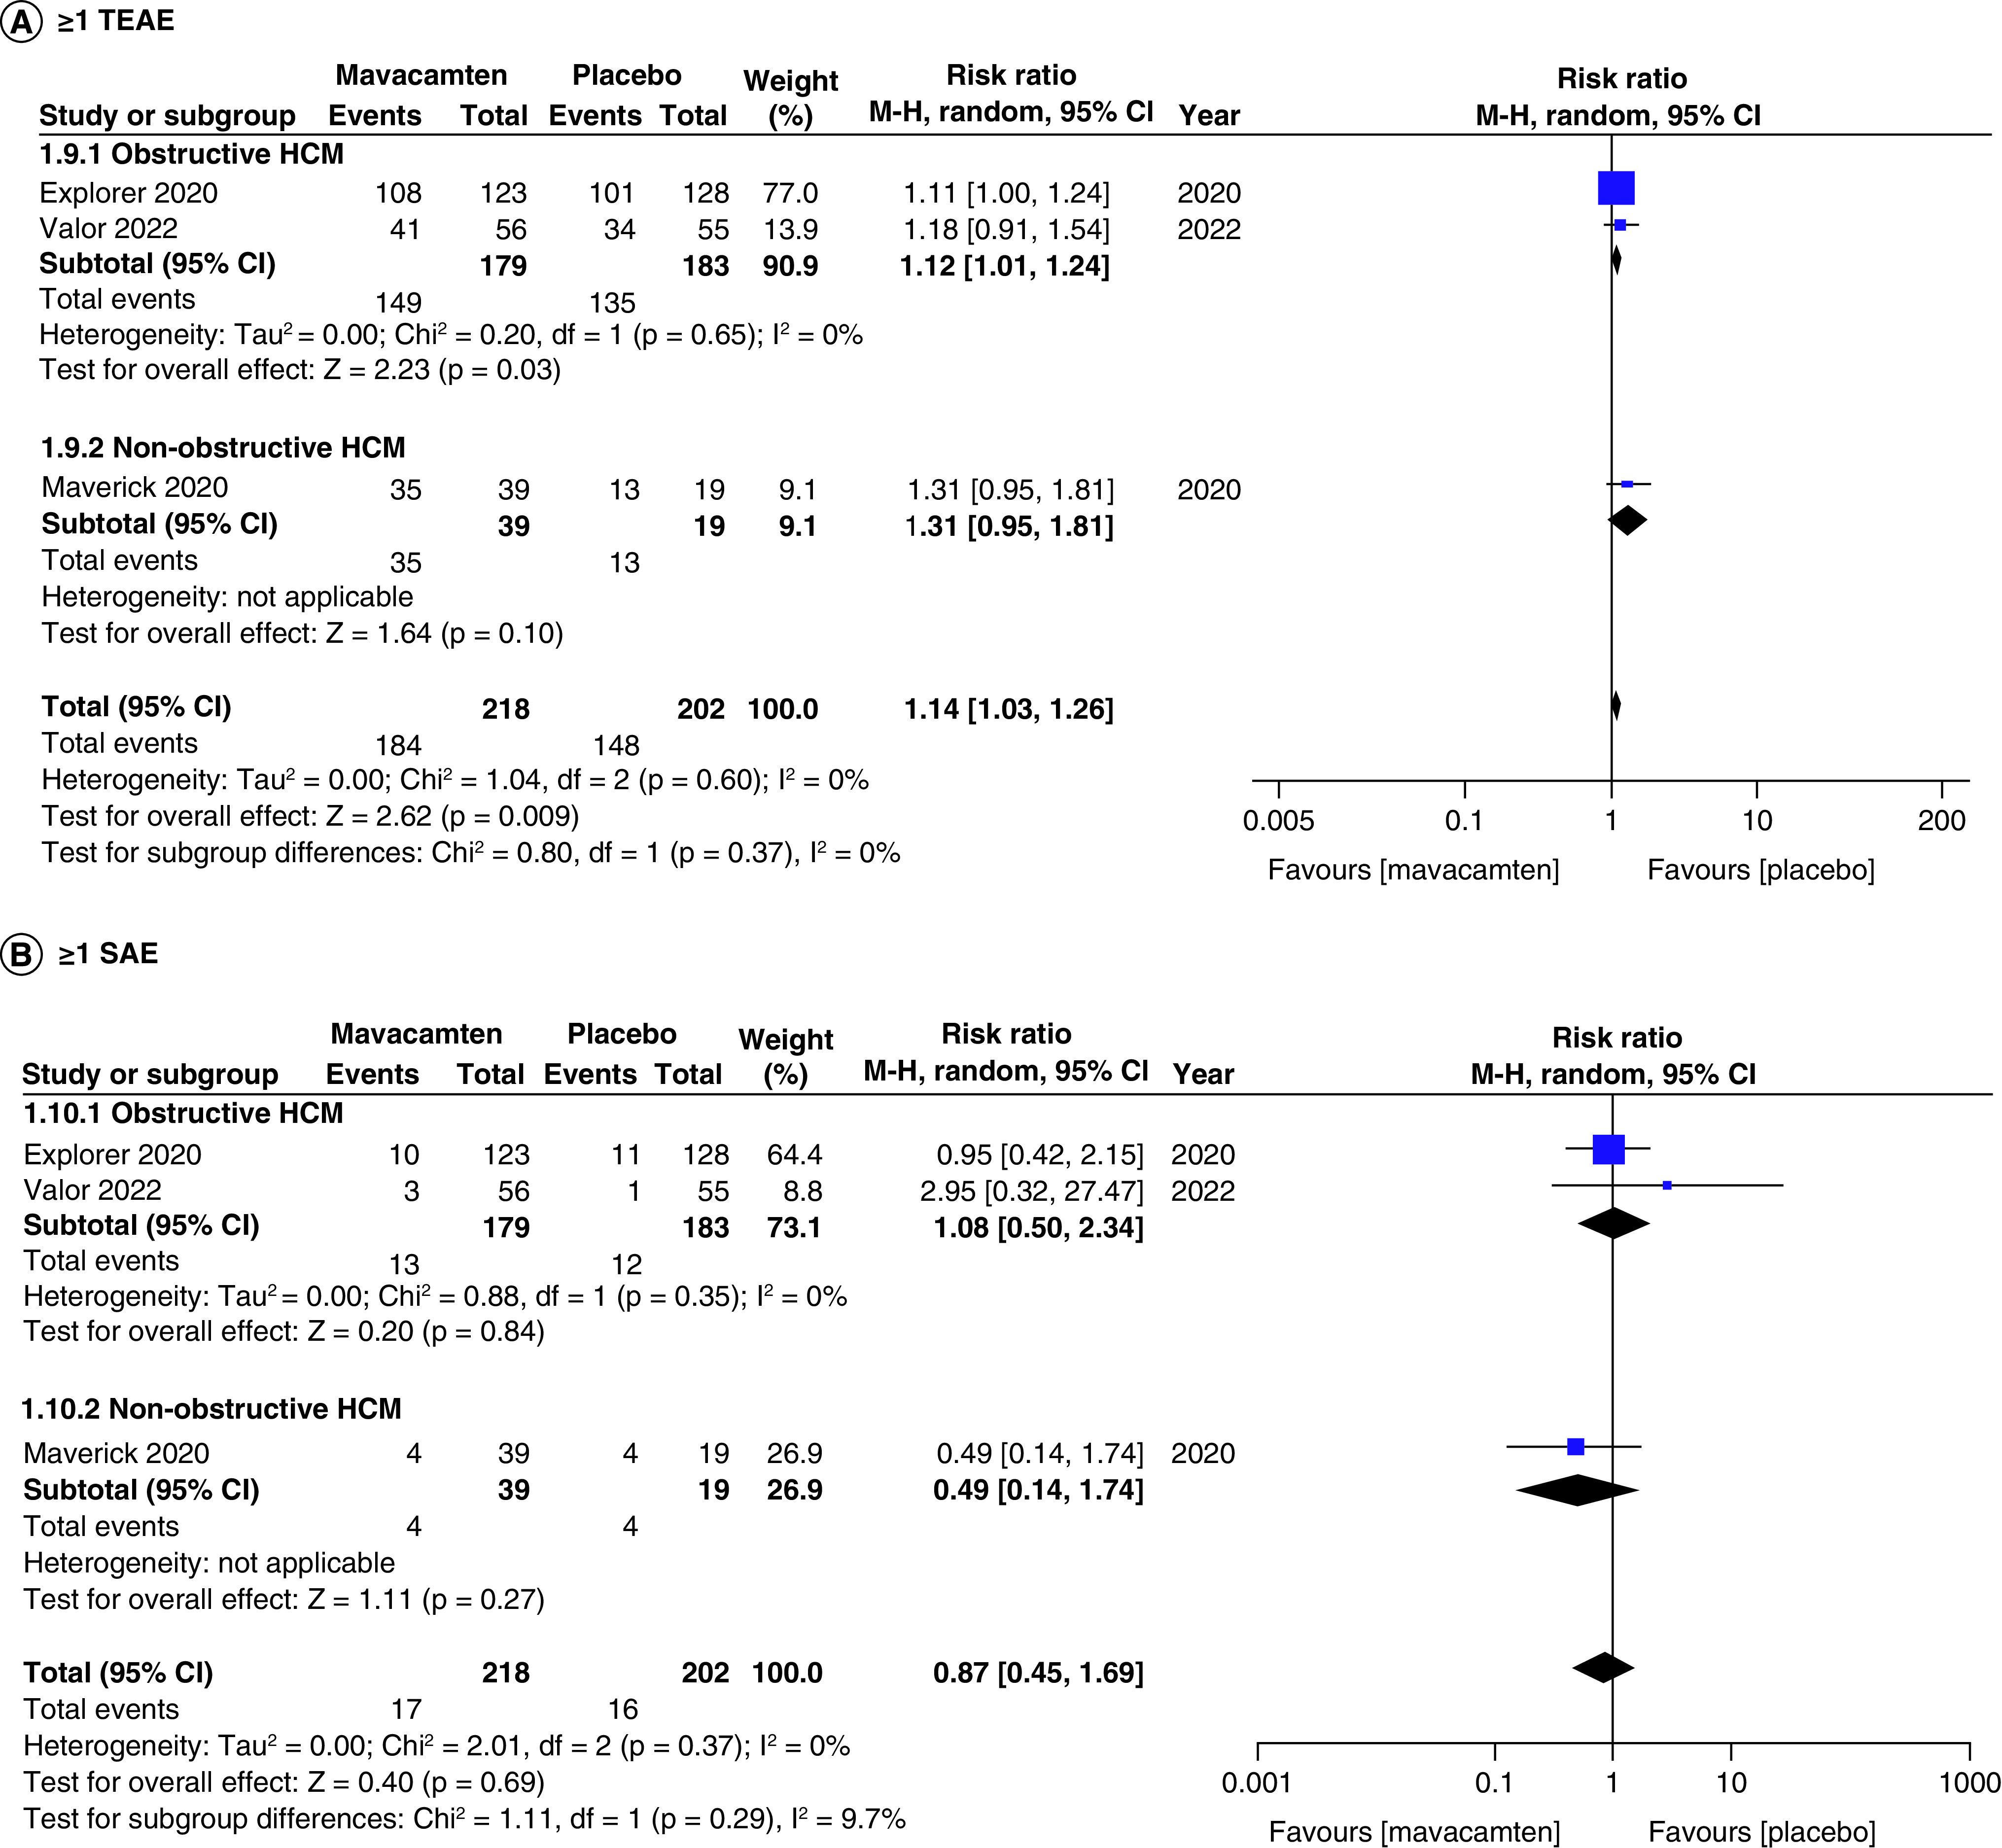
Figure 9. Forest plots of participants with ≥1 treatment-emergent adverse events and ≥1 severe adverse events. (A) Refers to incidence of ≥1 treatment-emergent adverse event. (B) Refers to incidence of ≥1 severe adverse event. CI: Confidence interval; HCM: Hypertrophic cardiomyopathy.
Figure 9. Forest plots of participants with ≥1 treatment-emergent adverse events and ≥1 severe adverse events. (A) Refers to incidence of ≥1 treatment-emergent adverse event. (B) Refers to incidence of ≥1 severe adverse event. CI: Confidence interval; HCM: Hypertrophic cardiomyopathy.CC BY · PubMed Central
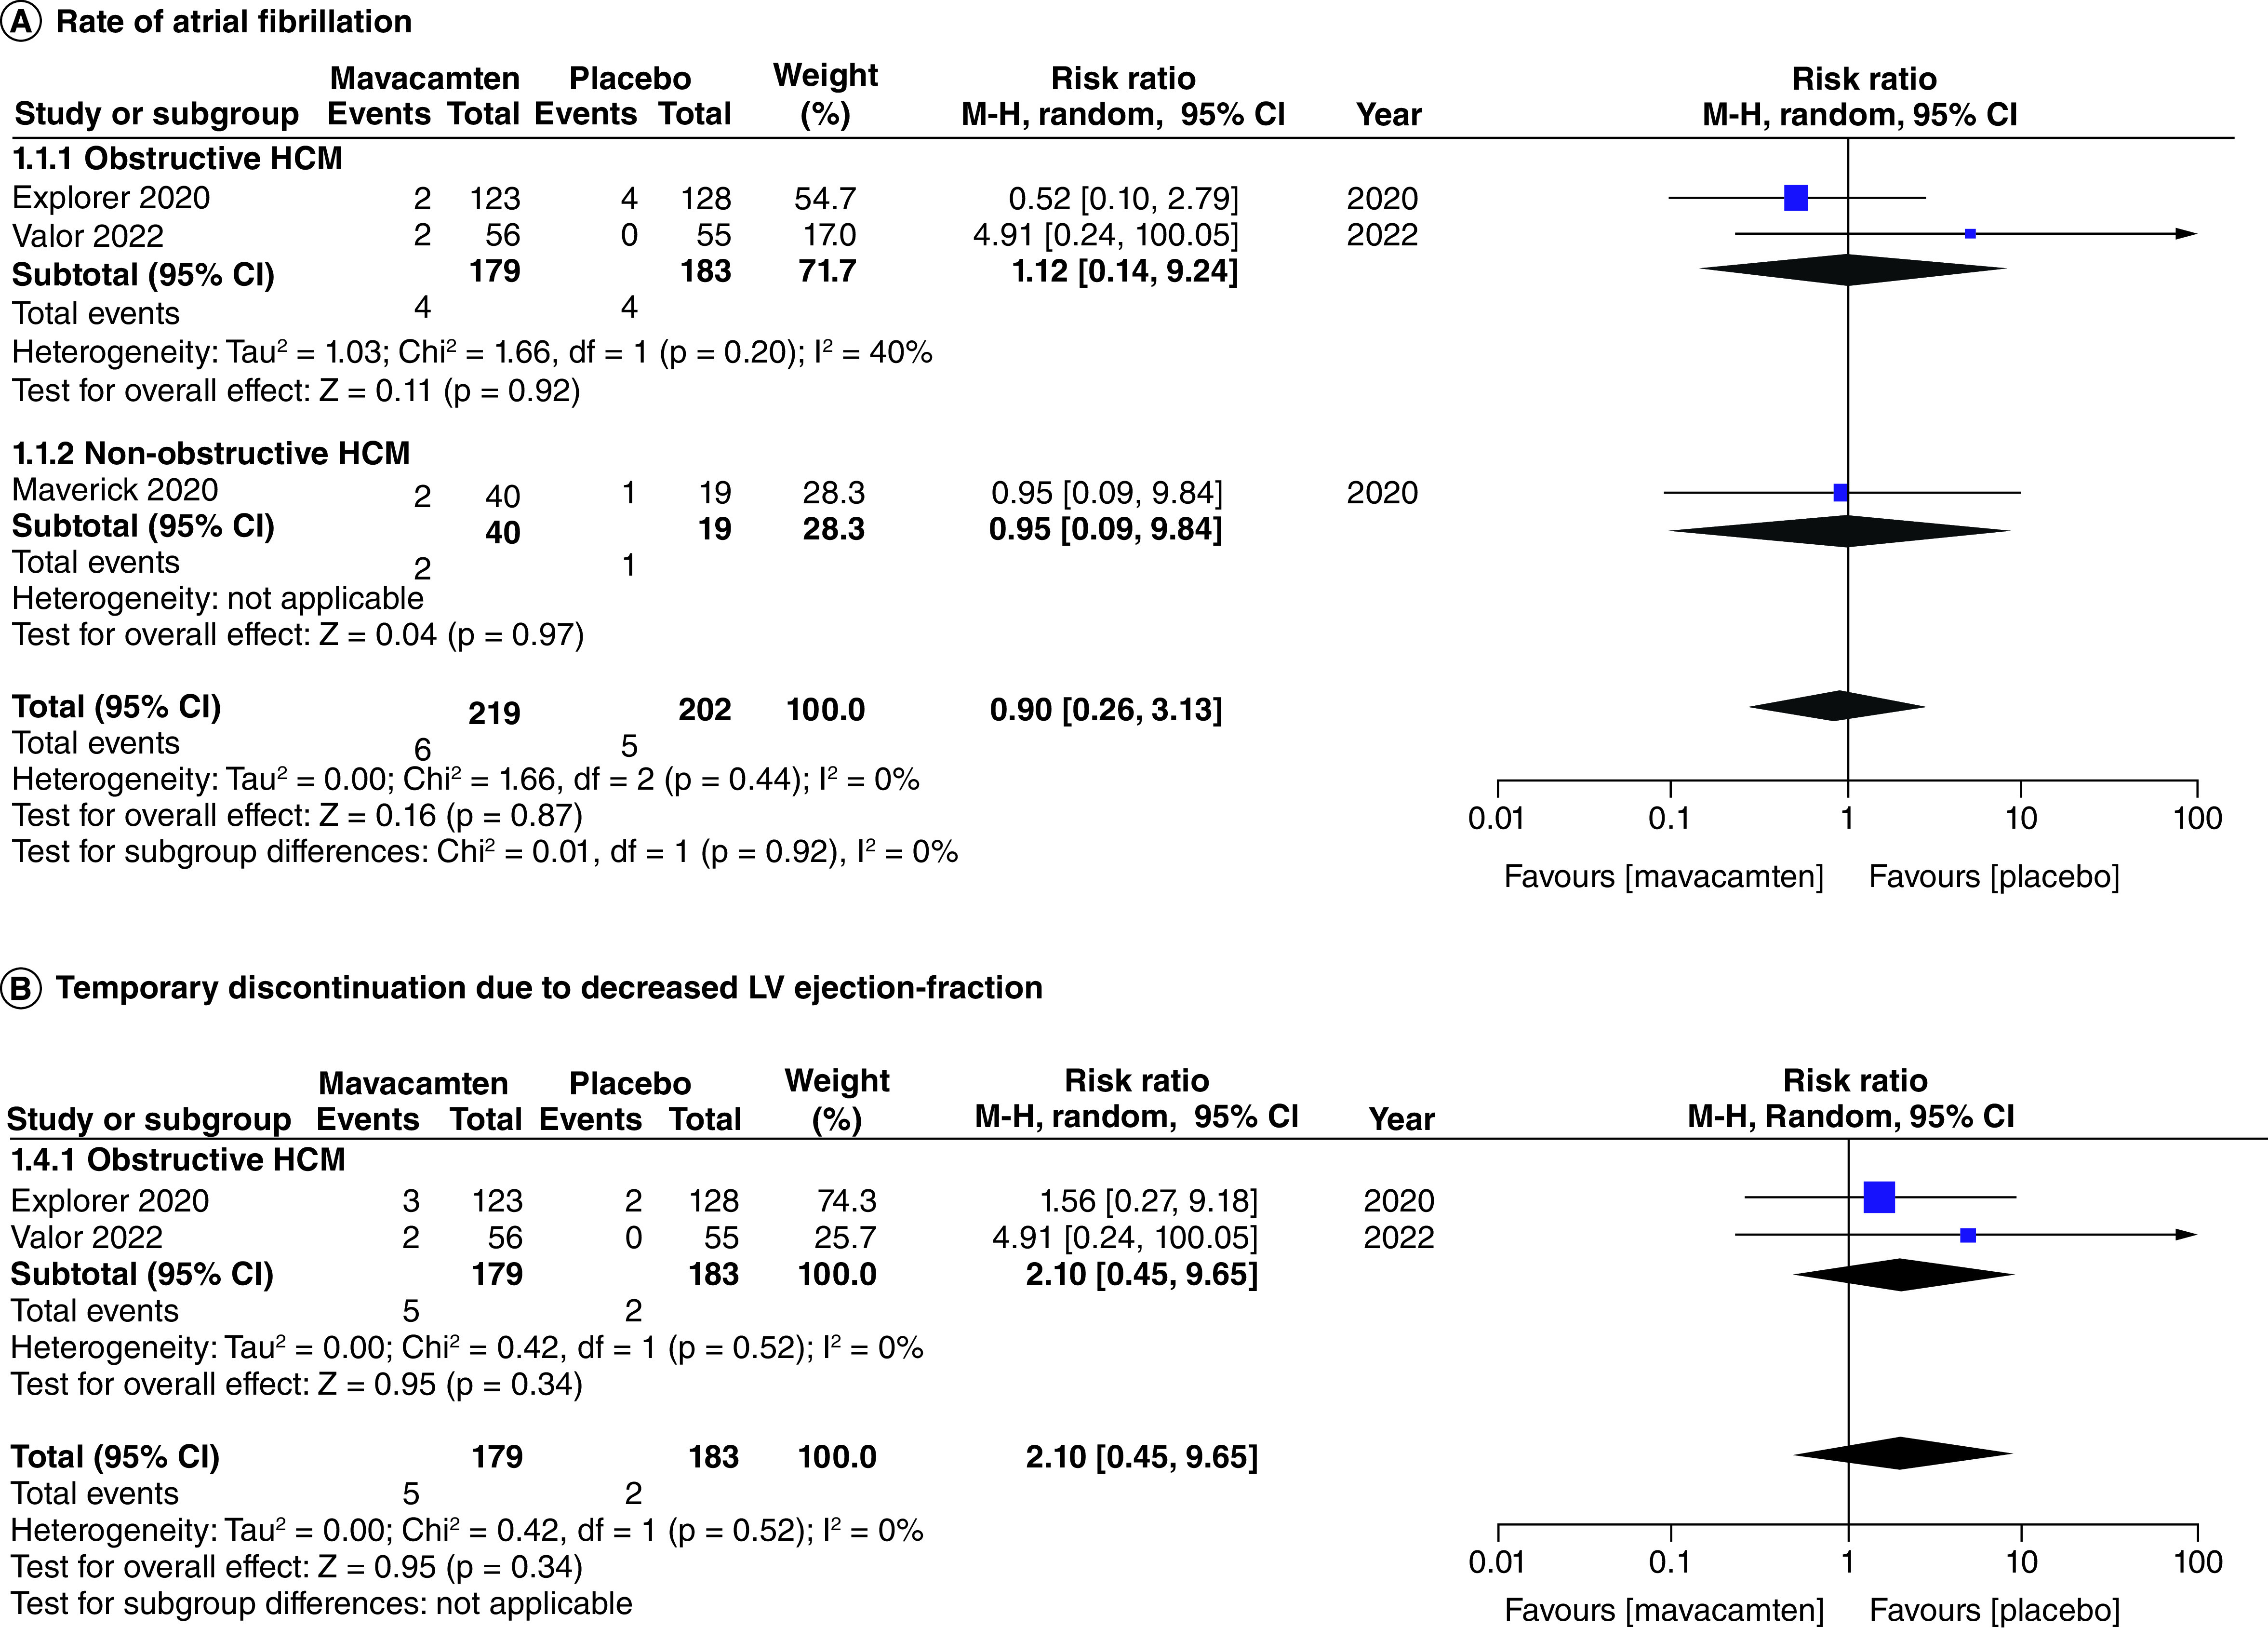
Figure 10. Forest plots of rate of atrial fibrillation and temporary discontinuation due to decreased left ventricular ejection-fraction. (A) Refers to the rate of atrial fibrillation. (B) Refers to the incidence of temporary discontinuation due to decreased left ventricular ejection-fraction. CI: Confidence interval; HCM: Hypertrophic cardiomyopathy.
Figure 10. Forest plots of rate of atrial fibrillation and temporary discontinuation due to decreased left ventricular ejection-fraction. (A) Refers to the rate of atrial fibrillation. (B) Refers to the incidence of temporary discontinuation due to decreased left ventricular ejection-fraction. CI: Confidence interval; HCM: Hypertrophic cardiomyopathy.CC BY · PubMed Central

Verification

Claims the paper makes

The claims and statistics of this paper haven’t been checked yet.

Run the check — free, no account needed. It reads the open-access text and checks the sources it cites.

A few free checks a day · papers already verified open instantly · results are public

Claims other papers make about this one

Each is checked against this paper’s own text: does it say what the citing paper says it does?

Self-check

Percentages, sums and reported differences re-computed from the paper’s own numbers.

The self-check needs the paper’s full text.

Citations

Cites

Show all 2 references

Research works printed but not linked: 16

  1. 10.1093/eurheartj/ehu284 · DOI · Paper page
  2. 10.1056/NEJMra1710575 · DOI · Paper page
  3. 10.1161/CIRCULATIONAHA.107.716886 · DOI
  4. 10.1016/j.aogh.2013.12.004 · DOI
  5. 10.1161/CIRCRESAHA.116.309348 · DOI
  6. 10.1371/journal.pone.0168407 · DOI
  7. 10.1074/jbc.M117.776815 · DOI
  8. 10.1016/j.jacc.2020.03.064 · DOI
  9. 10.1016/S0140-6736(20)31792-X · DOI · Paper page
  10. 10.1016/j.jacc.2022.04.048 · DOI
  11. 10.1136/bmj.j4008 · DOI · Paper page
  12. 10.1136/bmj.d5928 · DOI · Paper page
  13. 10.1016/j.cpcardiol.2022.101429 · DOI
  14. 10.1186/s43044-023-00328-7 · DOI
  15. 10.17925/HI.2022.16.2.91 · DOI
  16. 10.47391/JPMA.7258 · DOI

Cited by

Sorted by citations

Metadata

Authors
Memon, A., Larik, M. O., Khan, Z., Urooj, M., Irfan, A., Kumari, B., Faisal, M., Siddiqui, R., Tehrim, M., & Hameed, I.
Venue
Future Science OA
Published
2023-09-19
Volume
9
Issue
10
ISSN
2056-5623
Cited by
14
References
2
Language
en

About these checks

Registry, retraction, Cites and statistics results are computed, not judged, with one exception: a printed reference that no index lists is read once by a model before it counts as a citation error. Claims are extracted by a model and kept only when their quote appears verbatim in the text; each cited source is then checked, with a model’s help, for whether it says what the claim relies on. Those verdicts can be wrong — read the claim’s quote and the cited source before relying on one.

Statistics and arithmetic are recomputed, not judged.

Confidence bands are shown only for fields calibrated on our annotated test set. None is calibrated yet, so no band is shown.

What counts as a claim ›How we measure confidence ›How we check this ›

Are you an author, or do you see a problem with this page? Request a review