Cited by 14

The DOI matches its Crossref record; 3 of the 3 references it cites were found in a registry or an index.

Up-Regulation of miR-9-5p Inhibits Hypoxia-Ischemia Brain Damage Through the DDIT4-Mediated Autophagy Pathways in Neonatal Mice

Gai, Chengcheng, Xing, Xiaohui, Song, Yan, Zhao, Yijing, Jiang, Zige, Cheng, Yahong, Xiao, Yilei, Wang, Zhen·2023·Drug Design, Development and Therapy

Overview

The claims and statistics of this paper haven’t been checked yet.

Run the check — free, no account needed. It reads the open-access text and checks the sources it cites.

A few free checks a day · papers already verified open instantly · results are public

Integrity signals

Registry

Crossref · 10.2147/dddt.s393362

Cites

3 of 3 references verified0 citation errors · 0 not checkable

Statistics

Figures

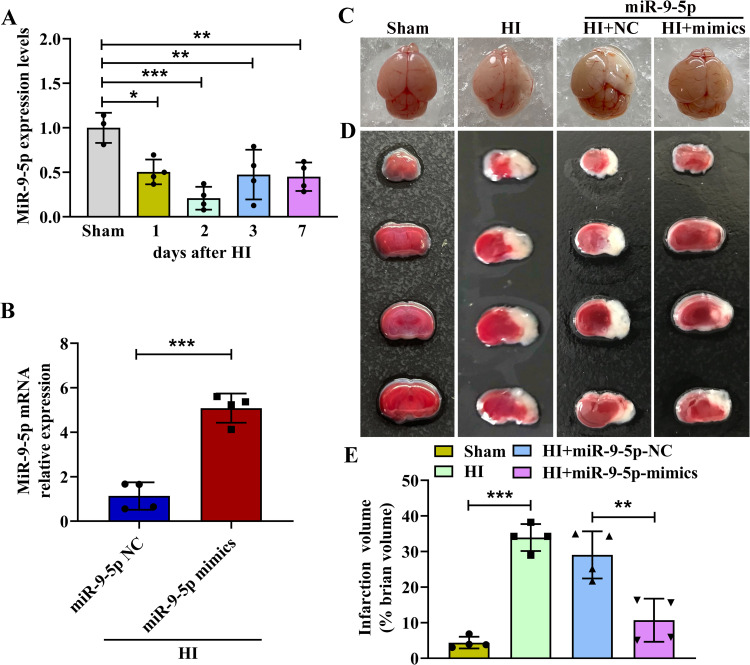
Figure 1 MiR-9-5p expression was decreased post HI and overexpression of miR-9-5p could ameliorate brain injury. (A) The expression levels of miR-9-5p mRNA were detected by qRT-PCR at 0 to 7 days after HI injury. (B) The expression levels of miR-9-5p mRNA were measured after HI with miR-9-5p mimics treatment. (C and D) Representative pictures of the brain and TTC staining of the brain. (E) Quantification of brain infarct area in each group. The data were presented as mean ± SD, *p < 0.05, **p < 0.01, ***p < 0.001 according to One-way ANOVA with Dunnett corrections in (A); ***p < 0.001 according to t-test in (B); **p < 0.01, ***p < 0.001 according to One-way ANOVA with Bonferroni corrections in (E).
Figure 1 MiR-9-5p expression was decreased post HI and overexpression of miR-9-5p could ameliorate brain injury. (A) The expression levels of miR-9-5p mRNA were detected by qRT-PCR at 0 to 7 days after HI injury. (B) The expression levels of miR-9-5p mRNA were measured after HI with miR-9-5p mimics treatment. (C and D) Representative pictures of the brain and TTC staining of the brain. (E) Quantification of brain infarct area in each group. The data were presented as mean ± SD, *p < 0.05, **p < 0.01, ***p < 0.001 according to One-way ANOVA with Dunnett corrections in (A); ***p < 0.001 according to t-test in (B); **p < 0.01, ***p < 0.001 according to One-way ANOVA with Bonferroni corrections in (E).CC BY-NC · PubMed Central
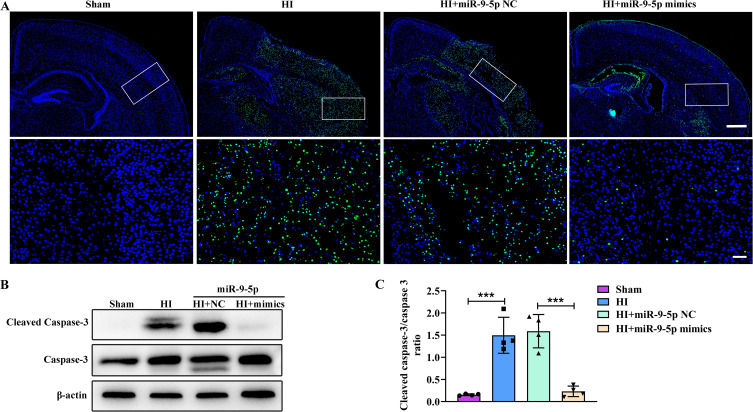
Figure 2 MiR-9-5p alleviated apoptosis after HI injury. (A) TUNEL assay to detect apoptotic in Sham group, HI group, HI+miR-9-5p NC group and HI+miR-9-5p mimics group. Scale bar: 400 μm. Magnified views of boxed regions scale bar: 50 μm. (B and C) The expression levels of cleaved caspase-3 and caspase-3 protein were analyzed by Western blotting. The data were presented as mean ± SD, ***p < 0.001 according to One-way ANOVA with Bonferroni corrections in (C).
Figure 2 MiR-9-5p alleviated apoptosis after HI injury. (A) TUNEL assay to detect apoptotic in Sham group, HI group, HI+miR-9-5p NC group and HI+miR-9-5p mimics group. Scale bar: 400 μm. Magnified views of boxed regions scale bar: 50 μm. (B and C) The expression levels of cleaved caspase-3 and caspase-3 protein were analyzed by Western blotting. The data were presented as mean ± SD, ***p < 0.001 according to One-way ANOVA with Bonferroni corrections in (C).CC BY-NC · PubMed Central
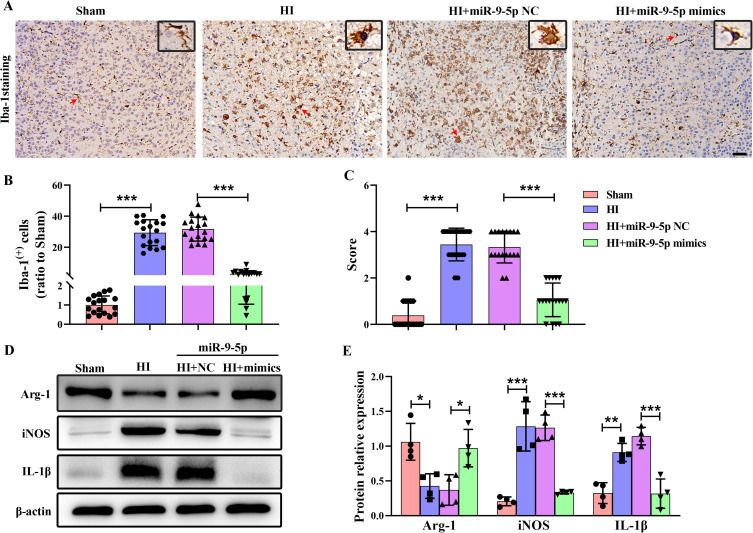
Figure 3 MiR-9-5p inhibited inflammatory activation after HI injury. (A) Representative images of Iba-1 immunohistochemical staining at 2 days following HI insult. Scale bar: 50 μm. Red arrow: microglia/macrophages. Magnified views of black box regions in A shows morphology of microglia/macrophages indicated by red arrow. (B) Quantification of Iba-1+ cells in the Sham group, HI group, HI+miR-9-5p NC group and HI+miR-9-5p mimics group. (C) Quantitative analysis of the effect of miR-9-5p on microglia/macrophage activation scores. (D and E) Western blotting was detected protein expression levels of iNOS, IL-1β and Arg-1 at 2 days post HI. The data were presented as mean ± SD, *p < 0.05, **p < 0.01, ***p < 0.001 according to One-way ANOVA with Bonferroni corrections in (B, C and E).
Figure 3 MiR-9-5p inhibited inflammatory activation after HI injury. (A) Representative images of Iba-1 immunohistochemical staining at 2 days following HI insult. Scale bar: 50 μm. Red arrow: microglia/macrophages. Magnified views of black box regions in A shows morphology of microglia/macrophages indicated by red arrow. (B) Quantification of Iba-1+ cells in the Sham group, HI group, HI+miR-9-5p NC group and HI+miR-9-5p mimics group. (C) Quantitative analysis of the effect of miR-9-5p on microglia/macrophage activation scores. (D and E) Western blotting was detected protein expression levels of iNOS, IL-1β and Arg-1 at 2 days post HI. The data were presented as mean ± SD, *p < 0.05, **p < 0.01, ***p < 0.001 according to One-way ANOVA with Bonferroni corrections in (B, C and E).CC BY-NC · PubMed Central
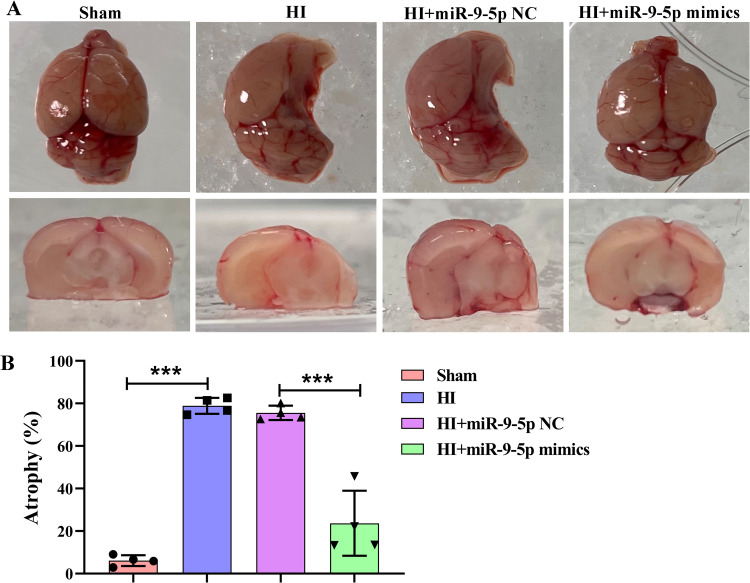
Figure 4 The effect of miR-9-5p on brain atrophy at 28 days after HI. (A) Representative images of brain atrophy at 28 days after HI insults. (B) Quantitative analysis of brain atrophy area in Sham group, HI group, HI+miR-9-5p NC group and HI+miR-9-5p mimics group. The data were presented as mean ± SD, ***p < 0.001 according to One-way ANOVA with Bonferroni corrections in (B).
Figure 4 The effect of miR-9-5p on brain atrophy at 28 days after HI. (A) Representative images of brain atrophy at 28 days after HI insults. (B) Quantitative analysis of brain atrophy area in Sham group, HI group, HI+miR-9-5p NC group and HI+miR-9-5p mimics group. The data were presented as mean ± SD, ***p < 0.001 according to One-way ANOVA with Bonferroni corrections in (B).CC BY-NC · PubMed Central
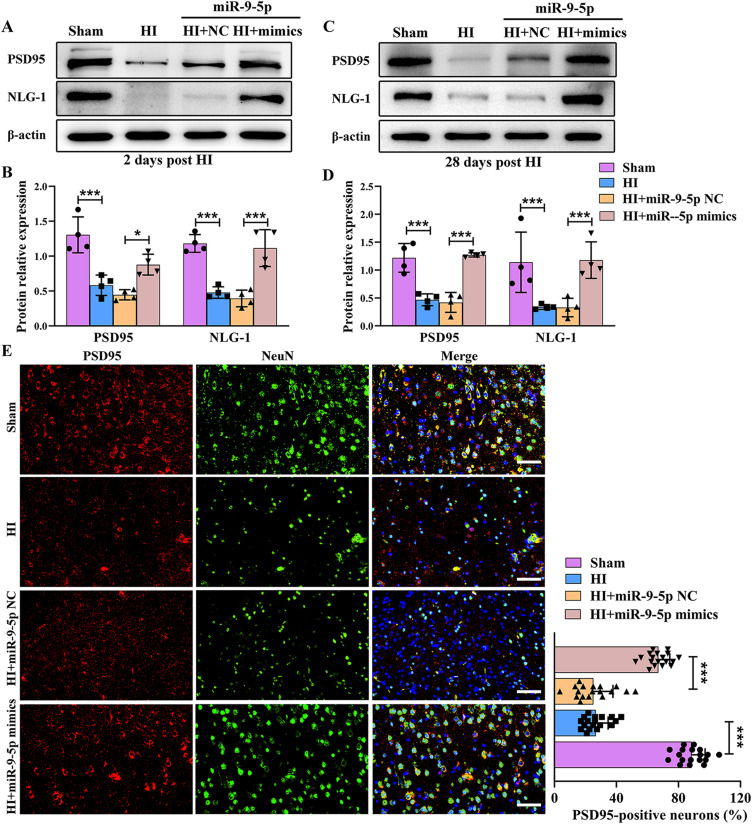
Figure 5 MiR-9-5p up-regulated HI injury-induced down-regulation of synapse-associated protein expression. (A and B) Western blotting analysis and quantitative measurement were used to monitor protein expression levels of PSD95 and NLG-1 at 2 days post HI. (C and D) Western blotting analysis and quantitative measurement were used to examine protein expression levels of PSD95 and NLG-1 at 28 days post HI. (E) Double immunofluorescence analysis was performed with PSD95 and NeuN in Sham group, HI group, HI+miR-9-5p NC group and HI+miR-9-5p mimics group at 28 days post HI. Scale bar: 50 μm. The data were presented as mean ± SD, *p < 0.05, ***p < 0.001 according to One-way ANOVA with Bonferroni corrections in B, D and E.
Figure 5 MiR-9-5p up-regulated HI injury-induced down-regulation of synapse-associated protein expression. (A and B) Western blotting analysis and quantitative measurement were used to monitor protein expression levels of PSD95 and NLG-1 at 2 days post HI. (C and D) Western blotting analysis and quantitative measurement were used to examine protein expression levels of PSD95 and NLG-1 at 28 days post HI. (E) Double immunofluorescence analysis was performed with PSD95 and NeuN in Sham group, HI group, HI+miR-9-5p NC group and HI+miR-9-5p mimics group at 28 days post HI. Scale bar: 50 μm. The data were presented as mean ± SD, *p < 0.05, ***p < 0.001 according to One-way ANOVA with Bonferroni corrections in B, D and E.CC BY-NC · PubMed Central
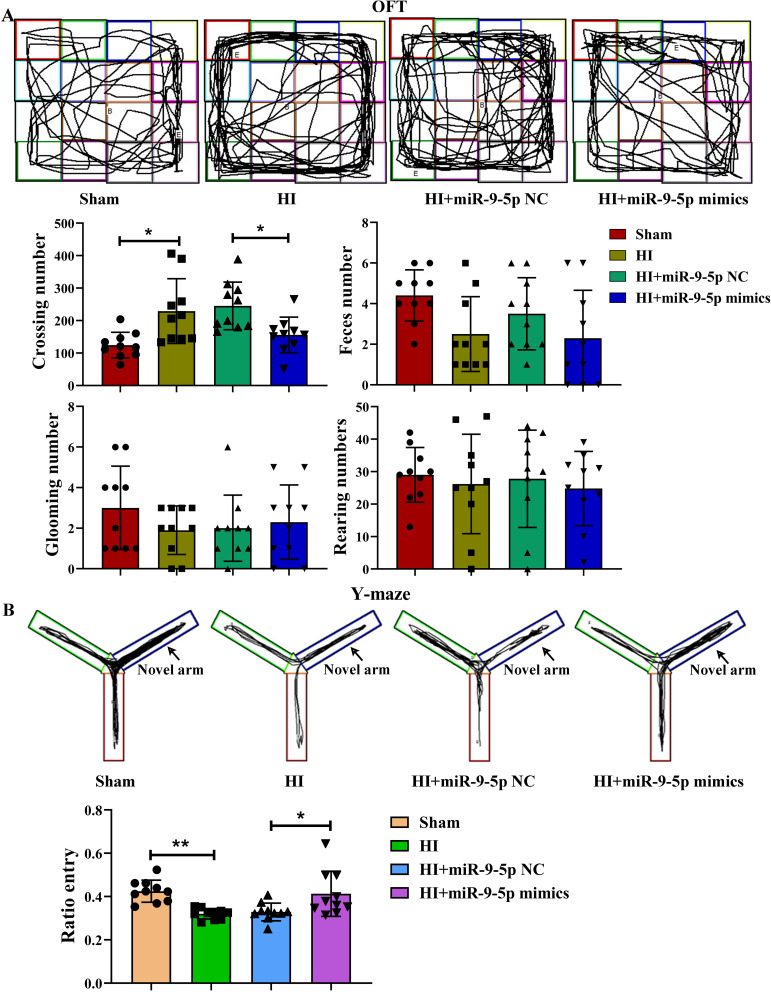
Figure 6 Effects of miR-9-5p t on long-term neurological function post HI. (A) The number of crossing, feces, glooming and rearing in the open field test at 28 days post HI. (B) Representative occupancy plots shown the activity track of mice during the Y maze test and the frequency of entries into the novel arm of the Y maze. The data were presented as mean ± SD, *p < 0.05, **p < 0.01 according to One-way ANOVA with Bonferroni corrections in A and B.
Figure 6 Effects of miR-9-5p t on long-term neurological function post HI. (A) The number of crossing, feces, glooming and rearing in the open field test at 28 days post HI. (B) Representative occupancy plots shown the activity track of mice during the Y maze test and the frequency of entries into the novel arm of the Y maze. The data were presented as mean ± SD, *p < 0.05, **p < 0.01 according to One-way ANOVA with Bonferroni corrections in A and B.CC BY-NC · PubMed Central
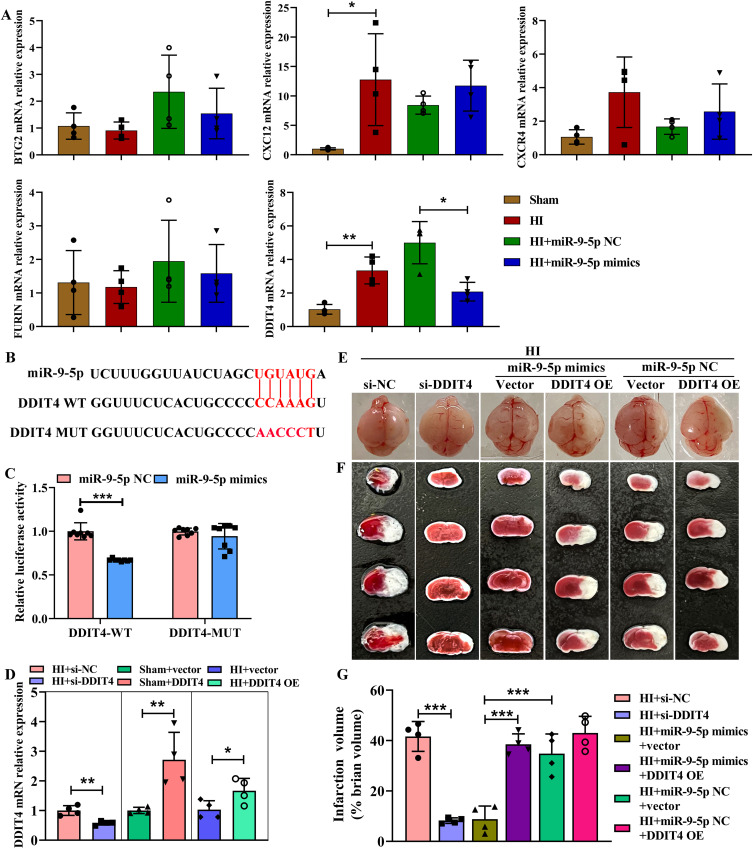
Figure 7 Downregulation of DDIT4 expression alleviates brain injury. (A) Different downstream targets (BTG2, FURIN, CXCL12, CXCR4 and DDIT4) mRNA levels of miR-9-5p were detected by qRT-PCR. (B and C) Luciferase activity was measured in HEK293T cells transfected with DDIT4-Mut, DDIT4-WT, miR-9-5p NC and miR-9-5p mimics. (D) The DDIT4 mRNA level was detected after transfection with si-DDIT4, si-NC, vector, or DDIT4 overexpression (OE). (E) Representative brain pictures at 2 days following HI in each group treated with si-NC, si-DDIT4, miR-9-5p mimics+vector and miR-9-5p mimics+DDIT4 OE, miR-9-5p NC+vector and miR-9-5p NC+DDIT4 OE. (F) Example of images of TTC staining at 2 days following HI treated with si-NC, si-DDIT4, miR-9-5p mimics+vector and miR-9-5p mimics+DDIT4 OE, miR-9-5p NC+vector and miR-9-5p NC+DDIT4 OE. (G) Quantification of brain infarct area at 2 days following HI treated with si-NC, si-DDIT4, miR-9-5p mimics+vector and miR-9-5p mimics+DDIT4 OE, miR-9-5p NC+DDIT4 vector and miR-9-5p NC+DDIT4 OE. The data were presented as mean ± SD, **p < 0.01, *p < 0.05, ***p < 0.001 according to One-way ANOVA with Bonferroni corrections in (A, C and G); *p < 0.05, **p < 0.01 according to t-test in (D).
Figure 7 Downregulation of DDIT4 expression alleviates brain injury. (A) Different downstream targets (BTG2, FURIN, CXCL12, CXCR4 and DDIT4) mRNA levels of miR-9-5p were detected by qRT-PCR. (B and C) Luciferase activity was measured in HEK293T cells transfected with DDIT4-Mut, DDIT4-WT, miR-9-5p NC and miR-9-5p mimics. (D) The DDIT4 mRNA level was detected after transfection with si-DDIT4, si-NC, vector, or DDIT4 overexpression (OE). (E) Representative brain pictures at 2 days following HI in each group treated with si-NC, si-DDIT4, miR-9-5p mimics+vector and miR-9-5p mimics+DDIT4 OE, miR-9-5p NC+vector and miR-9-5p NC+DDIT4 OE. (F) Example of images of TTC staining at 2 days following HI treated with si-NC, si-DDIT4, miR-9-5p mimics+vector and miR-9-5p mimics+DDIT4 OE, miR-9-5p NC+vector and miR-9-5p NC+DDIT4 OE. (G) Quantification of brain infarct area at 2 days following HI treated with si-NC, si-DDIT4, miR-9-5p mimics+vector and miR-9-5p mimics+DDIT4 OE, miR-9-5p NC+DDIT4 vector and miR-9-5p NC+DDIT4 OE. The data were presented as mean ± SD, **p < 0.01, *p < 0.05, ***p < 0.001 according to One-way ANOVA with Bonferroni corrections in (A, C and G); *p < 0.05, **p < 0.01 according to t-test in (D).CC BY-NC · PubMed Central
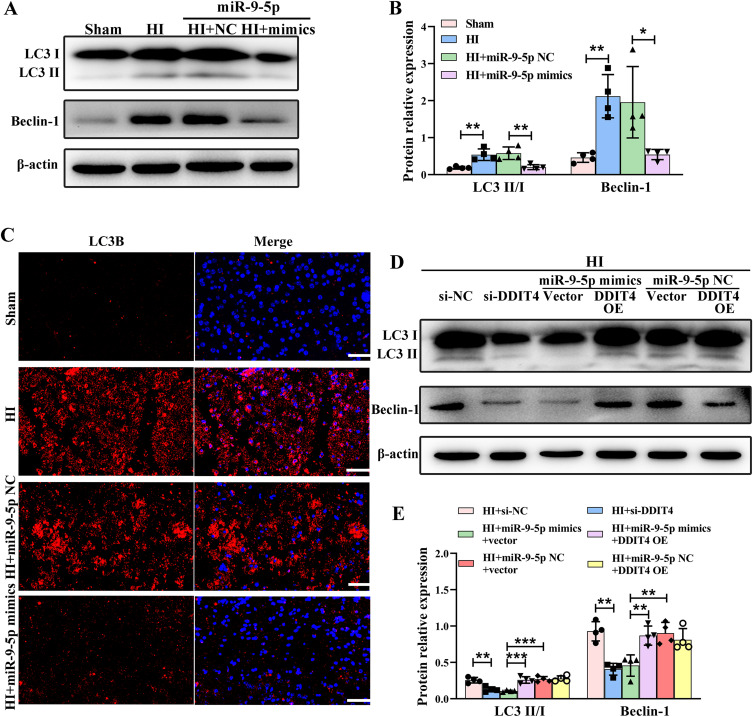
Figure 8 Excessive autophagy after HI injury was reversed by overexpression of miR-9-5p. (A and B) The protein expression levels of LC3 II/LC3 I and Beclin-1 in Sham group, HI group, HI+miR-9-5p NC group and HI+miR-9-5p mimics group were determined at 2 days post HI by Western blotting. (C) Immunofluorescence staining of LC3B in Sham group, HI group, HI+miR-9-5p NC group and HI+miR-9-5p mimics group was determined at 2 days post HI. Scale bar: 50 μm. (D and E) The protein expression levels of LC3 II/LC3 I and Beclin-1 in ipsilateral cortex following treated with si-NC, si-DDIT4, miR-9-5p mimics+vector and miR-9-5p mimics+DDIT4 OE, miR-9-5p NC+DDIT4 and miR-9-5p NC+DDIT4 OE were detected at 2 days post-HI. The data were presented as mean ± SD, *p < 0.05, **p < 0.01, ***p < 0.001 according to One-way ANOVA with Bonferroni corrections in (B and E).
Figure 8 Excessive autophagy after HI injury was reversed by overexpression of miR-9-5p. (A and B) The protein expression levels of LC3 II/LC3 I and Beclin-1 in Sham group, HI group, HI+miR-9-5p NC group and HI+miR-9-5p mimics group were determined at 2 days post HI by Western blotting. (C) Immunofluorescence staining of LC3B in Sham group, HI group, HI+miR-9-5p NC group and HI+miR-9-5p mimics group was determined at 2 days post HI. Scale bar: 50 μm. (D and E) The protein expression levels of LC3 II/LC3 I and Beclin-1 in ipsilateral cortex following treated with si-NC, si-DDIT4, miR-9-5p mimics+vector and miR-9-5p mimics+DDIT4 OE, miR-9-5p NC+DDIT4 and miR-9-5p NC+DDIT4 OE were detected at 2 days post-HI. The data were presented as mean ± SD, *p < 0.05, **p < 0.01, ***p < 0.001 according to One-way ANOVA with Bonferroni corrections in (B and E).CC BY-NC · PubMed Central

Verification

Claims the paper makes

The claims and statistics of this paper haven’t been checked yet.

Run the check — free, no account needed. It reads the open-access text and checks the sources it cites.

A few free checks a day · papers already verified open instantly · results are public

Claims other papers make about this one

Each is checked against this paper’s own text: does it say what the citing paper says it does?

Self-check

Percentages, sums and reported differences re-computed from the paper’s own numbers.

The self-check needs the paper’s full text.

Citations

Cites

Show all 3 references

Research works printed but not linked: 44

  1. Douglas-Escobar, 2015, JAMA Pediatr, 169, 397, 10.1001/jamapediatrics.2014.3269 · DOI · Paper page
  2. Ziemka-Nalecz, 2017, J Neuropathol Exp Neurol, 76, 644, 10.1093/jnen/nlx046 · DOI
  3. Zhou, 2020, Dev Med Child Neurol, 62, 1131, 10.1111/dmcn.14610 · DOI
  4. Guo, 2014, Biomed Res Int, 2014, 907420, 10.1155/2014/907420 · DOI
  5. Makeyev, 2008, Science, 319, 1789, 10.1126/science.1152326 · DOI
  6. Lai, 2020, J Neuroinflammation, 17, 74, 10.1186/s12974-020-01745-0 · DOI · Paper page
  7. Chen, 2020, Front Immunol, 11, 421, 10.3389/fimmu.2020.00421 · DOI
  8. Cardoso, 2016, Curr Opin Pharmacol, 26, 1, 10.1016/j.coph.2015.09.001 · DOI
  9. Yang, 2019, Cell Death Dis, 10, 908, 10.1038/s41419-019-2138-4 · DOI
  10. Dajas-Bailador, 2012, Nat Neurosci, 15, 697, 10.1038/nn.3082 · DOI
  11. Shibata, 2011, J Neurosci, 31, 3407, 10.1523/JNEUROSCI.5085-10.2011 · DOI · Paper page
  12. Chi, 2019, Acta Histochem, 121, 151438, 10.1016/j.acthis.2019.08.005 · DOI
  13. Madelaine, 2017, Cell Rep, 20, 1533, 10.1016/j.celrep.2017.07.051 · DOI
  14. Yi, 2020, Int J Mol Sci, 21, 9482, 10.3390/ijms21249482 · DOI
  15. Watson, 2016, Cell Signal, 28, 412, 10.1016/j.cellsig.2016.01.014 · DOI
  16. Li, 2021, Adv Sci, 8, e2101957, 10.1002/advs.202101957 · DOI
  17. Sun, 2021, Cell Cycle, 20, 2372, 10.1080/15384101.2021.1982506 · DOI
  18. Zerdes, 2020, Mol Oncol, 14, 951, 10.1002/1878-0261.12654 · DOI
  19. Lipina, 2016, TEM, 27, 868, 10.1016/j.tem.2016.08.005 · DOI
  20. Shoshani, 2002, Involved in Apoptosis Mol Cell Biol, 22, 2283, 10.1128/MCB.22.7.2283-2293.2002 · DOI · Paper page
  21. Rice, 1981, Ann Neurol, 9, 131, 10.1002/ana.410090206 · DOI
  22. Kim, 2014, JoVE, 91, 51863
  23. Thei, 2018, J Physiol, 596, 6043, 10.1113/JP275649 · DOI
  24. Xu, 2021, Aging, 13, 11315, 10.18632/aging.202824 · DOI
  25. Ip, 2017, Science, 356, 513, 10.1126/science.aal3535 · DOI
  26. Cai, 2019, Oxid Med Cell Longev, 2019, 4248529, 10.1155/2019/4248529 · DOI
  27. Li, 2017, Prog Neurobiol, 159, 50, 10.1016/j.pneurobio.2017.10.006 · DOI
  28. Ham, 2017, Prog Neurobiol, 151, 157, 10.1016/j.pneurobio.2017.01.003 · DOI
  29. Dewdney, 2018, J Stroke Cerebrovasc Dis, 27, 522, 10.1016/j.jstrokecerebrovasdis.2017.09.058 · DOI
  30. Bhalala, 2013, Nat Rev Neurol, 9, 328, 10.1038/nrneurol.2013.67 · DOI · Paper page
  31. Ponnusamy, 2019, Neuropharmacology, 149, 55, 10.1016/j.neuropharm.2018.11.041 · DOI
  32. Coolen, 2013, Front Cell Neurosci, 7, 220, 10.3389/fncel.2013.00220 · DOI · Paper page
  33. Subramanian, 2021, Nat Commun, 12, 3291, 10.1038/s41467-021-23597-9 · DOI · Paper page
  34. Yan, 2020, IUBMB Life, 72, 2382, 10.1002/iub.2357 · DOI
  35. Shen, 2022, Biochem Genet, 60, 755, 10.1007/s10528-021-10121-3 · DOI
  36. Nampoothiri, 2019, Cell Mol Neurobiol, 39, 223, 10.1007/s10571-018-0642-1 · DOI
  37. Cao, 2020, Neuroscience, 444, 106, 10.1016/j.neuroscience.2020.01.008 · DOI
  38. Fuschi, 2019, Antioxid Redox Signal, 30, 992, 10.1089/ars.2017.7229 · DOI
  39. Feng, 2021, Brain Behav Immun, 98, 283, 10.1016/j.bbi.2021.08.230 · DOI · Paper page
  40. Li, 2020, Cell Mol Immunol, 17, 976, 10.1038/s41423-019-0257-6 · DOI
  41. Chen, 2019, Brain Behav Immun, 78, 188, 10.1016/j.bbi.2019.01.020 · DOI
  42. Mariño, 2014, Nature Rev MoleculCell Biol, 15, 81, 10.1038/nrm3735 · DOI · Paper page
  43. Noguchi, 2020, Cell Death Dis, 11, 517, 10.1038/s41419-020-2724-5 · DOI
  44. Li, 2017, Mol Neurobiol, 54, 1642, 10.1007/s12035-015-9637-9 · DOI

Cited by

Sorted by citations

Metadata

Authors
Gai, C., Xing, X., Song, Y., Zhao, Y., Jiang, Z., Cheng, Y., Xiao, Y., & Wang, Z.
Venue
Drug Design, Development and Therapy
Published
2023-04
Volume
Volume 17
Pages
1175-1189
ISSN
1177-8881
Cited by
14
References
3
Language
en

About these checks

Registry, retraction, Cites and statistics results are computed, not judged, with one exception: a printed reference that no index lists is read once by a model before it counts as a citation error. Claims are extracted by a model and kept only when their quote appears verbatim in the text; each cited source is then checked, with a model’s help, for whether it says what the claim relies on. Those verdicts can be wrong — read the claim’s quote and the cited source before relying on one.

Statistics and arithmetic are recomputed, not judged.

Confidence bands are shown only for fields calibrated on our annotated test set. None is calibrated yet, so no band is shown.

What counts as a claim ›How we measure confidence ›How we check this ›

Are you an author, or do you see a problem with this page? Request a review