

The DOI matches its Crossref record; the references it cites are not checked yet; none of the 1 sources its claims cite is checked for support yet.
How Hurricane Katrina influenced the design of hurricane protection and risk reduction systems and national approaches to risk and resilience: Part 1. Hurricane Katrina and New Orleans: A forensic assessment, risk and reliability analysis, and key lessons learned
Open accessAbstract
A systems perspective is presented of what happened during and after Hurricane Katrina (2005) and the potential for reducing the likelihood of large losses in the future. This work was the basis for the rapid repair of the damage resulting from Katrina and ultimately the development and construction of a new risk reduction system for the region and a major shift in engineering guidance and practice related to public water infrastructure. The work was primarily accomplished through the Interagency Performance Evaluation Task Force (IPET) established by the Chief of Engineers, US Army Corps of Engineers, to conduct a comprehensive forensic analysis of what happened and why, and to an engineering risk and reliability assessment of the hurricane protection system in place when Katrina struck.
Checked 2026-11-11 · 7 references not checked yet
Overview
CoChat Summary
TL;DR
This paper synthesizes the Interagency Performance Evaluation Task Force (IPET) forensic analysis of the New Orleans hurricane protection system (HPS) failure during Hurricane Katrina, the accompanying probabilistic risk and reliability assessment, and the lessons learned that shaped the post-Katrina Hurricane and Storm Damage Risk Reduction System (HSDRRS). It argues that the pre-Katrina system failed largely because it was a "system in name only," and that risk-based, system-wide planning with resilience to overtopping and breaching is essential for future flood protection.
Key findings
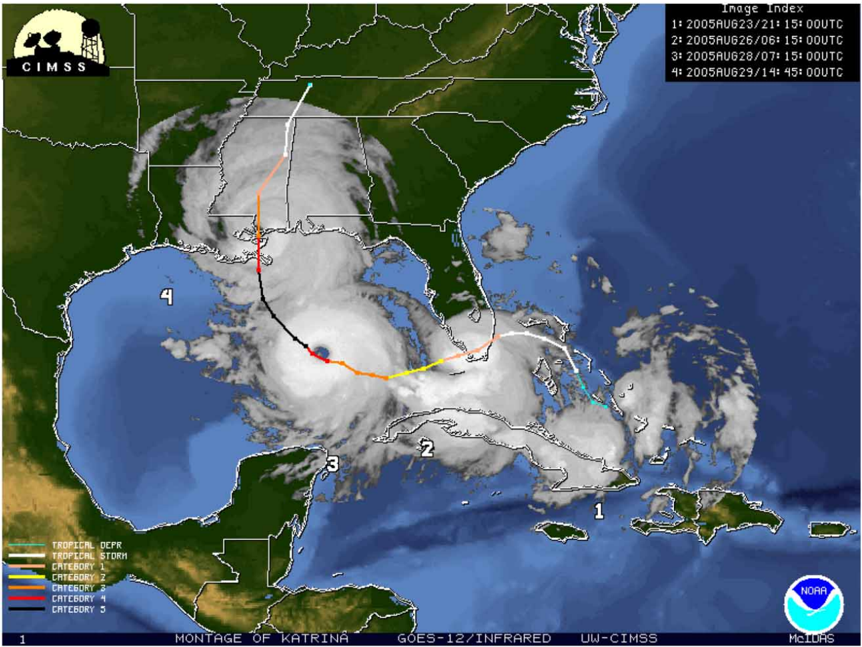
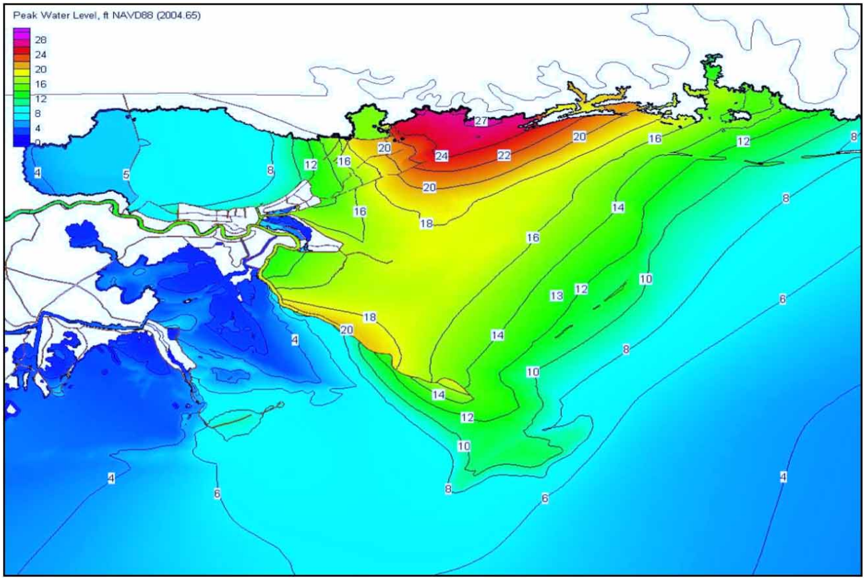
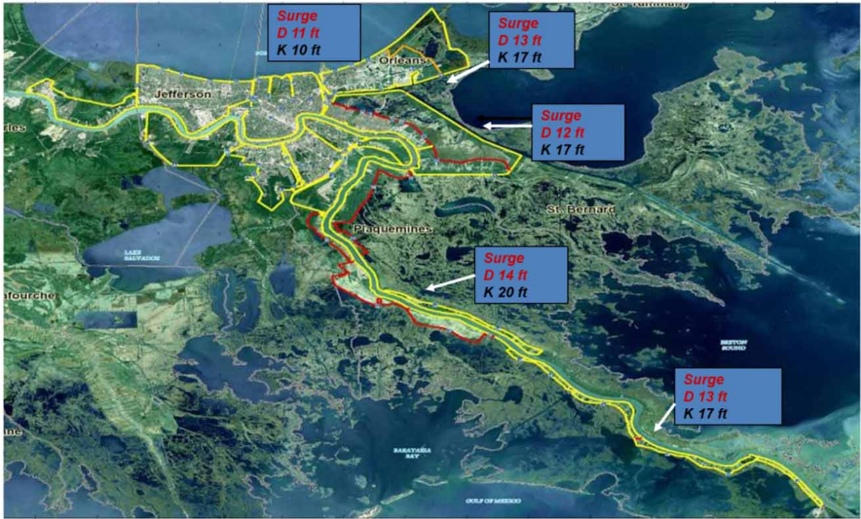
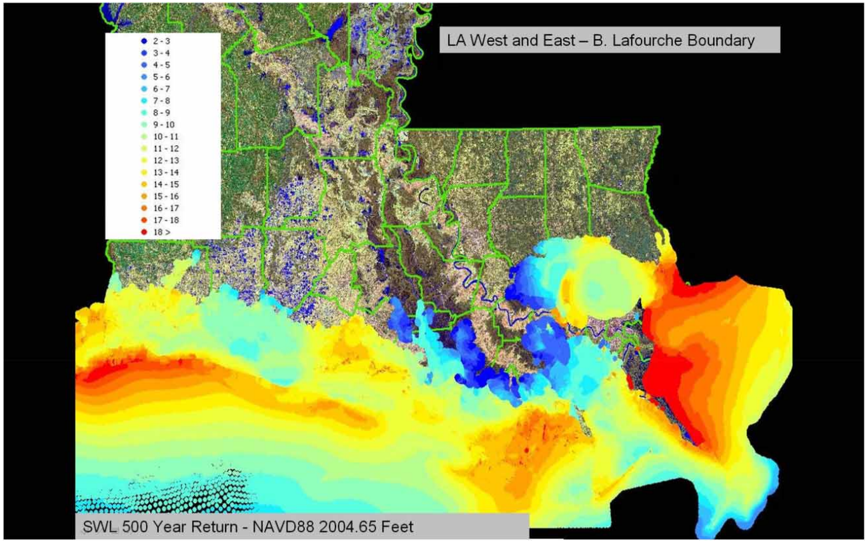
- Katrina's surge and waves exceeded design criteria on the east side of New Orleans: surge of 17–20 ft versus 12–14 ft assumed in design, and wave periods of 14–16 s versus the 5–6 s design assumption (Lake Pontchartrain surge was roughly at design level). Katrina's central pressure index was ~905 mb, versus the 1% recurrence CPI of 934.6 mb (1965) and 926.2 mb (1979); IPET estimated Katrina's recurrence interval at approximately 400 years.
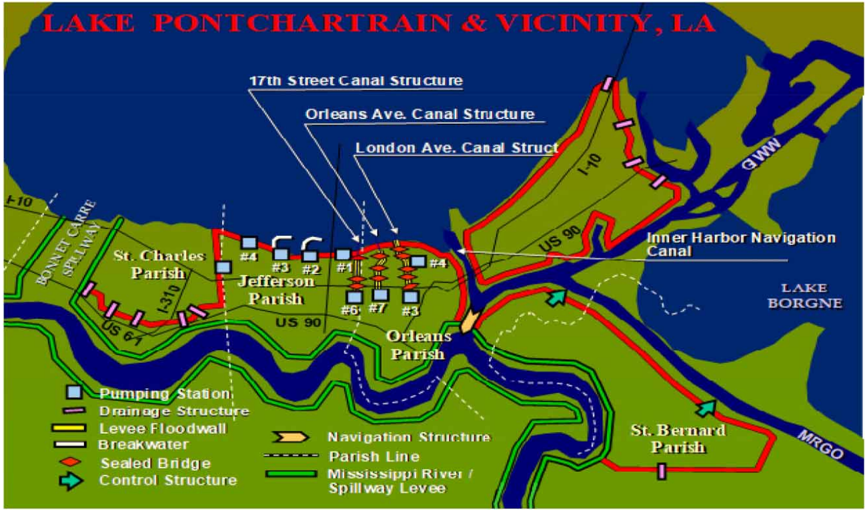
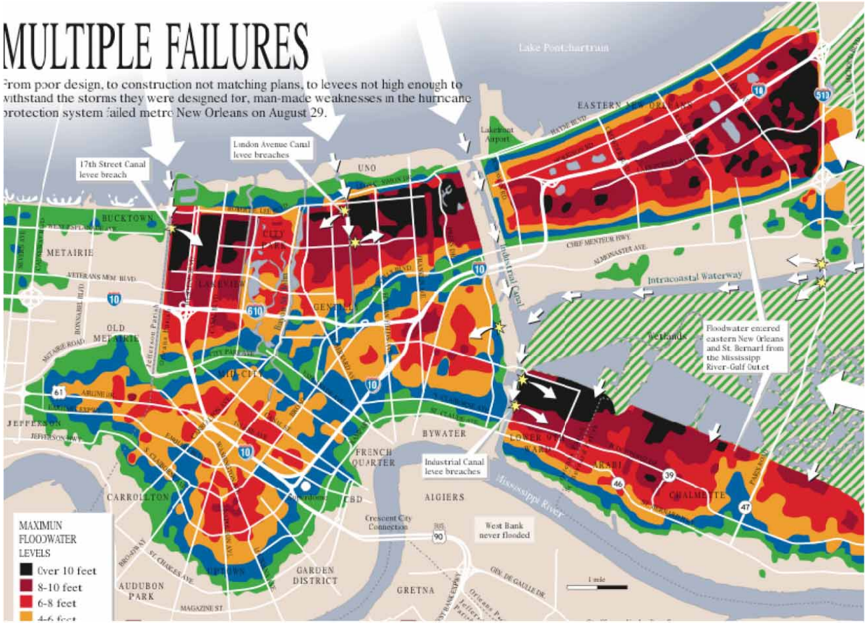
- Over 220 miles of protective structures were damaged, 41 miles severely, along with 34 of 71 pumping stations; 50 major breaches occurred, only four from foundation-induced failure, the rest from overtopping and scour. Three of the four foundation breaches were in outfall canals and one in the IHNC, occurring at water levels below design (IHNC ~9.5–10.5 ft; London Avenue ~9 ft) and without overtopping.
- Flooding inundated almost 80% of New Orleans; only 8 of 73 neighborhoods escaped flooding and 34 were completely inundated. Total direct property losses for New Orleans alone reached nearly $25 billion (including $4.5–$5.6 billion in public infrastructure), with 78% of direct property losses residential, ~11% commercial, and under 2% industrial. Unwatering the city took 53 days.
- Nearly 1,600 fatalities were accounted for regionally, with over 1,000 storm-related deaths in the New Orleans metropolitan area; three of every four who died were over 60. Approximately two-thirds of flooding and half of losses were attributed to breaching rather than overtopping alone; the paper states losses could have been half of what occurred had structures not failed catastrophically.
- Uncertainty quantification in the risk analysis attributed 71% of overall epistemic uncertainty to hazard estimation and 29% to structural performance estimation.
Methods
- Forensic assessment by IPET (established October 2005), published as a draft in June 2006 and final in June 2009 as nine volumes plus a supplemental risk report; a separate, narrower study was led by the University of California at Berkeley (July 2006).
- Hazard characterization used the ADCIRC model on a high-resolution grid to reconstruct surge time histories (validated against high-water marks, agreeing within a foot or two in most cases), plus nested wave modeling (Wave Analysis Model for Gulf fields, Steady State Spectral Wave model nearshore).
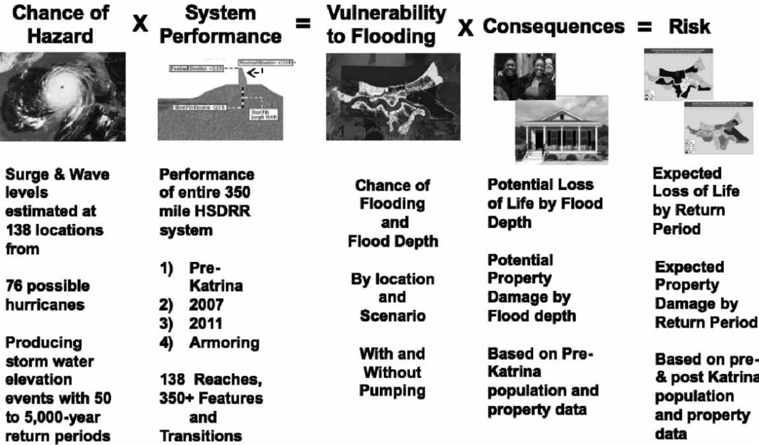
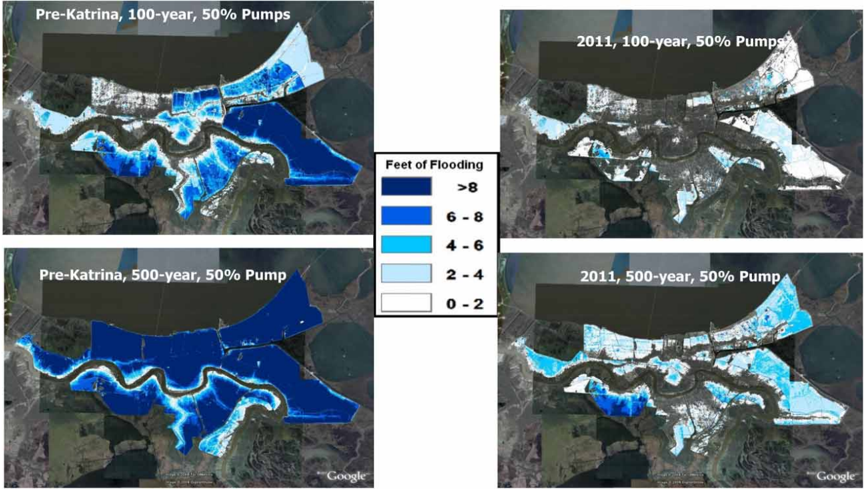
- Probabilistic risk and reliability analysis in four steps — hazard definition, system performance (fragility of levees, walls, gates, transitions, pumping stations), flood depth estimation, and consequence estimation — applied to pre-Katrina (2005) HPS, post-Katrina repaired HPS (June 2007), and the planned HSDRRS (2011), with losses reported for 1/50-, 1/100-, and 1/500-year floods using geospatial census data, evacuation plans, and flood-depth-versus-damage relationships.
Limitations
- Stated: risk assessment "is not intended to support engineering decisions" and requires many generalizations and assumptions relative to design-level detail; the analysis did not consider flooding from high Mississippi River flows not directly related to hurricane surge; hazard estimates are for current climate conditions and do not project climate variations into the future; the effort was a prototype, "in many respects... a first effort of its kind."
- Stated: risk assessments for large complex systems carry large uncertainties, which the paper attributes to the underlying data and models rather than the assessment method itself.
- Evident from the text: the paper is a synthesis of the IPET reports rather than new primary analysis, and it notes that nearly all gauging instruments were destroyed by Katrina, so water-level time histories rest on modeled reconstructions confirmed only by high-water marks.
Model-written summary. Check it against the paper before relying on it.
Integrity signals
Registry
Cites
Statistics
Figures
Verification
Claims the paper makes
46 Own result · 27 Own interpretation · 5 Own method · 3 No basis given · 1 Sources not found
A result the paper states — it cites no source for it, so there is none to check. The quote shows it is in the paper.
In the paper
“The structures were, in effect, designed to perform at water elevations up to overtopping, but not beyond.”
§ How Hurricane Katrina influenced the design of hurricane protection and risk reduction systems and national approaches to risk and resilience: Part 1. Hurricane Katrina and New Orleans: A forensic assessment, risk and reliability analysis, and key lessons learned > Design of the HPS structures
plain- Asserted: passes — The authors put it forward as true.
- Checkable: passes — It can be checked against evidence.
- Load-bearing: passes — The paper’s conclusions depend on it.
- Based: passes — The paper gives a reason why it holds.
A result the paper states — it cites no source for it, so there is none to check. The quote shows it is in the paper.
In the paper
“An aspect of the HPS is that the designs constructed, with the exception of the few sections constructed with T-walls, do not explicitly include protection against overtopping.”
§ How Hurricane Katrina influenced the design of hurricane protection and risk reduction systems and national approaches to risk and resilience: Part 1. Hurricane Katrina and New Orleans: A forensic assessment, risk and reliability analysis, and key lessons learned > Design of the HPS structures
plain- Asserted: passes — The authors put it forward as true.
- Checkable: passes — It can be checked against evidence.
- Load-bearing: unclear — It is unclear whether the paper’s conclusions depend on it.
- Based: passes — The paper gives a reason why it holds.
A result the paper states — it cites no source for it, so there is none to check. The quote shows it is in the paper.
In the paper
“Hurricane Katrina had far greater wave and storm surge generation potential than the SPH storms used to design the HPS in 1965.”
§ How Hurricane Katrina influenced the design of hurricane protection and risk reduction systems and national approaches to risk and resilience: Part 1. Hurricane Katrina and New Orleans: A forensic assessment, risk and reliability analysis, and key lessons learned > Hurricane Katrina event
plain- Asserted: passes — The authors put it forward as true.
- Checkable: passes — It can be checked against evidence.
- Load-bearing: passes — The paper’s conclusions depend on it.
- Based: passes — The paper gives a reason why it holds.
A result the paper reports from its own data — it cites no other source for it, so there is none to check. The quote shows it is in the paper.
In the paper
“Initially, there were a total of 50 major breaches identified, causing a dramatic reduction in protective elevation and losing the ability to prevent the inflow of external water.”
§ How Hurricane Katrina influenced the design of hurricane protection and risk reduction systems and national approaches to risk and resilience: Part 1. Hurricane Katrina and New Orleans: A forensic assessment, risk and reliability analysis, and key lessons learned > Performance of the HPS in place when Katrina struck
plain- Asserted: passes — The authors put it forward as true.
- Checkable: passes — It can be checked against evidence.
- Load-bearing: unclear — It is unclear whether the paper’s conclusions depend on it.
- Based: passes — The paper gives a reason why it holds.
A result the paper states — it cites no source for it, so there is none to check. The quote shows it is in the paper.
In the paper
“There were no T-wall failures with the exception of a small section in southern Plaquemines Parish.”
§ How Hurricane Katrina influenced the design of hurricane protection and risk reduction systems and national approaches to risk and resilience: Part 1. Hurricane Katrina and New Orleans: A forensic assessment, risk and reliability analysis, and key lessons learned > Performance of the HPS in place when Katrina struck
plain- Asserted: passes — The authors put it forward as true.
- Checkable: passes — It can be checked against evidence.
- Load-bearing: unclear — It is unclear whether the paper’s conclusions depend on it.
- Based: passes — The paper gives a reason why it holds.
42 more claims
Create a free account to see all 82 claims and every source verdict.
- It may state two separate claims as one. 26
- Probably not a substantial claim. 11
- The quote only partly states this claim. 1
Self-check
Percentages, sums and reported differences re-computed from the paper’s own numbers.
Each contradiction between two passages listed here was confirmed by an independent check.
Rated minor: it would not touch a result — a value no result rests on, a p-value that stays on the same side of the significance level, or a conflict that is clerical, resolved elsewhere in the paper, or outside its own findings.
In the paper
§ How Hurricane Katrina influenced the design of hurricane protection and risk reduction systems and national approaches to risk and resilience: Part 1. Hurricane Katrina and New Orleans: A forensic assessment, risk and reliability analysis, and key lessons learned > Performance of the HPS in place when Katrina struck
“See Figure 6 for a summary of major structural breaches on the outfall canals and IHNC and resulting in maximum flood depths.”
§ How Hurricane Katrina influenced the design of hurricane protection and risk reduction systems and national approaches to risk and resilience: Part 1. Hurricane Katrina and New Orleans: A forensic assessment, risk and reliability analysis, and key lessons learned > Risk assessment provides a viable means to understand the relative vulnerability of protected areas
“Figure: 6 Fig. 6 | Fig. 6 | Risk assessment methodology used by IPET to evaluate both the HPS and planned HSDRRS (Sources: IPET Report, Vols I and VIII; IPET Supplemental Report 1992).”
Rated minor: it would not touch a result — a value no result rests on, a p-value that stays on the same side of the significance level, or a conflict that is clerical, resolved elsewhere in the paper, or outside its own findings.
In the paper
§ How Hurricane Katrina influenced the design of hurricane protection and risk reduction systems and national approaches to risk and resilience: Part 1. Hurricane Katrina and New Orleans: A forensic assessment, risk and reliability analysis, and key lessons learned > Risk assessment provides a viable means to understand the relative vulnerability of protected areas
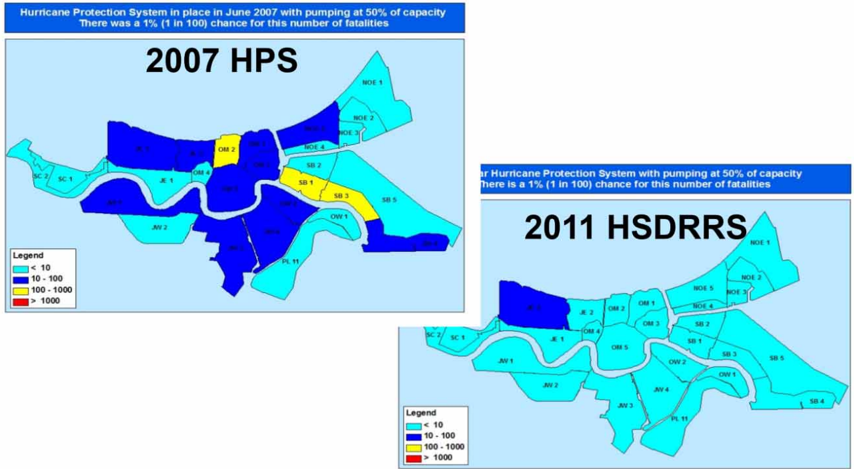
“Figure: 9 Fig. 9 | Fig. 9 | Expected loss of life for 1%, 100-year frequency flooding for pre-Katrina HPS and post-Katrina HSDRRS (Source: IPET Supplemental Report 1992).”
§ How Hurricane Katrina influenced the design of hurricane protection and risk reduction systems and national approaches to risk and resilience: Part 1. Hurricane Katrina and New Orleans: A forensic assessment, risk and reliability analysis, and key lessons learned > Risk and reliability analysis approach
“The analysis of the risk given the construction of the HSDRRS and a comparison of that scenario to the risk existing in 2005 and 2007 are provided in the IPET Supplemental Report, 'A General Description of Vulnerability to Flooding and Risk for New Orleans and Vicinity: Past, Present, and Future' (Supplemental Report of the Interagency Performance Evaluation Task Force, 2009).”
Rated minor: it would not touch a result — a value no result rests on, a p-value that stays on the same side of the significance level, or a conflict that is clerical, resolved elsewhere in the paper, or outside its own findings.
In the paper
§ How Hurricane Katrina influenced the design of hurricane protection and risk reduction systems and national approaches to risk and resilience: Part 1. Hurricane Katrina and New Orleans: A forensic assessment, risk and reliability analysis, and key lessons learned > Risk assessment methodology
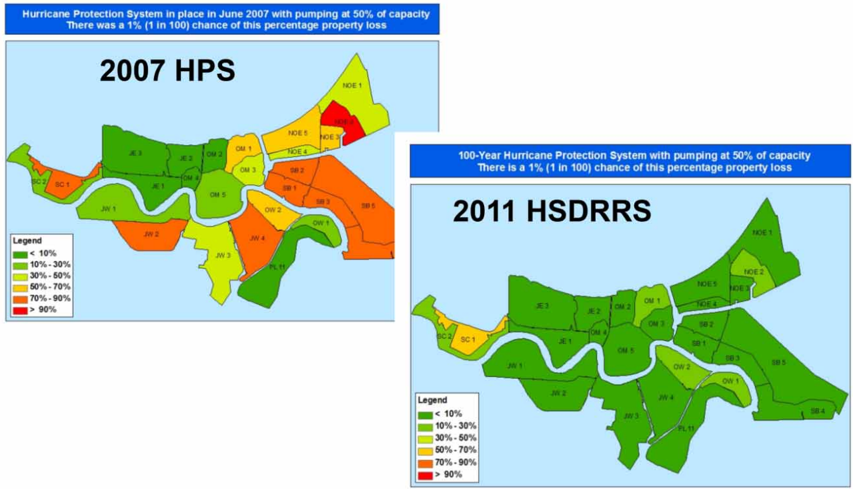
“Figures 9 and 10, respectively, show the expected loss of life and loss of property (in terms of percentage of value) for the 1% or 100-year recurrence level for the 2007 (Repaired HPS) and 2011 (planned HSDRRS) scenarios.”
§ How Hurricane Katrina influenced the design of hurricane protection and risk reduction systems and national approaches to risk and resilience: Part 1. Hurricane Katrina and New Orleans: A forensic assessment, risk and reliability analysis, and key lessons learned > Risk assessment provides a viable means to understand the relative vulnerability of protected areas
“Figure: 9 Fig. 9 | Fig. 9 | Expected loss of life for 1%, 100-year frequency flooding for pre-Katrina HPS and post-Katrina HSDRRS (Source: IPET Supplemental Report 1992).”
Citations
Cites
HSDRRS Design Guidelines (2007) Hurricane and Storm Damage Risk Reduction System Design Elevation Report. Draft Report, US Army Corps of Engineers, New Orleans District.
(n.d.)
UnresolvedHSDRRS Design Guidelines (2012) Hurricane and Storm Damage Risk Reduction System Design Guidelines. INTERIM, US Army Corps of Engineers, New Orleans District, Engineering Division (with Revisions).
(n.d.)
UnresolvedIPET Supplemental Report (2009) A General Description of Vulnerability to Flooding and Risk for New Orleans and Vicinity: Past, Present, and Future. Supplemental Report of the Interagency Performance Evaluation Task Force, US Army Corps of Engineers.
(n.d.)
UnresolvedGuidelines for Risk and Uncertainty Analysis in Water Resources Planning
Report, I. S. (1992)
UnresolvedLuettich R., Westerink J., Scheffler N. (1992) ADCIRC Report 1, Theory and Methodology. Coastal Engineering Research Center, US Army Corps of Engineers, Vicksburg, MS.
(n.d.)
UnresolvedNOAA Technical Report NWS 23 (1979) Meteorological Criteria for Standard Project Hurricane and Probable Maximum Hurricane Wind Fields, Gulf and East Coasts of the United States, Washington, D.C.
(n.d.)
UnresolvedPerformance Evaluation of the New Orleans and Southeast Louisiana Hurricane Protection System. Final Report of the Interagency Performance Evaluation Task Force, US Army Corps of Engineers. Volume I – Executive Summary and Overview, June 2009; Volume II – Geodetic Vertical and Water Level Datums, Ma
(n.d.)
Unresolved
Cited by
Moreno-Baca, F., Cano‐Olivos, P., Sánchez‐Partida, D., & Flores, J. L. M. (2025) · Logistics · doi:10.3390/logistics9020062 · Cited by 16
Optimising hurricane shelter locations with smart predict-then-optimise framework
Jiang, Z., & Ji, R. (2024) · International Journal of Production Research · doi:10.1080/00207543.2024.2412288 · Cited by 16
Zhang, L., & Wang, L. (2023) · Computers and Geotechnics · doi:10.1016/j.compgeo.2023.105439 · Cited by 3
Zhang, L., & Wang, L. (2023) · ASCE Inspire · doi:10.1061/9780784485163.046 · Cited by 2
Enhanced Flood Adaptive Capacity Through a Growth Mindset
Thanvisitthpon, N. T. (2025) · IGI Global eBooks · doi:10.4018/979-8-3373-0619-3.ch010 · Cited by 2
Metadata
- Authors
- Link, L. E.
- Affiliations
- University of Maryland, College Park (US)
- Corresponding author
- Link, Lewis E.
- ORCID
- Link, Lewis E.
- Venue
- Water Policy
- Publisher
- IWA Publishing
- Published
- 2021-11-29
- Volume
- 23
- Issue
- S1
- Pages
- 156-173
- ISSN
- 1366-7017 (ISSN-L)
- 1996-9759
- OpenAlex
- W4200050943
- Semantic Scholar
- 6f47c025c5e463b1965d941446be3766f95a8af8
- Cited by
- 5
- References
- 7
- Citations by year
- 2025: 2 · 2024: 1 · 2023: 2
- FWCI
- 0.23
- Type
- journal article
- Language
- en
- Open access
- diamond
- doi.org
- Licence
- Locations
- Water Policy (publishedVersion, cc-by)
- DOAJ (DOAJ: Directory of Open Access Journals) (submittedVersion, cc-by-sa)
- Topics
- Physical Sciences › Environmental Science › Global and Planetary Change › Flood Risk Assessment and Management
- Social Sciences › Sociology and Political Science › Disaster Management and Resilience
- Physical Sciences › Engineering › Civil and Structural Engineering › Infrastructure Resilience and Vulnerability Analysis
- Keywords
- Hurricane Katrina, risk mitigation, resilience engineering, New Orleans, forensic assessment, U.S. Army Corps of Engineers, flood risk management
About these checks
Registry, retraction, Cites and statistics results are computed, not judged, with one exception: a printed reference that no index lists is read once by a model before it counts as a citation error. Claims are extracted by a model and kept only when their quote appears verbatim in the text; each cited source is then checked, with a model’s help, for whether it says what the claim relies on. Those verdicts can be wrong — read the claim’s quote and the cited source before relying on one.
A language model drew the claims from the paper on 2026-11-11, under version 3 of the claim definition (model deepseek-v4.1-flash, prompt extract-v3).
A second model labelled each claim on 2026-11-11 (model jev-1.13-20260917, definition revision gold-guideline-v0.2).
Statistics and arithmetic are recomputed, not judged.
Confidence bands are shown only for fields calibrated on our annotated test set. None is calibrated yet, so no band is shown.
What counts as a claim ›How we measure confidence ›How we check this ›
Are you an author, or do you see a problem with this page? Request a review
How to cite
Cite CoChat for the checks on this page, and the paper for its own findings.
- This page
- CoChat. (2026). Citation check: How Hurricane Katrina influenced the design of hurricane protection and risk reduction systems and national approaches to risk and resilience: Part 1. Hurricane Katrina and New Orleans: A forensic assessment, risk and reliability analysis, and key lessons learned. https://app.cochat.ai/papers/10.2166/wp.2021.246
- The paper
- Link, L. E. (2021). How Hurricane Katrina influenced the design of hurricane protection and risk reduction systems and national approaches to risk and resilience: Part 1. Hurricane Katrina and New Orleans: A forensic assessment, risk and reliability analysis, and key lessons learned. Water Policy. https://doi.org/10.2166/wp.2021.246
Data sources
Bibliographic data: Semantic Scholar, OpenAlex, Crossref.
Contains information from the Semantic Scholar Academic Graph Datasets, made available under the ODC Attribution License (ODC-BY 1.0).
Semantic Scholar’s data is described in: Kinney, R., et al. (2023). The Semantic Scholar Open Data Platform. arXiv:2301.10140.
