

A Gentle Introduction to the Comparison Between Null Hypothesis Testing and Bayesian Analysis: Reanalysis of Two Randomized Controlled Trials
Open accessPublished version of a preprint
The DOI matches its Crossref record; 22 of the 22 references it cites were found in a registry or an index; none of the 17 sources its claims cite is checked for support yet.
Abstract
The debate on the use and misuse of P values has risen and fallen throughout their almost century-long existence in scientific discovery. Over the past few years, the debate has again received front-page attention, particularly through the public reminder by the American Statistical Association on how P values should be used and interpreted. At the core of the issue lies a fault in the way that scientific evidence is dichotomized and research is subsequently reported, and this fault is exacerbated by researchers giving license to statistical models to do scientific inference. This paper highlights a different approach to handling the evidence collected during a randomized controlled trial, one that does not dichotomize, but rather reports the evidence collected. Through the use of a coin flipping experiment and reanalysis of real-world data, the traditional approach of testing null hypothesis significance is contrasted with a Bayesian approach. This paper is meant to be understood by those who rely on statistical models to draw conclusions from data, but are not statisticians and may therefore not be able to grasp the debate that is primarily led by statisticians.
Overview
CoChat Summary
## TL;DR
This paper is a gentle, nontechnical introduction contrasting null hypothesis significance testing (NHST) with Bayesian analysis, using a coin-flipping example and reanalysis of two randomized controlled trials. The Bayesian approach is presented as a way to report posterior probabilities and avoid dichotomizing results into “significant” and “not significant.”
## Key findings
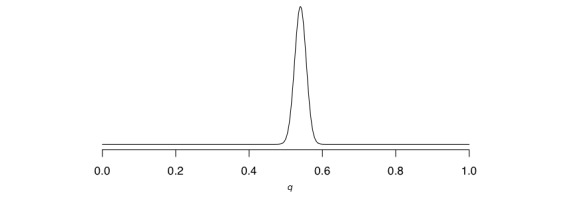
- In the coin-flip example, 540 heads out of 1000 flips gave a maximum likelihood estimate of q = 0.54; the NHST approach produced a P value of .0114 and 95% confidence limits of 0.509 and 0.571.
- For the NEXit trial, 1590 participants were allocated and 1502 responded to follow-up on the primary outcomes; the NHST analysis rejected the null hypothesis (P values < .05), while the Bayesian analysis found the intervention had a positive effect with posterior probabilities of more than 99% for both prolonged abstinence and point prevalence.
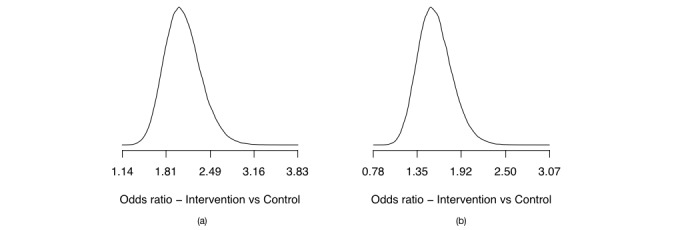
- For the NEXit Bayesian results, the paper reports that the odds ratio was greater than 1.5 with probability more than 99%, greater than 2.0 for prolonged abstinence, and greater than 2.5 with probability 7.05%.
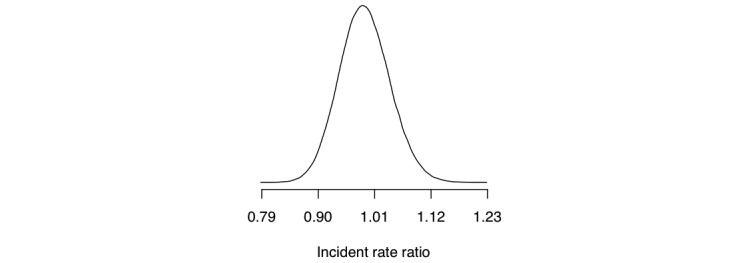
- For the AMADEUS trial, 896 participants were randomized and 816 primary outcome responses were collected; the NHST analysis did not reject the null hypothesis, while the Bayesian analysis found 3.3% probability of a major preference for the novel intervention (IRR < 0.9), 55.4% probability of a minor preference for the novel intervention, 39.6% probability of a minor preference for referral to the questionnaire, and 1.8% probability that referral should be majorly preferred.
## Methods
- Conceptual/tutorial article contrasting NHST and Bayesian reasoning, first with a coin-flipping experiment and then with reanalyses of 2 randomized controlled trials: NEXit (smoking cessation) and AMADEUS (alcohol reduction).
- For NEXit, the paper treats binary outcomes with Bernoulli/logistic regression and reports reanalysis using flat priors and posterior distributions over the odds ratio.
- For AMADEUS, the paper treats the outcome as a count variable and uses negative binomial regression; it reanalyzes the trial with flat priors and posterior distributions over the incidence rate ratio (IRR).
## Limitations
- The paper states that it uses flat priors for the trial reanalyses “so that we can defer any discussion about nonflat priors,” which it explicitly notes goes against its general recommendation.
- The paper says it shall not delve into the details of the interventions for NEXit and AMADEUS and focuses on the statistical comparison instead.
- Evident from the text: the paper is primarily a didactic reanalysis, so its goal is explanation and illustration rather than a new substantive evaluation of the interventions.
Model-written summary. Check it against the paper before relying on it.
Integrity signals
Registry
Cites
Statistics
Figures



Verification
Claims the paper makes
0 Valid · 2 Not valid · 14 Not checked · 40 Own results and interpretations
A result the paper reports from its own data — it cites no other source for it, so there is none to check. The quote shows it is in the paper.
In the paper
“Finally, there is a 1.8% probability that referring to the questionnaire should be majorly preferred.”
§ A Gentle Introduction to the Comparison Between Null Hypothesis Testing and Bayesian Analysis: Reanalysis of Two Randomized Controlled Trials > Analysis of Real-World Data > AMADEUS Trial
plain- Asserted: passes — The authors put it forward as true.
- Checkable: passes — It can be checked against evidence.
- Load-bearing: unclear — It is unclear whether the paper’s conclusions depend on it.
- Based: passes — The paper gives a reason why it holds.
- Rests on an assumption not shown here.
A result the paper reports from its own data — it cites no other source for it, so there is none to check. The quote shows it is in the paper.
In the paper
“There is a small probability of a major preference for the novel intervention (the posterior probability that IRR was <0.9 is 3.3%).”
§ A Gentle Introduction to the Comparison Between Null Hypothesis Testing and Bayesian Analysis: Reanalysis of Two Randomized Controlled Trials > Analysis of Real-World Data > AMADEUS Trial
plain- Asserted: passes — The authors put it forward as true.
- Checkable: passes — It can be checked against evidence.
- Load-bearing: unclear — It is unclear whether the paper’s conclusions depend on it.
- Based: passes — The paper gives a reason why it holds.
- Rests on an assumption not shown here.
A result the paper reports from its own data — it cites no other source for it, so there is none to check. The quote shows it is in the paper.
In the paper
“As Table 1 shows, the null hypothesis that the odds ratio is 1 (ie, no effect) was rejected (P values are <.05).”
§ A Gentle Introduction to the Comparison Between Null Hypothesis Testing and Bayesian Analysis: Reanalysis of Two Randomized Controlled Trials > Analysis of Real-World Data > NEXit Trial
plain- Asserted: passes — The authors put it forward as true.
- Checkable: passes — It can be checked against evidence.
- Load-bearing: passes — The paper’s conclusions depend on it.
- Based: passes — The paper gives a reason why it holds.
A result the paper states — it cites no source for it, so there is none to check. The quote shows it is in the paper.
In the paper
“As we can see, this follows our intuition that the data are more likely given values for q around 0.5 compared with values around 0.1.”
§ A Gentle Introduction to the Comparison Between Null Hypothesis Testing and Bayesian Analysis: Reanalysis of Two Randomized Controlled Trials > Null Hypothesis Significance Testing and Bayesian Analysis of a Coin Flipping Experiment > Bayesian
plainstates an association- Asserted: passes — The authors put it forward as true.
- Checkable: passes — It can be checked against evidence.
- Load-bearing: unclear — It is unclear whether the paper’s conclusions depend on it.
- Based: passes — The paper gives a reason why it holds.
A result the paper reports from its own data — it cites no other source for it, so there is none to check. The quote shows it is in the paper.
In the paper
“and a 39.6% probability of a minor preference for referring to the questionnaire.”
§ A Gentle Introduction to the Comparison Between Null Hypothesis Testing and Bayesian Analysis: Reanalysis of Two Randomized Controlled Trials > Analysis of Real-World Data > AMADEUS Trial
plain- Asserted: passes — The authors put it forward as true.
- Checkable: passes — It can be checked against evidence.
- Load-bearing: unclear — It is unclear whether the paper’s conclusions depend on it.
- Based: passes — The paper gives a reason why it holds.
- Rests on an assumption not shown here.
16 more claims
Create a free account to see all 56 claims and to verify the 17 references still open.
- Probably not a substantial claim. 27
- It may state two separate claims as one. 19
Citations
Cites
The ASA Statement on p -Values: Context, Process, and Purpose
Wasserstein, R. L., & Lazar, N. A. (2016) · The American Statistician · doi:10.1080/00031305.2016.1154108 · Cited by 6,306 · cited 1×
“Voices have been raised over the past few years against the use and misuse of P values, perhaps most notably in a formal statement from the American Statistical Association clarifying widely agreed-upon principles underlying the proper use of P values [4], the banning of P values from the journal Basic and Applied Soc…”
BackgroundRedefine statistical significance
Benjamin, D. J., Berger, J. O., Johannesson, M., Nosek, B. A., Wagenmakers, E.-J., Berk, R., Bollen, K. A., Brembs, B., Brown, L., Camerer, C., et al. (2017) · Nature Human Behaviour · doi:10.1038/s41562-017-0189-z · Cited by 2,772
Bayesian Approaches to Clinical Trials and Health‐Care Evaluation
Spiegelhalter, D. J., Abrams, K. R., & Myles, J. P. (2003) · Wiley eBooks · doi:10.1002/0470092602 · Cited by 1,673
Scientific method: Statistical errors
Nuzzo, R. (2014) · Nature · doi:10.1038/506150a · Cited by 1,536 · cited 1×
“Voices have been raised over the past few years against the use and misuse of P values, perhaps most notably in a formal statement from the American Statistical Association clarifying widely agreed-upon principles underlying the proper use of P values [4], the banning of P values from the journal Basic and Applied Soc…”
BackgroundBayesian estimation supersedes the t-test
Kruschke, J. K. (2013) · Journal of Experimental Psychology: General · doi:10.1037/a0029146 · Cited by 1,530 · cited 1×
“The Bayesian approach taken is not in any sense novel, but has rather been proposed and used before; see Browne et al [13], Goodman and Sladky [14], Krushke [15], Morris et al [16], Spiegelhalter et al [17], and Wijeysundera et al [18].”
MethodTrafimow, D., & Marks, M. (2015) · Basic and Applied Social Psychology · doi:10.1080/01973533.2015.1012991 · Cited by 597
Sparsity information and regularization in the horseshoe and other shrinkage priors
Piironen, J., & Vehtari, A. (2017) · Electronic Journal of Statistics · doi:10.1214/17-ejs1337si · Cited by 457 · cited 1×
“Another case is when we have many covariates to choose from, but we wish to include only the relevant ones for the outcome in our model [19,20].”
BackgroundBayesian clinical trials in action
Jack Lee, J., & Chu, C. T. (2012) · Statistics in Medicine · doi:10.1002/sim.5404 · Cited by 200 · cited 1×
“While, compared with the NHST approach, the use of Bayesian methods to analyze randomized controlled trials is virtually nonexistent, it has increased over the past few years (Lee and Chu [24]).”
MethodWijeysundera, D. N., Austin, P. C., Hux, J. E., Beattie, W. S., & Laupacis, A. (2009) · Journal of Clinical Epidemiology · doi:10.1016/j.jclinepi.2008.07.006 · Cited by 184 · cited 2×
“However, as has been pointed out before [18], it is necessary to include nonstatisticians in the process of moving to a Bayesian approach.”
MethodRemove, rather than redefine, statistical significance
Amrhein, V., & Greenland, S. (2017) · Nature Human Behaviour · doi:10.1038/s41562-017-0224-0 · Cited by 183 · cited 3×
“Furthermore, Amrhein and Greenland [2] pointed out that inference from a mathematical model cannot become “the truth” just because it passes some predefined threshold, and thus the authors suggested removing statistical significance completely.”
BackgroundResult
Research works printed but not linked: 2
- McShaneBBGalDGelmanARobertCTackettJLAbandon statistical significance. arXiv:1709.0758820170921https://arxiv.org/pdf/1709.07588v1.pdf
- CarvalhoCMPolsonNGScottJGHandling sparsity via the horseshoe200912th International Conference on Artificial Intelligence and Statistics (AISTATS)Apr 16-18, 2009Clearwater Beach, FL, USA
Cited by
A Trial of Lopinavir–Ritonavir in Covid-19
(2020) · New England Journal of Medicine · doi:10.1056/nejmc2008043 · Cited by 268
Sandborg, J., Söderström, E., Henriksson, P., Bendtsen, M., Henström, M., Leppänen, M. H., Maddison, R., Migueles, J. H., Blomberg, M., & Löf, M. (2021) · JMIR mHealth and uHealth · doi:10.2196/26091 · Cited by 139
“Thus, we analyzed the interaction effect between group allocation and pre-pregnancy BMI using a Bayesian analysis [46].”
MethodSelf-citationRandomised clinical trials in critical care: past, present and future
Granholm, A., Alhazzani, W. A., Derde, L. P. G., Angus, D. C., Zampieri, F. G., Hammond, N. E., Sweeney, R. M., Myatra, S. N., Azoulay, É., Rowan, K., et al. (2021) · Intensive Care Medicine · doi:10.1007/s00134-021-06587-9 · Cited by 147
“Once data have been collected, these are updated to posterior probability distributions [56, 57].”
MethodMunch, M. W., Myatra, S. N., Vijayaraghavan, B. K. T., Saseedharan, S., Benfield, T., Wahlin, R. R., Rasmussen, B. S., Andreasen, A. S., Poulsen, L. M., Cioccari, L., et al. (2021) · Intensive Care Medicine · doi:10.1007/s00134-021-06573-1 · Cited by 127
“Bayesian analyses and priors Bayesian analyses start with prior probability distributions, representing prior beliefs, which are updated once data has been collected to posterior probability distributions that allow straightforward interpretation and calculation of direct probabilities [10, 16].”
BackgroundMethodAlexandrou, C., Henriksson, H., Henström, M., Henriksson, P., Nyström, C. D., Bendtsen, M., & Löf, M. (2023) · International Journal of Behavioral Nutrition and Physical Activity · doi:10.1186/s12966-023-01405-5 · Cited by 93
“Additionally, we also conducted Bayesian analyses [45] to create a robust base for scientific inference for the effectiveness of the intervention.”
MethodSelf-citation
Metadata
- Authors
- Bendtsen, M.
- Affiliations
- Linköping University (SE)
- Corresponding author
- Bendtsen, Marcus
- ORCID
- Bendtsen, Marcus
- Venue
- Journal of Medical Internet Research
- Publisher
- JMIR Publications Inc.
- Published
- 2018-10-24
- Volume
- 20
- Issue
- 10
- Pages
- e10873
- ISSN
- 1438-8871 (ISSN-L)
- PMC
- PMC6231868
- OpenAlex
- W2889111765
- Cited by
- 105
- References
- 22
- Citations by year
- 2026: 8 · 2025: 8 · 2024: 23 · 2023: 15 · 2022: 22 · 2021: 15 · 2020: 9 · 2019: 5
- FWCI
- 6.02
- Type
- journal article
- Language
- en
- Open access
- gold
- doi.org
- Licence
- cc-by
- Locations
- Journal of Medical Internet Research (publishedVersion, cc-by)
- Europe PMC (PubMed Central) (publishedVersion, cc-by)
- PubMed Central (publishedVersion, cc-by)
- PubMed (publishedVersion)
- KTH Publication Database DiVA (KTH Royal Institute of Technology) (submittedVersion, other-oa)
- Funders
- National Science Foundation
- Office of Naval Research
- Topics
- Physical Sciences › Mathematics › Statistics and Probability › Statistical Methods and Bayesian Inference
- Physical Sciences › Mathematics › Statistics and Probability › Statistical Methods in Clinical Trials
- Social Sciences › Decision Sciences › Statistics, Probability and Uncertainty › Meta-analysis and systematic reviews
- Keywords
- null hypothesis significance testing, Bayesian analysis, p-values, statistical inference
- MeSH terms
- Bayes Theorem, Humans, Research Design, Randomized Controlled Trials as Topic
About these checks
Registry, retraction, Cites and statistics results are computed, not judged, with one exception: a printed reference that no index lists is read once by a model before it counts as a citation error. Claims are extracted by a model and kept only when their quote appears verbatim in the text; each cited source is then checked, with a model’s help, for whether it says what the claim relies on. Those verdicts can be wrong — read the claim’s quote and the cited source before relying on one.
A language model drew the claims from the paper on 2026-10-11, under version 3 of the claim definition (model deepseek-v4.1-flash, prompt extract-v3).
A second model labelled each claim on 2026-10-11 (model jev-1.13-20260917, definition revision gold-guideline-v0.2).
Statistics and arithmetic are recomputed, not judged.
Confidence bands are shown only for fields calibrated on our annotated test set. None is calibrated yet, so no band is shown.
What counts as a claim ›How we measure confidence ›How we check this ›
Are you an author, or do you see a problem with this page? Request a review
Data sources
Bibliographic data: Semantic Scholar, OpenAlex, Crossref.
Contains information from the Semantic Scholar Academic Graph Datasets, made available under the ODC Attribution License (ODC-BY 1.0).
Semantic Scholar’s data is described in: Kinney, R., et al. (2023). The Semantic Scholar Open Data Platform. arXiv:2301.10140.
