

The DOI matches its Crossref record; 51 of the 51 references it cites were found in a registry or an index.
Dyslipidemia-Induced Neuropathy in Mice
Open accessAbstract
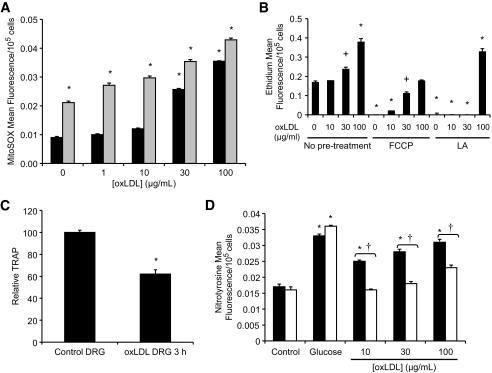
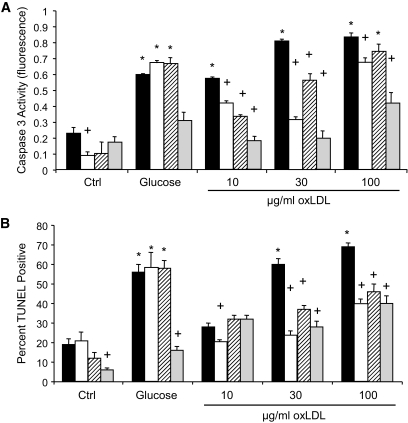
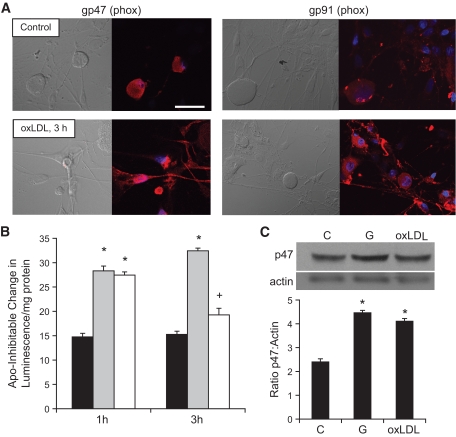
OBJECTIVE: Neuropathy is a frequent and severe complication of diabetes. Multiple metabolic defects in type 2 diabetic patients result in oxidative injury of dorsal root ganglia (DRG) neurons. Our previous work focused on hyperglycemia clearly demonstrates induction of mitochondrial oxidative stress and acute injury in DRG neurons; however, this mechanism is not the only factor that produces neuropathy in vivo. Dyslipidemia also correlates with the development of neuropathy, even in pre-diabetic patients. This study was designed to explore the contribution of dyslipidemia in neuropathy. RESEARCH DESIGN AND METHODS: Mice (n = 10) were fed a control (10% kcal %fat) or high-fat (45% kcal %fat) diet to explore the impact of plasma lipids on the development of neuropathy. We also examined oxidized lipid–mediated injury in cultured DRG neurons from adult rat using oxidized LDLs (oxLDLs). RESULTS: Mice on a high-fat diet have increased oxLDLs and systemic and nerve oxidative stress. They develop nerve conduction velocity (NCV) and sensory deficits prior to impaired glucose tolerance. In vitro, oxLDLs lead to severe DRG neuron oxidative stress via interaction with the receptor lectin-like oxLDL receptor (LOX)-1 and subsequent NAD(P)H oxidase activity. Oxidative stress resulting from oxLDLs and high glucose is additive. CONCLUSIONS: Multiple metabolic defects in type 2 diabetes directly injure DRG neurons through different mechanisms that all result in oxidative stress. Dyslipidemia leads to high levels of oxLDLs that may injure DRG neurons via LOX-1 and contribute to the development of diabetic neuropathy.
Overview
The claims and statistics of this paper haven’t been checked yet.
Run the check — free, no account needed. It reads the open-access text and checks the sources it cites.
Integrity signals
Registry
Cites
Statistics
Figures
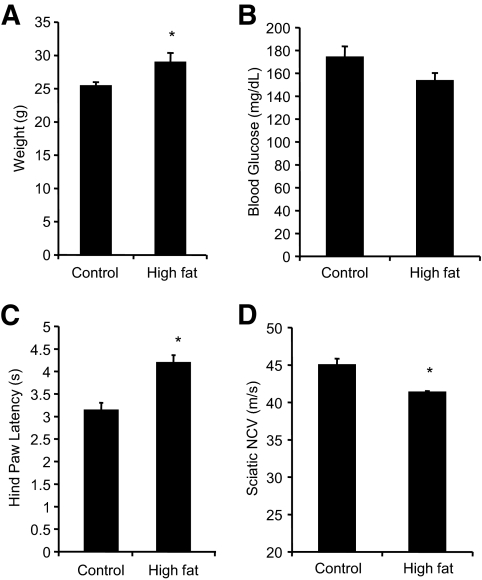
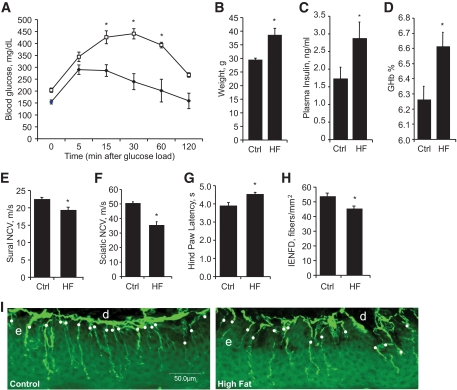
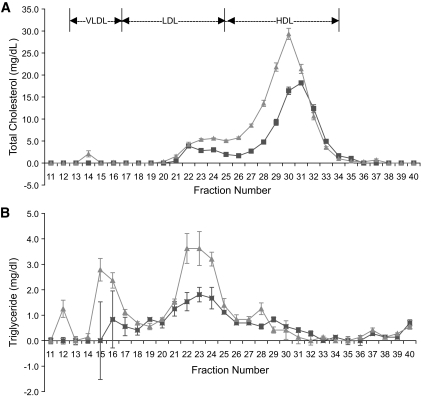
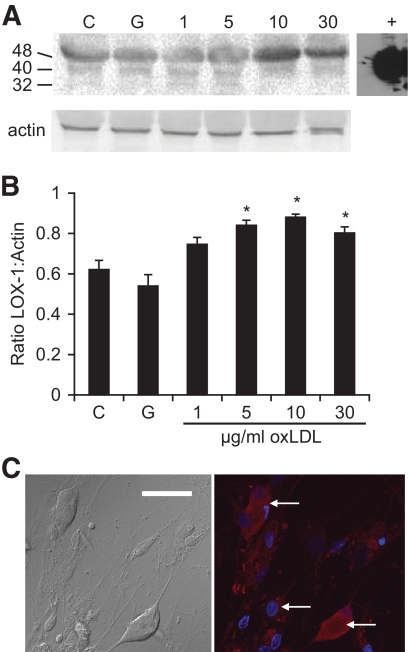
Verification
Claims the paper makes
The claims and statistics of this paper haven’t been checked yet.
Run the check — free, no account needed. It reads the open-access text and checks the sources it cites.
Claims other papers make about this one
Each is checked against this paper’s own text: does it say what the citing paper says it does?
The source backs part of the claim, not all of it — or backs it for a different population, condition or comparison.
In the citing paper
“Low-density lipoproteins (LDL) can undergo oxidation and glycation processes, amplifying the oxidative stress already triggered by excess glucose [38].”
From Diabetic gastroparesis: pathophysiology and impact on insulin timing choices (2026) · cites this paper as [38]
Experimental — accuracy not yet measuredThe source backs part of the claim, not all of it — or backs it for a different population, condition or comparison.
In the citing paper
“In addition to hyperglycemia, alterations in lipid metabolism also play a central role in the pathogenesis of DAN.”
From Diabetic gastroparesis: pathophysiology and impact on insulin timing choices (2026) · cites this paper as [38]
Experimental — accuracy not yet measured
Self-check
Percentages, sums and reported differences re-computed from the paper’s own numbers.
The self-check needs the paper’s full text.
Citations
Cites
Vascular risk factors and diabetic neuropathy
Tesfaye, S., Chaturvedi, N., Eaton, S. E. M., Ward, J. D., Manes, C., Ionescu-Tirgoviste, C., Witte, D. R., & Fuller, J. H. (2005) · New England Journal of Medicine · doi:10.1056/nejmoa032782 · Cited by 1,323
Keech, A., Mitchell, P., Summanen, P., O'Day, J., Davis, T., Moffitt, M., Taskinen, M.-R., Simes, R., Tse, D., Williamson, E., et al. (2007) · The Lancet · doi:10.1016/s0140-6736(07)61607-9 · Cited by 1,109
Surwit, R. S., Feinglos, M. N., Rodin, J., Sutherland, A., Petro, A. E., Opara, E. C., Kuhn, C. M., & Rebuffe-Scrive, M. (1995) · Metabolism · doi:10.1016/0026-0495(95)90123-x · Cited by 618
Lifestyle intervention for pre-diabetic neuropathy
Smith, A. G., Russell, J., Feldman, E. L., Goldstein, J., Peltier, A., Smith, S., Hamwi, J., Pollari, D., Bixby, B., Howard, J., et al. (2006) · Diabetes Care · doi:10.2337/dc06-0224 · Cited by 585
Self-citationTomlinson, D. R., & Gardiner, N. J. (2007) · Nature reviews. Neuroscience · doi:10.1038/nrn2294 · Cited by 578
Oral Treatment With α-Lipoic Acid Improves Symptomatic Diabetic Polyneuropathy
Ziegler, D., As, A., Николаевич, Б. А., Dyck, P. J. B., Владимировна, Г. И., Low, P. A., Munzel, U., Yakhno, N. N., Raz, I., Novosadova, M., et al. (2006) · Diabetes Care · doi:10.2337/dc06-1216 · Cited by 564
The Roles of Oxidative Stress and Antioxidant Treatment in Experimental Diabetic Neuropathy
Low, P. A., Nickander, K. K., & Tritschler, H. (1997) · Diabetes · doi:10.2337/diab.46.2.s38 · Cited by 440
Bae, Y. S., Lee, J. H., Choi, S. H., Kim, S. A., Almazan, F., Witztum, J. L., & Miller, Y. I. (2008) · Circulation Research · doi:10.1161/circresaha.108.181040 · Cited by 435
Neurons Undergo Apoptosis in Animal and Cell Culture Models of Diabetes
Russell, J. W., Sullivan, K. A., Windebank, A. J., Herrmann, D. N., & Feldman, E. L. (1999) · Neurobiology of Disease · doi:10.1006/nbdi.1999.0254 · Cited by 413
Self-citationElevated Triglycerides Correlate With Progression of Diabetic Neuropathy
Wiggin, T. D., Sullivan, K. A., Pop‐Busui, R., Amato, A., Sima, A. A. F., & Feldman, E. L. (2009) · Diabetes · doi:10.2337/db08-1771 · Cited by 346
Self-citationShort‐term hyperglycemia produces oxidative damage and apoptosis in neurons
Vincent, A. M., McLean, L. L., Backus, C., & Feldman, E. L. (2005) · The FASEB Journal · doi:10.1096/fj.04-2513fje · Cited by 298
Self-citationHigh-fat diet-induced hyperglycemia and obesity in mice: differential effects of dietary oils
Ikemoto, S., Takahashi, M., Tsunoda, N., Maruyama, K., Itakura, H., & Ezaki, O. (1996) · Metabolism · doi:10.1016/s0026-0495(96)90185-7 · Cited by 276
High-Fat Diet–Induced Neuropathy of Pre-Diabetes and Obesity
Obrosova, I. G., Ilnytska, O., Lyzogubov, V. V., Pavlov, I. A., Mashtalir, N., Nadler, J. L., & Drel, V. R. (2007) · Diabetes · doi:10.2337/db06-1176 · Cited by 266
Vincent, A. M., Perrone, L., Sullivan, K. A., Backus, C., Sastry, A. M., Lastoskie, C. M., & Feldman, E. L. (2006) · Endocrinology · doi:10.1210/en.2006-0073 · Cited by 265
Self-citationProtective Role of Antioxidative Food Factors in Oxidative Stress Caused by Hyperglycemia
Osawa, T., & Kato, Y. (2005) · Annals of the New York Academy of Sciences · doi:10.1196/annals.1333.050 · Cited by 251
Fat, carbohydrate, and calories in the development of diabetes and obesity in the C57BL/6J mouse
Petro, A. E., Cotter, J., Cooper, D. A., Peters, J. C., Surwit, S. J., & Surwit, R. S. (2004) · Metabolism · doi:10.1016/j.metabol.2003.11.018 · Cited by 210
Mouse models of diabetic neuropathy
Sullivan, K. A., Hayes, J. M., Wiggin, T. D., Backus, C., Oh, S. S., Lentz, S. I., Brosius, F. C., & Feldman, E. L. (2007) · Neurobiology of Disease · doi:10.1016/j.nbd.2007.07.022 · Cited by 202
Self-citationPro-Inflammatory Mechanisms in Diabetic Neuropathy: Focus on the Nuclear Factor Kappa B Pathway
Cameron, N. E., & Cotter, M. A. (2008) · Current Drug Targets · doi:10.2174/138945008783431718 · Cited by 180
Uncoupling Proteins Prevent Glucose-Induced Neuronal Oxidative Stress and Programmed Cell Death
Vincent, A. M., Olzmann, J. A., Brownlee, M., Sivitz, W. I., & Russell, J. W. (2004) · Diabetes · doi:10.2337/diabetes.53.3.726 · Cited by 179
Self-citationExpression of Human Myeloperoxidase by Macrophages Promotes Atherosclerosis in Mice
McMillen, T. S., Heinecke, J. W., & LeBoeuf, R. C. (2005) · Circulation · doi:10.1161/circulationaha.104.516278 · Cited by 168
Glucose Enhances Human Macrophage LOX-1 Expression
Li, L., Sawamura, T., & Renier, G. (2004) · Circulation Research · doi:10.1161/01.res.0000124920.09738.26 · Cited by 160
Dandapat, A., Hu, C., Sun, L., & Mehta, J. L. (2007) · Arteriosclerosis, Thrombosis, and Vascular Biology · doi:10.1161/atvbaha.107.152272 · Cited by 148
Azad, N., Emanuele, N., Abraira, C., Henderson, W. G., Colwell, J. A., Levin, S. R., Nuttall, F. Q., Comstock, J. P., Sawin, C. T., Silbert, C. K., et al. (1999) · Journal of Diabetes and its Complications · doi:10.1016/s1056-8727(99)00062-8 · Cited by 127
Cotter, M. A., & Cameron, N. E. (2003) · Life Sciences · doi:10.1016/s0024-3205(03)00508-3 · Cited by 119
SOD2 protects neurons from injury in cell culture and animal models of diabetic neuropathy
Vincent, A. M., Russell, J. W., Sullivan, K. A., Backus, C., Hayes, J. M., McLean, L. L., & Feldman, E. L. (2007) · Experimental Neurology · doi:10.1016/j.expneurol.2007.07.017 · Cited by 117
Self-citationSmall fiber neuropathy is associated with the metabolic syndrome
Pittenger, G. L., Mehrabyan, A., Simmons, K., Amandarice, Dublin, C., Barlow, P., & Vinik, A. I. (2005) · Metabolic Syndrome and Related Disorders · doi:10.1089/met.2005.3.113 · Cited by 116
Chen, X.-P., Xun, K.-L., Wu, Q., Zhang, T.-T., Shi, J.-S., & Du, G.-H. (2007) · Vascular Pharmacology · doi:10.1016/j.vph.2007.01.004 · Cited by 115
The relationship between endothelial dysfunction and oxidative stress in diabetes and prediabetes
Su, Y., Liu, X., Sun, Y., Jin, H., Fu, R., Wang, Y.-Y., Wu, Y., & Luan, Y. (2008) · International Journal of Clinical Practice · doi:10.1111/j.1742-1241.2008.01776.x · Cited by 111
Hull, R. L., Andrikopoulos, S., Verchere, C. B., Vidal, J., Wang, F., Cnop, M., Prigeon, R. L., & Kahn, S. E. (2003) · Diabetes · doi:10.2337/diabetes.52.2.372 · Cited by 109
Mehta, J. L., CHEN, J., Yu, F., & LI, D. (2004) · Cardiovascular Research · doi:10.1016/j.cardiores.2004.07.002 · Cited by 107
Leiter, L. A. (2005) · Diabetes Research and Clinical Practice · doi:10.1016/j.diabres.2005.03.015 · Cited by 96
Oxidative injury and neuropathy in diabetes and impaired glucose tolerance
Russell, J. W., Berent‐Spillson, A., Vincent, A. M., Freimann, C. L., Sullivan, K. A., & Feldman, E. L. (2008) · Neurobiology of Disease · doi:10.1016/j.nbd.2008.02.013 · Cited by 91
Self-citationWei, P., Lane, P. H., Lane, J. T., Padanilam, B. J., & Sansom, S. C. (2004) · Diabetologia · doi:10.1007/s00125-004-1489-1 · Cited by 89
Vascular dysfunction and autonomic neuropathy in Type 2 diabetes
Meyer, C., Milat, F., McGrath, B. P., Cameron, J. D., Kotsopoulos, D., & Teede, H. J. (2004) · Diabetic Medicine · doi:10.1111/j.1464-5491.2004.01241.x · Cited by 79
Criteria for Creating and Assessing Mouse Models of Diabetic Neuropathy
Feldman, E. L., Sullivan, K., Lentz, S. I., & Roberts, J. (2008) · Current Drug Targets · doi:10.2174/138945008783431763 · Cited by 77
Self-citationThum, T., & Borlak, J. T. (2008) · Journal of Biological Chemistry · doi:10.1074/jbc.m708309200 · Cited by 74
Zhang, H., Saha, J., Byun, J., Schin, M., Lorenz, M. A., Kennedy, R. T., Kretzler, M., Feldman, E. L., Pennathur, S., & Brosius, F. C. (2008) · American Journal of Physiology-Renal Physiology · doi:10.1152/ajprenal.90208.2008 · Cited by 74
Self-citationMcPherson, P. A. C., Young, I. S., McKibben, B. M., & McEneny, J. (2006) · Journal of Lipid Research · doi:10.1194/jlr.m600094-jlr200 · Cited by 70
Kataoka, H., Kume, N., Miyamoto, S., Minami, M., Murase, T., Sawamura, T., Masaki, Τ., Hashimoto, N., & Kita, T. (2000) · Journal of Biological Chemistry · doi:10.1074/jbc.275.9.6573 · Cited by 70
The Antioxidant Response as a Drug Target in Diabetic Neuropathy
Vincent, A. M., Edwards, J. L., Sadidi, M., & Feldman, E. L. (2008) · Current Drug Targets · doi:10.2174/138945008783431754 · Cited by 66
Self-citationRosiglitazone Treatment Reduces Diabetic Neuropathy in Streptozotocin-Treated DBA/2J Mice
Wiggin, T. D., Kretzler, M., Pennathur, S., Sullivan, K. A., Brosius, F. C., & Feldman, E. L. (2008) · Endocrinology · doi:10.1210/en.2008-0869 · Cited by 60
Self-citationLOX-1 and inflammation: a new mechanism for renal injury in obesity and diabetes
Kelly, K. J., Wu, P., Patterson, C. E., Temm, C. J., & Dominguez, J. H. (2008) · American Journal of Physiology-Renal Physiology · doi:10.1152/ajprenal.00396.2007 · Cited by 60
Cell Culture Modeling to Test Therapies Against Hyperglycemia-Mediated Oxidative Stress and Injury
Vincent, A. M., Stevens, M. J., Backus, C., McLean, L. L., & Feldman, E. L. (2005) · Antioxidants and Redox Signaling · doi:10.1089/ars.2005.7.1494 · Cited by 60
Self-citationReactive Carbonyls and Polyunsaturated Fatty Acids Produce a Hydroxyl Radical-like Species
Pennathur, S., Ido, Y., Heller, J. I., Byun, J., Danda, R. S., Pérgola, P. E., Williamson, J. R., & Heinecke, J. W. (2005) · Journal of Biological Chemistry · doi:10.1074/jbc.m500839200 · Cited by 60
Self-citationKaradeniz, G., Açıkgöz, Ş., Tekin, İ. Ö., Tascýlar, O., Gün, B. D., & Cömert, M. (2008) · Clinics · doi:10.1590/s1807-59322008000400020 · Cited by 41
Shiu, S. W. M., Tan, K. C. B., Wong, Y., Leng, L., & Bucala, R. (2008) · Atherosclerosis · doi:10.1016/j.atherosclerosis.2008.07.012 · Cited by 33
Miguel, P. M., Raoch, V., Zaragoza, C., Valdivielso, J. M., Rodrı́guez-Puyol, M., Rodrı́guez-Puyol, D., & López‐Ongil, S. (2008) · Journal of Lipid Research · doi:10.1194/jlr.m800215-jlr200 · Cited by 28
Ando, K., & Fujita, T. (2004) · Clinical and Experimental Nephrology · doi:10.1007/s10157-004-0288-9 · Cited by 23
Keren, P., George, J., Keren, G., & Harats, D. (2001) · Atherosclerosis · doi:10.1016/s0021-9150(00)00685-7 · Cited by 22
Can Drug Screening Lead to Candidate Therapies for Testing in Diabetic Neuropathy?
Vincent, A. M., & Feldman, E. L. (2007) · Antioxidants and Redox Signaling · doi:10.1089/ars.2007.1815 · Cited by 14
Self-citationHuo, Y., Winters, W. D., & Yao, D. (2003) · Phytotherapy Research · doi:10.1002/ptr.1078 · Cited by 14
Cited by
Sorted by citations
Feldman, E. L., Callaghan, B. C., Pop-Busui, R., Zochodne, D. W., Wright, D. E., Bennett, D. L., Bril, V., Russell, J. W., & Viswanathan, V. (2019) · Nature Reviews Disease Primers · doi:10.1038/s41572-019-0092-1 · Cited by 1,697
Self-citationDiabetic neuropathy: clinical manifestations and current treatments
Callaghan, B. C., Cheng, H. T., Stables, C. L., Smith, A. L., & Feldman, E. L. (2012) · The Lancet Neurology · doi:10.1016/s1474-4422(12)70065-0 · Cited by 1,271
Self-citationAdvances in the epidemiology, pathogenesis and management of diabetic peripheral neuropathy
Tesfaye, S. H., & Selvarajah, D. (2012) · Diabetes/Metabolism Research and Reviews · doi:10.1002/dmrr.2239 · Cited by 629
Diabetic neuropathy: cellular mechanisms as therapeutic targets
Vincent, A. M., Callaghan, B. C., Smith, A. L., & Feldman, E. L. (2011) · Nature Reviews Neurology · doi:10.1038/nrneurol.2011.137 · Cited by 586
Self-citationPathogenesis, diagnosis and clinical management of diabetic sensorimotor peripheral neuropathy
Sloan, G., Selvarajah, D., & Tesfaye, S. (2021) · Nature Reviews Endocrinology · doi:10.1038/s41574-021-00496-z · Cited by 534
Metadata
- Authors
- Vincent, A. M., Hayes, J. M., McLean, L. L., Vivekanandan-Giri, A., Pennathur, S., & Feldman, E. L.
- Affiliations
- University of Michigan (US)
- Department of Medicine, University of Michigan, Ann Arbor, Michigan.
- Corresponding author
- Vincent, Andrea M.
- Venue
- Diabetes
- Publisher
- American Diabetes Association
- Published
- 2009-07-10
- Volume
- 58
- Issue
- 10
- Pages
- 2376-2385
- ISSN
- 0012-1797 (ISSN-L)
- 1939-327X
- PMC
- PMC2750230
- OpenAlex
- W2155399617
- Cited by
- 264
- References
- 51
- Citations by year
- 2026: 11 · 2025: 12 · 2024: 20 · 2023: 15 · 2022: 15 · 2021: 23 · 2020: 19 · 2019: 14 · 2018: 11 · 2017: 12 · 2016: 9 · 2015: 9 · 2014: 31 · 2013: 14 · 2012: 21
- FWCI
- 10.86
- Type
- journal article
- Language
- en
- Open access
- hybrid
- doi.org
- Licence
- Locations
- Diabetes (publishedVersion, cc-by-nc-nd)
- PubMed Central (publishedVersion, cc-by-nc-nd)
- PubMed (publishedVersion)
- Funders
- American Diabetes Association
- University of Washington
- National Institutes of Health
- National Institute of Diabetes and Digestive and Kidney Diseases (U01DK076160, R24DK082841)
- Topics
- Health Sciences › Medicine › Physiology (medical) › Pain Mechanisms and Treatments
- Health Sciences › Medicine › Clinical Neurology › Peripheral Neuropathies and Disorders
- Life Sciences › Biochemistry, Genetics and Molecular Biology › Cell Biology › Aldose Reductase and Taurine
- Keywords
- dyslipidemia, diabetic neuropathy, dorsal root ganglion neurons, oxidized LDL, LOX-1, NADPH oxidase, oxidative stress, high-fat diet, nerve conduction velocity, sensory impairment, type 2 diabetes, hyperglycemia, plasma lipids
- MeSH terms
- Animals, Blood Glucose, Diabetes Mellitus, Type 2, Diabetic Neuropathies, Dietary Fats, Female, Ganglia, Spinal, Glucose Tolerance Test, Hindlimb, Insulin, Lipids, Lipoproteins, LDL, Mice, Inbred C57BL, Nerve Fibers, Neural Conduction, Neurons, Rats, Sprague-Dawley, Reactive Oxygen Species, Dyslipidemias, Scavenger Receptors, Class E, Mice, Rats, DNA Fragmentation
About these checks
Registry, retraction, Cites and statistics results are computed, not judged, with one exception: a printed reference that no index lists is read once by a model before it counts as a citation error. Claims are extracted by a model and kept only when their quote appears verbatim in the text; each cited source is then checked, with a model’s help, for whether it says what the claim relies on. Those verdicts can be wrong — read the claim’s quote and the cited source before relying on one.
Statistics and arithmetic are recomputed, not judged.
Confidence bands are shown only for fields calibrated on our annotated test set. None is calibrated yet, so no band is shown.
What counts as a claim ›How we measure confidence ›How we check this ›
Are you an author, or do you see a problem with this page? Request a review
