

The DOI matches its Crossref record, with a small difference in title or year; 37 of the 37 references it cites were found in a registry or an index.
Glucose-Dependent Insulinotropic Polypeptide
Open accessAbstract
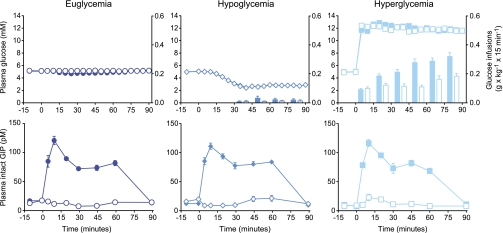
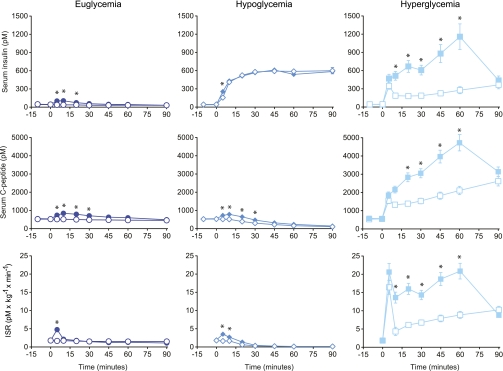
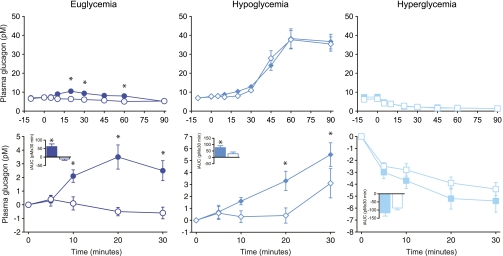
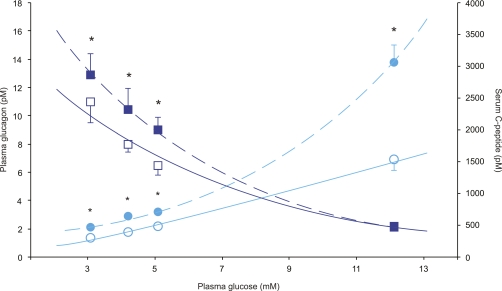
OBJECTIVE: To evaluate the glucose dependency of glucose-dependent insulinotropic polypeptide (GIP) effects on insulin and glucagon release in 10 healthy male subjects ([means ± SEM] aged 23 ± 1 years, BMI 23 ± 1 kg/m2, and HbA1c 5.5 ± 0.1%). RESEARCH DESIGN AND METHODS: Saline or physiological doses of GIP were administered intravenously (randomized and double blinded) during 90 min of insulin-induced hypoglycemia, euglycemia, or hyperglycemia. RESULTS: During hypoglycemia, GIP infusion caused greater glucagon responses during the first 30 min compared with saline (76 ± 17 vs. 28 ± 16 pmol/L per 30 min, P < 0.008), with similar peak levels of glucagon reached after 60 min. During euglycemia, GIP infusion elicited larger glucagon responses (62 ± 18 vs. −11 ± 8 pmol/L per 90 min, P < 0.005). During hyperglycemia, comparable suppression of plasma glucagon (−461 ± 81 vs. −371 ± 50 pmol/L per 90 min, P = 0.26) was observed with GIP and saline infusions. In addition, during hyperglycemia, GIP more than doubled the insulin secretion rate (P < 0.0001). CONCLUSIONS: In healthy subjects, GIP has no effect on glucagon responses during hyperglycemia while strongly potentiating insulin secretion. In contrast, GIP increases glucagon levels during fasting and hypoglycemic conditions, where it has little or no effect on insulin secretion. Thus, GIP seems to be a physiological bifunctional blood glucose stabilizer with diverging glucose-dependent effects on the two main pancreatic glucoregulatory hormones.
Overview
The claims and statistics of this paper haven’t been checked yet.
Run the check — free, no account needed. It reads the open-access text and checks the sources it cites.
Integrity signals
Registry
Cites
Statistics
Figures
Verification
Claims the paper makes
The claims and statistics of this paper haven’t been checked yet.
Run the check — free, no account needed. It reads the open-access text and checks the sources it cites.
Claims other papers make about this one
Each is checked against this paper’s own text: does it say what the citing paper says it does?
The source backs part of the claim, not all of it — or backs it for a different population, condition or comparison.
In the citing paper
“Consistent with these clinical observations, recent studies indicate that agonism of the GIP receptor is important for maximal stimulation of insulin secretion from human pancreatic β cells (20, 21).”
From Tirzepatide Improved Markers of Islet Cell Function and Insulin Sensitivity in People With T2D (SURPASS-2) (2024) · cites this paper as [21]
Experimental — accuracy not yet measured
Self-check
Percentages, sums and reported differences re-computed from the paper’s own numbers.
The self-check needs the paper’s full text.
Citations
Cites
Nauck, M. A., Heimesaat, M. M., Orskov, C., Holst, J. J., Ebert, R., & Creutzfeldt, W. (1993) · Journal of Clinical Investigation · doi:10.1172/jci116186 · Cited by 1,651
Self-citationInhibition of gastric inhibitory polypeptide signaling prevents obesity
Miyawaki, K., Yamada, Y., Ban, N., Ihara, Y., Tsukiyama, K., Zhou, H., Fujimoto, S., Oku, A., Tsuda, K., Toyokuni, S., et al. (2002) · Nature Medicine · doi:10.1038/nm727 · Cited by 963
Self-citationCauter, E. V., Mestrez, F., Sturis, J., & Polonsky, K. S. (1992) · Diabetes · doi:10.2337/diab.41.3.368 · Cited by 887
STIMULATION OF INSULIN SECRETION BY GASTRIC INHIBITORY POLYPEPTIDE IN MAN. 1
Dupre, J., Ross, S. A., Watson, D., & Brown, J. C. (1973) · The Journal of Clinical Endocrinology & Metabolism · doi:10.1210/jcem-37-5-826 · Cited by 860
Nauck, M. A., Heimesaat, M. M., Behle, K., Holst, J. J., Nauck, M. S., Ritzel, R., Hüfner, M., & Schmiegel, W. H. (2002) · The Journal of Clinical Endocrinology & Metabolism · doi:10.1210/jcem.87.3.8355 · Cited by 605
Self-citationα-Cells of the Endocrine Pancreas: 35 Years of Research but the Enigma Remains
Gromada, J., Franklin, I., & Wollheim, C. B. (2007) · Endocrine Reviews · doi:10.1210/er.2006-0007 · Cited by 596
Vilsbøll, T., Krarup, T., Sonne, J., Madsbad, S., Vølund, A., Juul, A. G., & Holst, J. J. (2003) · The Journal of Clinical Endocrinology & Metabolism · doi:10.1210/jc.2002-021873 · Cited by 528
Self-citationT., V., T., K., S., M., & J., H. (2002) · Diabetologia · doi:10.1007/s00125-002-0878-6 · Cited by 518
Self-citationVilsbøll, T., Krarup, T., Madsbad, S., & Holst, J. J. (2003) · Regulatory Peptides · doi:10.1016/s0167-0115(03)00111-3 · Cited by 430
Self-citationDunning, B. E., & Gerich, J. E. (2007) · Endocrine Reviews · doi:10.1210/er.2006-0026 · Cited by 369
Cited by
Sorted by citations
Tirzepatide versus Semaglutide Once Weekly in Patients with Type 2 Diabetes
Frías, J. P., Davies, M. J., Rosenstock, J., Pérez Manghi, F. C., Fernández Landó, L., Bergman, B. K., Liu, B., Cui, X., & Brown, K. (2021) · New England Journal of Medicine · doi:10.1056/nejmoa2107519 · Cited by 2,096
Rosenstock, J., Wysham, C., Frías, J. P., Kaneko, S., Lee, C. J., Fernández Landó, L., Mao, H., Cui, X., Karanikas, C. A., & Thieu, V. T. (2021) · The Lancet · doi:10.1016/s0140-6736(21)01324-6 · Cited by 1,080
Coskun, T., Sloop, K. W., Loghin, C., Alsina-Fernandez, J., Urva, S., Bokvist, K. B., Cui, X., Briere, D. A., Cabrera, O., Roell, W. C., et al. (2018) · Molecular Metabolism · doi:10.1016/j.molmet.2018.09.009 · Cited by 882
Del Prato, S., Kahn, S. E., Pavo, I., Weerakkody, G. J., Yang, Z., Doupis, J., Aizenberg, D., Wynne, A. G., Riesmeyer, J. S., Heine, R. J., et al. (2021) · The Lancet · doi:10.1016/s0140-6736(21)02188-7 · Cited by 684
How May GIP Enhance the Therapeutic Efficacy of GLP-1?
Samms, R. J., Coghlan, M. P., & Sloop, K. W. (2020) · Trends in Endocrinology & Metabolism · doi:10.1016/j.tem.2020.02.006 · Cited by 419
Metadata
- Authors
- Christensen, M., Vedtofte, L., Holst, J. J., Vilsbøll, T., & Knop, F. K.
- Affiliations
- University of Copenhagen (DK)
- Gentofte Hospital (DK)
- Corresponding author
- Christensen, Mikkel
- Venue
- Diabetes
- Publisher
- American Diabetes Association
- Published
- 2011-11-13
- Volume
- 60
- Issue
- 12
- Pages
- 3103-3109
- ISSN
- 0012-1797 (ISSN-L)
- 1939-327X
- PMC
- PMC3219957
- OpenAlex
- W2414002317
- Cited by
- 353
- References
- 37
- Citations by year
- 2026: 20 · 2025: 31 · 2024: 31 · 2023: 22 · 2022: 36 · 2021: 31 · 2020: 21 · 2019: 32 · 2018: 29 · 2017: 15 · 2016: 20 · 2015: 16 · 2014: 21 · 2013: 17 · 2012: 8
- FWCI
- 15.40
- Type
- journal article
- Language
- en
- Open access
- hybrid
- doi.org
- Licence
- Locations
- Diabetes (publishedVersion, cc-by-nc-nd)
- Europe PMC (PubMed Central) (publishedVersion, cc-by-nc-nd)
- PubMed Central (publishedVersion, cc-by-nc-nd)
- PubMed (publishedVersion)
- Research at the University of Copenhagen (University of Copenhagen) (submittedVersion)
- Funders
- Novo Nordisk Fonden
- Topics
- Health Sciences › Medicine › Endocrinology, Diabetes and Metabolism › Pancreatic function and diabetes
- Health Sciences › Medicine › Endocrinology, Diabetes and Metabolism › Diabetes Treatment and Management
- Health Sciences › Medicine › Endocrinology, Diabetes and Metabolism › Diabetes Management and Research
- Keywords
- glucose-dependent insulinotropic polypeptide, glucagon secretion, insulin secretion, glucose dependence, hypoglycemia, hyperglycemia, normoglycemia, pancreatic hormone regulation, glucose homeostasis
- MeSH terms
- Insulin Secretion, Adult, Blood Glucose, Gastric Inhibitory Polypeptide, Glucagon, Humans, Hyperglycemia, Hypoglycemia, Injections, Intraventricular, Insulin, Male, Young Adult
About these checks
Registry, retraction, Cites and statistics results are computed, not judged, with one exception: a printed reference that no index lists is read once by a model before it counts as a citation error. Claims are extracted by a model and kept only when their quote appears verbatim in the text; each cited source is then checked, with a model’s help, for whether it says what the claim relies on. Those verdicts can be wrong — read the claim’s quote and the cited source before relying on one.
Statistics and arithmetic are recomputed, not judged.
Confidence bands are shown only for fields calibrated on our annotated test set. None is calibrated yet, so no band is shown.
What counts as a claim ›How we measure confidence ›How we check this ›
Are you an author, or do you see a problem with this page? Request a review
