PreprintCited by 12Protein Structure and DynamicsRNA and protein synthesis mechanismsAlzheimer's disease research and treatments

The DOI matches its Crossref record; 1 of the 1 references it cites were found in a registry or an index.

Multi-eGO: model improvements towards the study of complex self-assembly processes

Open access
Bacic Toplek, Fran, Scalone, Emanuele, Stegani, Bruno, Paissoni, Cristina, Capelli, Riccardo, Camilloni, Carlo·2023·Journal of Chemical Theory and Computation

Preprint — published as 10.1021/acs.jctc.3c01182 · Paper page

Abstract

Structure-based models have been instrumental in simulating protein folding and suggesting hypotheses about the mechanisms involved. Nowadays, at least for fast folding proteins, folding can be simulated in explicit solvent using classical molecular dynamics. However, other self-assembly processes, such as protein aggregation, are still far from being accessible. Recently, we proposed that a hybrid multi-state structure-based model, multi-eGO, could help to bridge the gap towards the simulation of out-of-equilibrium, concentration-dependent self-assembly processes. Here, we further improve the model and show how multi-eGO can effectively and accurately learn the conformational ensemble of the Amyloid β42 intrinsically disordered peptide, reproduce the well-established folding mechanism of the B1 immunoglobulin-binding domain of streptococcal protein G, and reproduce the aggregation as a function of the concentration of the Transthyretin 105-115 amyloidogenic peptide. We envision that by learning from the dynamics of a few minima, multi-eGO can become a platform for simulating processes inaccessible to other simulation techniques.

Overview

The claims and statistics of this paper haven’t been checked yet.

Run the check — free, no account needed. It reads the open-access text and checks the sources it cites.

A few free checks a day · papers already verified open instantly · results are public

Integrity signals

Registry

Crossref · 10.26434/chemrxiv-2023-67255-v2

Cites

1 of 1 references verified0 citation errors · 0 not checkable

Statistics

Figures

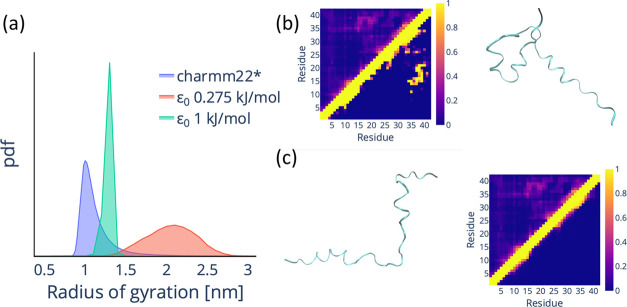
Figure 1 Original multi-eGO fails to reproduce the conformational dynamics of the Aβ42 monomer. (a) Probability density function (pdf) for the backbone radius of gyration of Aβ42 for a training simulation (charmm22*, blue)22 and for an original multi-eGO simulation with ε0 = 0.275 kJ/mol (red) and ε0 = 1 kJ/mol (green). (b) Comparison of the per-residue probability contact map for the training and original multi-eGO simulation with ε0 = 1 kJ/mol and a representative structure from the multi-eGO simulation. The colored bar represents the contact probability. (c) Comparison of the per-residue probability contact map for the training and original multi-eGO simulation with ε0 = 0.275 kJ/mol and a representative structure from the multi-eGO simulation. The color bar represents the contact probability.
Figure 1 Original multi-eGO fails to reproduce the conformational dynamics of the Aβ42 monomer. (a) Probability density function (pdf) for the backbone radius of gyration of Aβ42 for a training simulation (charmm22*, blue)22 and for an original multi-eGO simulation with ε0 = 0.275 kJ/mol (red) and ε0 = 1 kJ/mol (green). (b) Comparison of the per-residue probability contact map for the training and original multi-eGO simulation with ε0 = 1 kJ/mol and a representative structure from the multi-eGO simulation. The colored bar represents the contact probability. (c) Comparison of the per-residue probability contact map for the training and original multi-eGO simulation with ε0 = 0.275 kJ/mol and a representative structure from the multi-eGO simulation. The color bar represents the contact probability.CC BY · PubMed Central
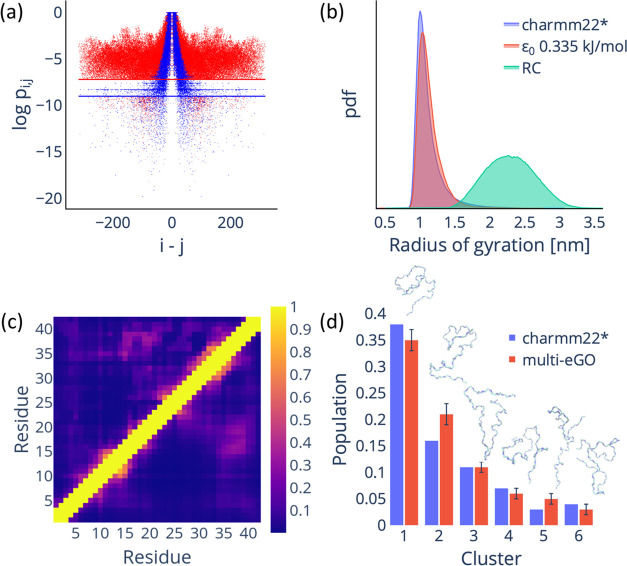
Figure 2 Reformulated multi-eGO model can reproduce the conformational dynamics of Aβ42 IDP. (a) Comparison of the atom-pair contact probabilities for the training (red dots) and RC (blue dots) simulations. The lines represent the PthresholdMD (red) and PthresholdRC (blue) values. (b) Comparison of the radius of gyration probability density function (calculated using the backbone atoms) for the training (blue), multi-eGO (orange), and RC (green) simulations. (c) The contact probability map per residue for the training (upper diagonal) and multi-eGO (lower diagonal) simulations. The color bar represents the contact probability. (d) Clustering analysis of multi-eGO and training simulations. The clusters are comparable in population size and in terms of order. A representative configuration is shown for each cluster.
Figure 2 Reformulated multi-eGO model can reproduce the conformational dynamics of Aβ42 IDP. (a) Comparison of the atom-pair contact probabilities for the training (red dots) and RC (blue dots) simulations. The lines represent the PthresholdMD (red) and PthresholdRC (blue) values. (b) Comparison of the radius of gyration probability density function (calculated using the backbone atoms) for the training (blue), multi-eGO (orange), and RC (green) simulations. (c) The contact probability map per residue for the training (upper diagonal) and multi-eGO (lower diagonal) simulations. The color bar represents the contact probability. (d) Clustering analysis of multi-eGO and training simulations. The clusters are comparable in population size and in terms of order. A representative configuration is shown for each cluster.CC BY · PubMed Central
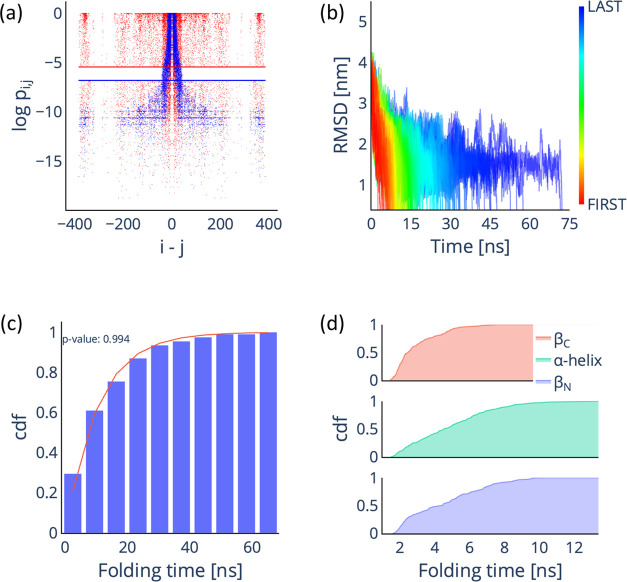
Figure 3 Multi-eGO can reproduce the folding mechanism of GB1. (a) Comparison of the atom-pair contact probabilities for the training (red dots) and RC (blue dots) simulations. The lines represent the PthresholdMD (red) and PthresholdRC (blue) values. (b) Time evolution of the RMSD with respect to the folded state for the 200 multi-eGO folding trajectories. (c) Cumulative distribution function (cdf) of the folding time distribution for the 200 multi-eGO folding trajectories (blue bars), fitted with the cdf of the Poisson distribution (red line) and associated p-value. (d) Cumulative distribution function for the folding times of the three GB1 secondary structure elements.
Figure 3 Multi-eGO can reproduce the folding mechanism of GB1. (a) Comparison of the atom-pair contact probabilities for the training (red dots) and RC (blue dots) simulations. The lines represent the PthresholdMD (red) and PthresholdRC (blue) values. (b) Time evolution of the RMSD with respect to the folded state for the 200 multi-eGO folding trajectories. (c) Cumulative distribution function (cdf) of the folding time distribution for the 200 multi-eGO folding trajectories (blue bars), fitted with the cdf of the Poisson distribution (red line) and associated p-value. (d) Cumulative distribution function for the folding times of the three GB1 secondary structure elements.CC BY · PubMed Central
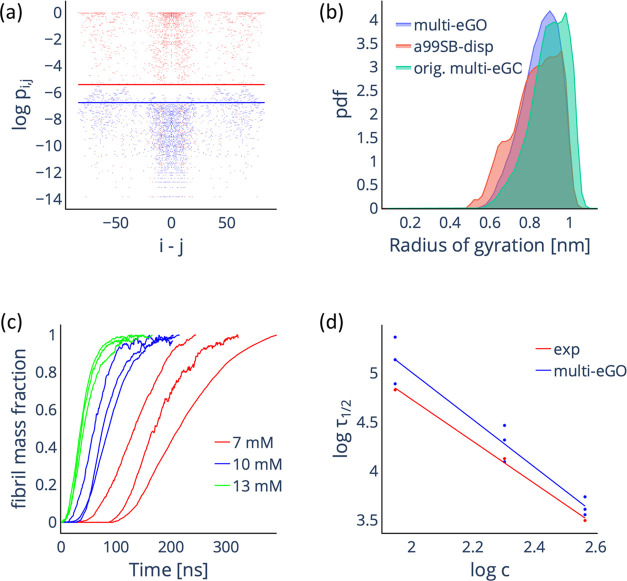
Figure 4 Multi-eGO simulations of TTR105–115 aggregation as a function of the initial monomer concentration. (a) Comparison of the intermolecular contact probabilities of atom pairs for the training (red dots) and 13 mM RC (blue dots) simulations. The lines represent the PthresholdMD (red) and PthresholdRC (blue) values. (b) Comparison of the radius of the gyration probability density function (calculated using the backbone atoms) for the training monomer (red), reformulated multi-eGO (blue), and original multi-eGO (green) simulations. (c) Simulated aggregation kinetics. Curves represent the normalized number of monomers involved in an aggregate of at least 10 monomers as a function of nominal simulation time. (d) Log–log plot of the half-times as a function of the initial monomer concentration, experimental values (red) are taken from ref. (18) Both sets can be fitted by a straight line with slopes γ = −2.1 ± 0.1 and γ = −2.4 ± 0.2 for the experimental and simulated data, respectively.
Figure 4 Multi-eGO simulations of TTR105–115 aggregation as a function of the initial monomer concentration. (a) Comparison of the intermolecular contact probabilities of atom pairs for the training (red dots) and 13 mM RC (blue dots) simulations. The lines represent the PthresholdMD (red) and PthresholdRC (blue) values. (b) Comparison of the radius of the gyration probability density function (calculated using the backbone atoms) for the training monomer (red), reformulated multi-eGO (blue), and original multi-eGO (green) simulations. (c) Simulated aggregation kinetics. Curves represent the normalized number of monomers involved in an aggregate of at least 10 monomers as a function of nominal simulation time. (d) Log–log plot of the half-times as a function of the initial monomer concentration, experimental values (red) are taken from ref. (18) Both sets can be fitted by a straight line with slopes γ = −2.1 ± 0.1 and γ = −2.4 ± 0.2 for the experimental and simulated data, respectively.CC BY · PubMed Central

Verification

Claims the paper makes

The claims and statistics of this paper haven’t been checked yet.

Run the check — free, no account needed. It reads the open-access text and checks the sources it cites.

A few free checks a day · papers already verified open instantly · results are public

Self-check

Percentages, sums and reported differences re-computed from the paper’s own numbers.

The self-check needs the paper’s full text.

Citations

Cites

Metadata

Authors
Bacic Toplek, F., Scalone, E., Stegani, B., Paissoni, C., Capelli, R., & Camilloni, C.
Affiliations
  • University of Milan
  • Dartmouth College (US)
  • University of Milan (IT)
Corresponding author
Camilloni, Carlo
Venue
Journal of Chemical Theory and Computation
Published
2023-10-25
Volume
20
Issue
1
Pages
459-468
ISSN
1549-9618 (ISSN-L)
OpenAlex
W4390339339
Cited by
12
References
1
Citations by year
2026: 4 · 2025: 5 · 2024: 2 · 2023: 1
FWCI
1.07
Type
journal article
Language
en
Open access
Locations
  • Journal of Chemical Theory and Computation (publishedVersion, cc-by)
  • ChemRxiv (acceptedVersion, cc-by-nc-nd)
  • PubMed Central (publishedVersion, cc-by)
  • PubMed (publishedVersion)
  • Archivio Istituzionale della Ricerca (Universita Degli Studi Di Milano) (submittedVersion, other-oa)
Funders
  • Università degli Studi di Milano
  • Fondazione Telethon (GGP19134)
Topics
  • Life Sciences › Biochemistry, Genetics and Molecular Biology › Molecular Biology › Protein Structure and Dynamics
  • Life Sciences › Biochemistry, Genetics and Molecular Biology › Molecular Biology › RNA and protein synthesis mechanisms
  • Life Sciences › Neuroscience › Cellular and Molecular Neuroscience › Alzheimer's disease research and treatments
Keywords
structure-based models, protein self-assembly, protein folding, protein aggregation, amyloid-beta 42, intrinsically disordered peptides, streptococcal protein G, prealbumin, amyloidogenic peptides, conformational ensembles, nonequilibrium processes, concentration-dependent aggregation
MeSH terms
Ego, Peptides, Protein Conformation, Protein Folding, Molecular Dynamics Simulation

About these checks

Registry, retraction, Cites and statistics results are computed, not judged, with one exception: a printed reference that no index lists is read once by a model before it counts as a citation error. Claims are extracted by a model and kept only when their quote appears verbatim in the text; each cited source is then checked, with a model’s help, for whether it says what the claim relies on. Those verdicts can be wrong — read the claim’s quote and the cited source before relying on one.

Statistics and arithmetic are recomputed, not judged.

Confidence bands are shown only for fields calibrated on our annotated test set. None is calibrated yet, so no band is shown.

What counts as a claim ›How we measure confidence ›How we check this ›

Are you an author, or do you see a problem with this page? Request a review