

The DOI matches its Crossref record; 1 of the 1 references it cites were found in a registry or an index.
Equivariant Graph Neural Networks for Toxicity Prediction
Open accessPreprint — published as 10.1021/acs.chemrestox.3c00032 · Paper page
Abstract
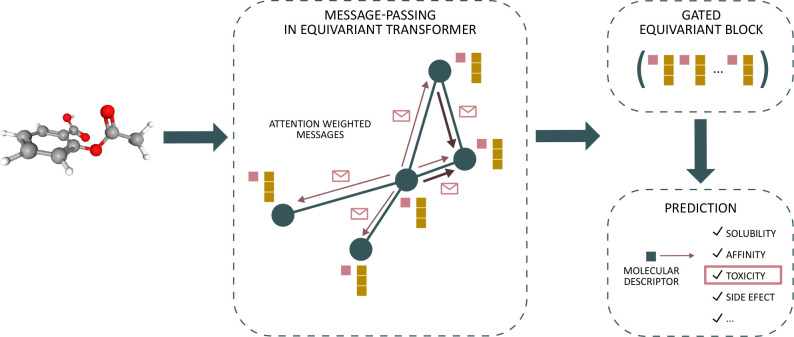
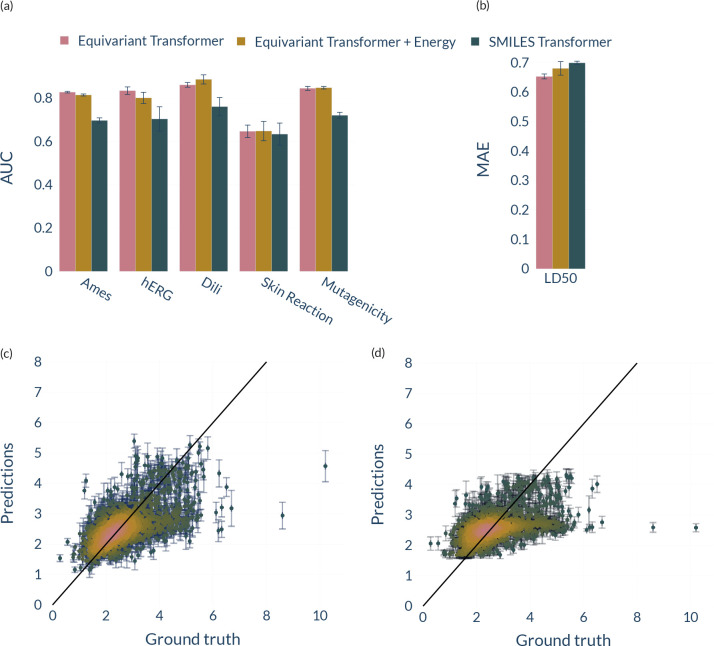
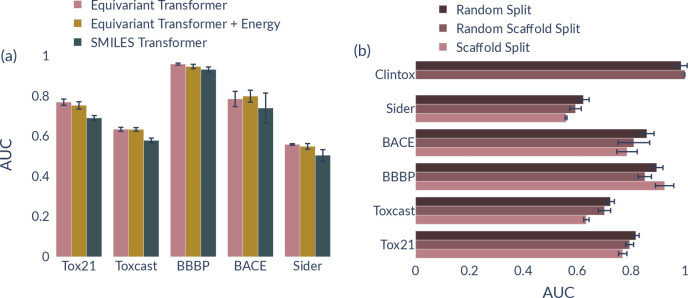
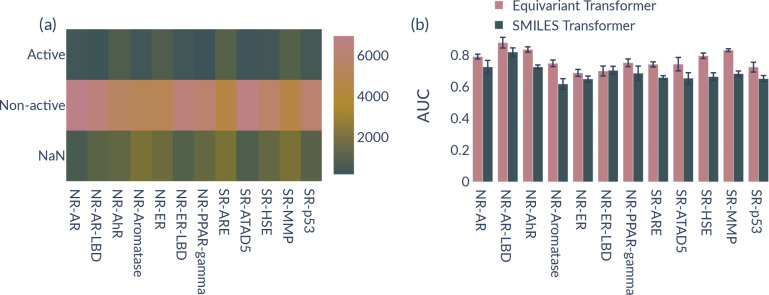
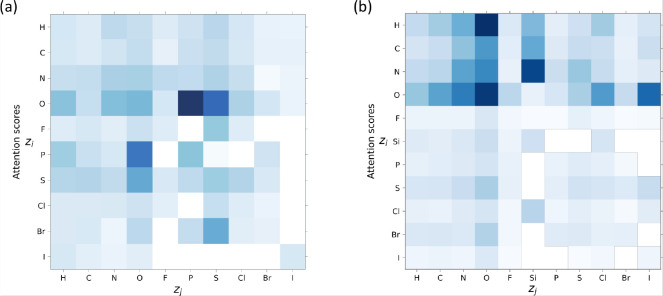
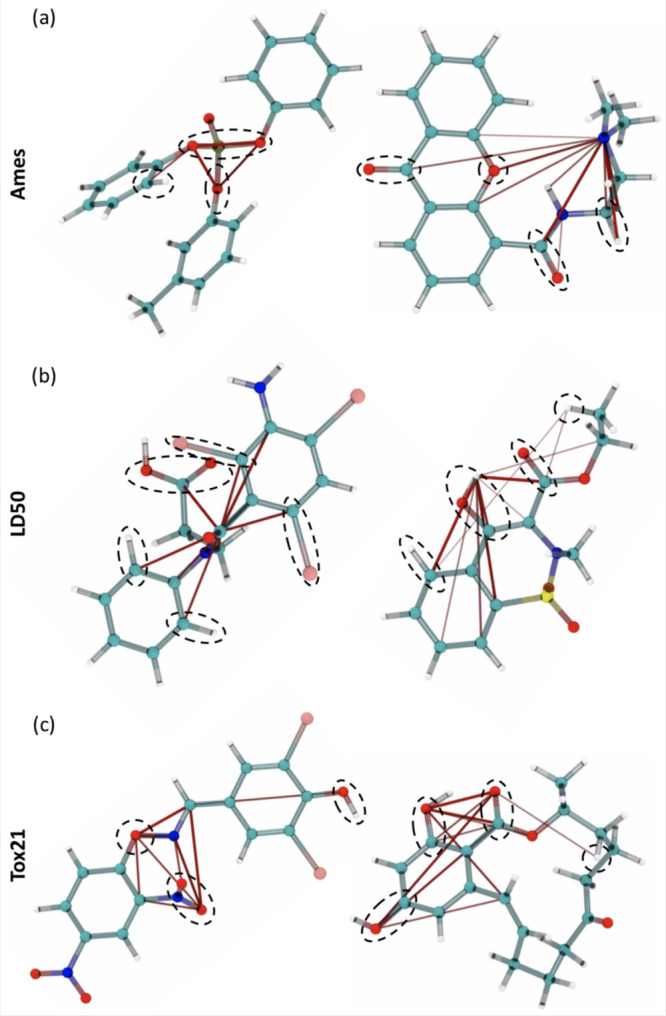
Predictive modeling for toxicity is a crucial step in the drug discovery pipeline. It can help filter out molecules with a high probability of failing in the early stages of de novo drug design. Thus, several machine learning (ML) models have been developed to predict the toxicity of molecules by combining classical ML techniques or deep neural networks with well-known molecular representations such as fingerprints or 2D graphs. But the more natural, accurate representation of molecules is expected to be defined in physical 3D space like in ab initio methods. Recent studies successfully used equivariant graph neural networks (EGNNs) for representation learning based on 3D structures to predict quantum mechanical properties of molecules. Inspired by this, we investigate the performance of EGNNs to construct reliable ML models for toxicity prediction. We use the equivariant transformer (ET) model in TorchMD-NET for this. Eleven toxicity datasets taken from MoleculeNet, TDCommons, and ToxBenchmark have been considered to evaluate the capability of ET for toxicity prediction. Our results show that ET adequately learns 3D representations of molecules that can successfully correlate with toxicity activity, achieving good accuracies on most datasets comparable to state-of-the-art models. We also test a physicochemical property, namely the total energy of a molecule, to inform the toxicity prediction with a physical prior. However, our work suggests these two properties can not be related. We also provide an attention weight analysis for helping to understand the toxicity prediction in 3D space and, thus, increase the explainability of the ML model. In summary, our findings offer promising insights considering 3D geometry information via EGNNs and provide a straightforward way to integrate molecular conformers into ML-based pipelines for predicting and investigating toxicity prediction in physical space. We expect that in the future, especially for larger, more diverse datasets, EGNNs will be an essential tool in this domain.
Overview
The claims and statistics of this paper haven’t been checked yet.
Run the check — free, no account needed. It reads the open-access text and checks the sources it cites.
Integrity signals
Registry
Cites
Statistics
Figures
Verification
Claims the paper makes
The claims and statistics of this paper haven’t been checked yet.
Run the check — free, no account needed. It reads the open-access text and checks the sources it cites.
Self-check
Percentages, sums and reported differences re-computed from the paper’s own numbers.
The self-check needs the paper’s full text.
Citations
Cites
Highly accurate protein structure prediction with AlphaFold
Jumper, J., Evans, R., Pritzel, A., Green, T., Figurnov, M., Ronneberger, O., Tunyasuvunakool, K., Bates, R., Žídek, A., Potapenko, A., et al. (2021) · Nature · doi:10.1038/s41586-021-03819-2 · Cited by 43,764
Metadata
- Authors
- Cremer, J., Sandonas, L. M., Tkatchenko, A., Clevert, D.-A., & de Fabritiis, G.
- Affiliations
- Universitat Pompeu Fabra (ES)
- University of Luxembourg
- University of Luxembourg (LU)
- Pfizer (Germany)
- Pompeu Fabra University
- Corresponding author
- Cremer, Julian
- Venue
- Chemical Research in Toxicology
- Publisher
- American Chemical Society (ACS)
- Published
- 2023-07-17
- ISSN
- 0893-228X (ISSN-L)
- PMC
- PMC10583285
- OpenAlex
- W4386587901
- Cited by
- 62
- References
- 1
- Citations by year
- 2026: 16 · 2025: 23 · 2024: 19 · 2023: 4
- FWCI
- 8.77
- Type
- journal article
- Language
- en
- Open access
- hybrid
- doi.org
- Locations
- Chemical Research in Toxicology (publishedVersion, cc-by)
- ChemRxiv (acceptedVersion, cc-by-nc-nd)
- PubMed Central (publishedVersion, cc-by)
- PubMed (publishedVersion)
- Repositori digital de la UPF (Universitat Pompeu Fabra) (submittedVersion, cc-by)
- Zenodo (CERN European Organization for Nuclear Research) (submittedVersion, cc-by)
- Funders
- Université du Luxembourg
- European Commission (MCIN /AEI/ 10.13039/501100011033, 956832, 10.13039/501100011033, 13039/501100011033, 501100011033, HORIZON2020, 823712, /AEI/10.13039/501100011033)
- Ministerio de Ciencia e Innovación (PID2020-116564GB-I00)
- Agencia Estatal de Investigación (AEI//10.13039/501100011033/, 501100011033, 10.13039/501100011033, MCIN/AEI/10.13039/501 100 011 033, 13039, PID2020-116564GB-I00, .13039/501100011033, MCIN / AEI/10, 10.13039, AEI/10)
- H2020 Marie Skłodowska-Curie Actions (956832, MCIN/AEI/10.13039/ 501100011033)
- H2020 Research Infrastructures (823712)
- Topics
- Life Sciences › Pharmacology, Toxicology and Pharmaceutics › Drug Discovery › Computational Drug Discovery Methods
- Physical Sciences › Materials Science › Materials Chemistry › Machine Learning in Materials Science
- Physical Sciences › Physics and Astronomy › Atomic and Molecular Physics, and Optics › Advanced Chemical Physics Studies
- Keywords
- equivariant graph neural networks, toxicity prediction, molecular conformers, explainability, physicochemical properties, drug discovery
About these checks
Registry, retraction, Cites and statistics results are computed, not judged, with one exception: a printed reference that no index lists is read once by a model before it counts as a citation error. Claims are extracted by a model and kept only when their quote appears verbatim in the text; each cited source is then checked, with a model’s help, for whether it says what the claim relies on. Those verdicts can be wrong — read the claim’s quote and the cited source before relying on one.
Statistics and arithmetic are recomputed, not judged.
Confidence bands are shown only for fields calibrated on our annotated test set. None is calibrated yet, so no band is shown.
What counts as a claim ›How we measure confidence ›How we check this ›
Are you an author, or do you see a problem with this page? Request a review
