PreprintCited by 24Electron Spin Resonance StudiesProtein Structure and DynamicsEnzyme Structure and Function

The DOI matches its Crossref record; 1 of the 1 references it cites were found in a registry or an index.

Investigating Native Metal Ion Binding Sites in Mammalian Histidine-Rich Glycoprotein

Open access
Ackermann, Katrin, Khazaipoul, Siavash, Wort, Joshua, Sobczak, Amélie, ElMkami, Hassane, Stewart, Alan, Bode, Bela·2023·Journal of the American Chemical Society

Preprint — published as 10.1021/jacs.3c00587 · Paper page

Abstract

Mammalian histidine-rich glycoprotein (HRG) is a highly versatile and abundant blood plasma glycoprotein with a diverse range of ligands that is involved in regulating many essential biological processes, including coagulation, cell adhesion and angiogenesis. Despite its biomedical importance, structural information on the multi-domain protein is sparse, not least due to intrinsically disordered regions that elude high-resolution structural characterisation. Binding of divalent metal ions, particularly ZnII, to multiple sites within the HRG protein is of critical functional importance and exerts a regulatory role. However, characterisation of the ZnII binding sites of HRG is a challenge; their number and composition, as well as their affinities and stoichiometries of binding are currently not fully understood. In this study, we explored modern electron paramagnetic resonance (EPR) spectroscopy methods in combination with AlphaFold2 protein structure prediction to assemble a holistic picture of native HRG and its interaction with metal ions. To our best knowledge this is the first time this suite of EPR techniques has been applied to count and characterise endogenous metal ion binding sites in a native mammalian protein of unknown structure.

Overview

The claims and statistics of this paper haven’t been checked yet.

Run the check — free, no account needed. It reads the open-access text and checks the sources it cites.

A few free checks a day · papers already verified open instantly · results are public

Integrity signals

Registry

Crossref · 10.26434/chemrxiv-2023-f6n6p

Cites

1 of 1 references verified0 citation errors · 0 not checkable

Statistics

Figures

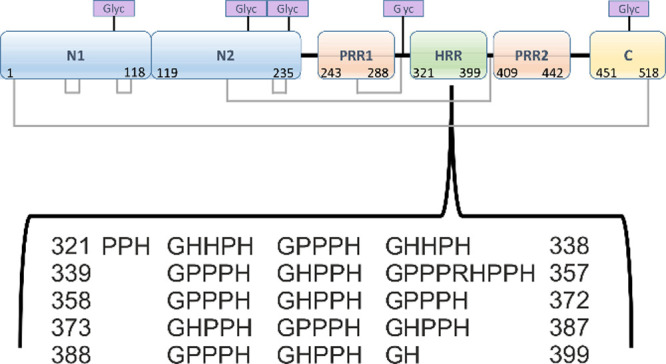
Figure 1 Domain structure of rabbit HRG showing the disulfide bridging arrangements (gray lines, disulfide bonds at positions 6–497, 60–71, 87–108, 185–407, 199–222, and 264–294) and five putative glycosylation sites (predicted asparagine glycosylation sites at positions 107, 184, 232, 302, and 477, indicated by purple boxes). Residue numbers are given with respect to the mature protein, i.e., without the N-terminal signal sequence (comprising the N-terminal eight residues before cleavage). The inset details the primary structure of the HRR (amino acid sequence for residues 321–399), with tandem repeats of the consensus sequence G[H/P][H/P]PH.
Figure 1 Domain structure of rabbit HRG showing the disulfide bridging arrangements (gray lines, disulfide bonds at positions 6–497, 60–71, 87–108, 185–407, 199–222, and 264–294) and five putative glycosylation sites (predicted asparagine glycosylation sites at positions 107, 184, 232, 302, and 477, indicated by purple boxes). Residue numbers are given with respect to the mature protein, i.e., without the N-terminal signal sequence (comprising the N-terminal eight residues before cleavage). The inset details the primary structure of the HRR (amino acid sequence for residues 321–399), with tandem repeats of the consensus sequence G[H/P][H/P]PH.CC BY · PubMed Central
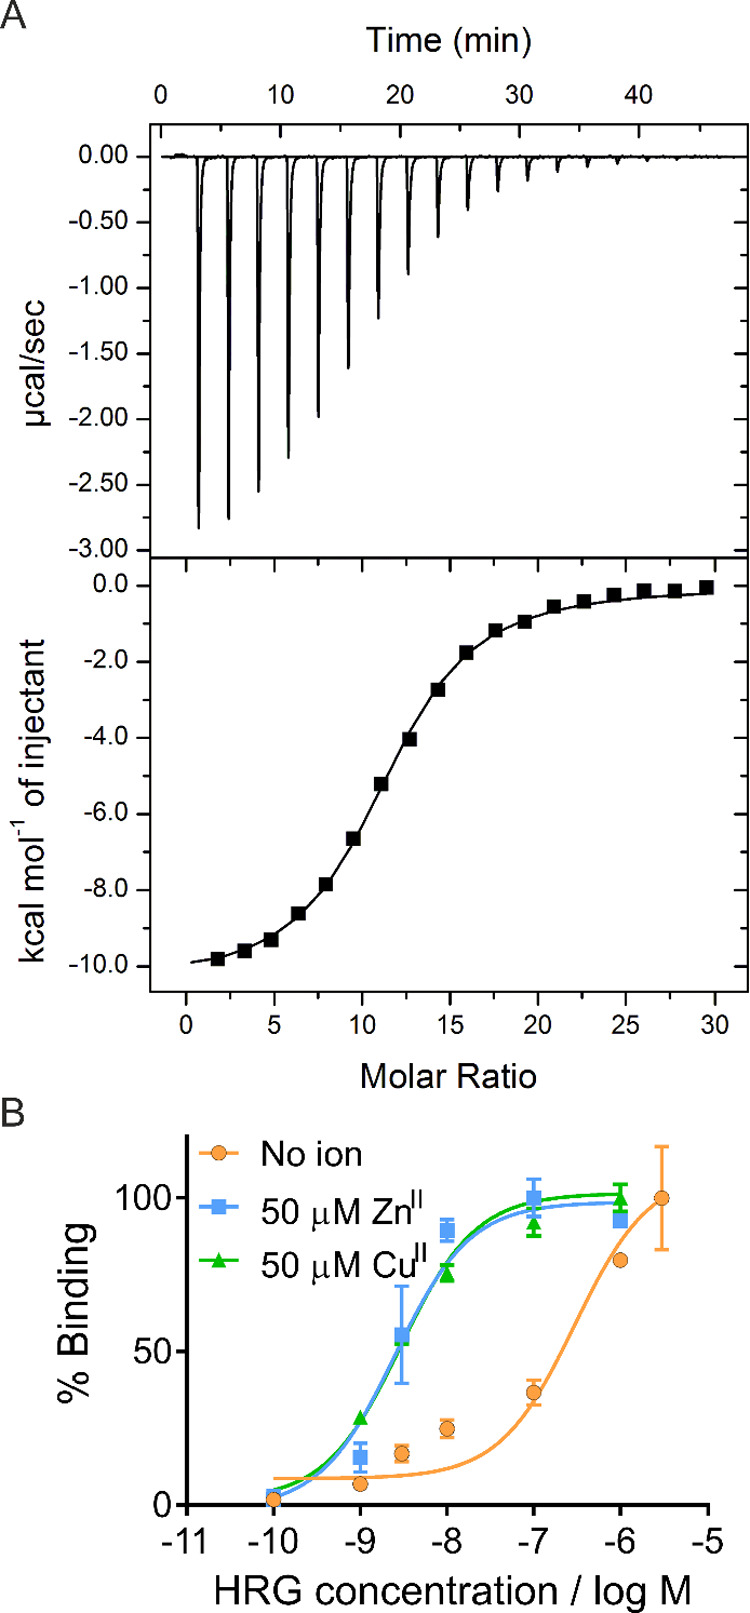
Figure 2 (A) ITC data for CuII binding to HRG. The upper panel shows the resultant raw data, and the lower panel shows the fitted data. Raw data were fitted using a “one-set-of-sites” model in Origin 7.0. From the resultant fit, the number of binding sites N and the dissociation constant (KITC) were determined as N = 11.1 ± 0.1 sites and KITC = (6.3 ± 0.4) × 10–6, respectively. (B) Effect of ZnII and CuII on binding of rabbit HRG to immobilized unfractionated heparin. Assays were performed in triplicate; error bars represent the SEM. The resultant dissociation constants (KD) obtained were (2.98 ± 0.75) × 10–7 in the absence of metal ions, (2.5 ± 0.5) × 10–9 in the presence of 50 μM ZnII, and (2.9 ± 0.5) × 10–9 in the presence of 50 μM CuII.
Figure 2 (A) ITC data for CuII binding to HRG. The upper panel shows the resultant raw data, and the lower panel shows the fitted data. Raw data were fitted using a “one-set-of-sites” model in Origin 7.0. From the resultant fit, the number of binding sites N and the dissociation constant (KITC) were determined as N = 11.1 ± 0.1 sites and KITC = (6.3 ± 0.4) × 10–6, respectively. (B) Effect of ZnII and CuII on binding of rabbit HRG to immobilized unfractionated heparin. Assays were performed in triplicate; error bars represent the SEM. The resultant dissociation constants (KD) obtained were (2.98 ± 0.75) × 10–7 in the absence of metal ions, (2.5 ± 0.5) × 10–9 in the presence of 50 μM ZnII, and (2.9 ± 0.5) × 10–9 in the presence of 50 μM CuII.CC BY · PubMed Central
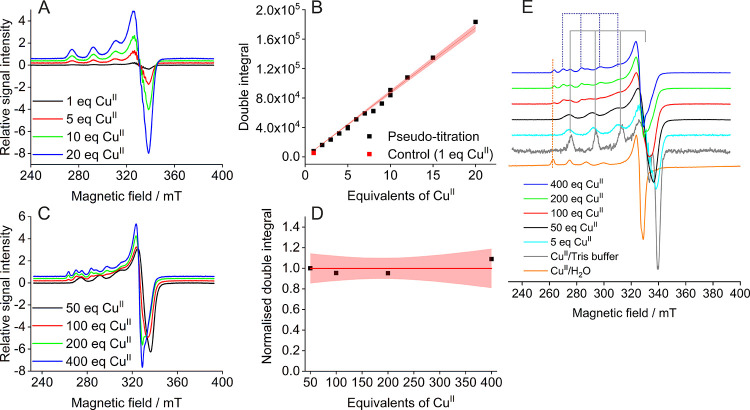
Figure 3 CW EPR spectra. Top row: “Pseudo-titration” series. Two batches of protein were used, and samples at 5 and 10 molar equivalents of CuII were prepared from both batches to test reproducibility. (A) Stacked overlays of selected individual CW EPR spectra from the pseudo-titration series. (B) Quantification by double integrals obtained from the pseudo-titration samples. Linear fit with the 95% confidence band is shown in red. Bottom row: High-load CuII samples. (C) Stacked individual CW EPR spectra. (D) Corresponding double integrals (all samples have 2.5 mM CuII). Constant fit with the 95% confidence band in red. (E) Stacked overlays of normalized CW EPR spectra for samples at 5 molar equivalents of CuII (625 μM CuII) and high CuII loading (all samples have 2.5 mM CuII) and control samples as indicated in the legend for comparison of observed CuII species. Solid gray and dotted blue lines indicate the AII hyperfine splittings for CuII species involving nitrogen in the coordination environment. From 100 molar equivalents of CuII, an additional spectral component could be observed in the HRG samples corresponding to the species observed in the CuII/water control.
Figure 3 CW EPR spectra. Top row: “Pseudo-titration” series. Two batches of protein were used, and samples at 5 and 10 molar equivalents of CuII were prepared from both batches to test reproducibility. (A) Stacked overlays of selected individual CW EPR spectra from the pseudo-titration series. (B) Quantification by double integrals obtained from the pseudo-titration samples. Linear fit with the 95% confidence band is shown in red. Bottom row: High-load CuII samples. (C) Stacked individual CW EPR spectra. (D) Corresponding double integrals (all samples have 2.5 mM CuII). Constant fit with the 95% confidence band in red. (E) Stacked overlays of normalized CW EPR spectra for samples at 5 molar equivalents of CuII (625 μM CuII) and high CuII loading (all samples have 2.5 mM CuII) and control samples as indicated in the legend for comparison of observed CuII species. Solid gray and dotted blue lines indicate the AII hyperfine splittings for CuII species involving nitrogen in the coordination environment. From 100 molar equivalents of CuII, an additional spectral component could be observed in the HRG samples corresponding to the species observed in the CuII/water control.CC BY · PubMed Central
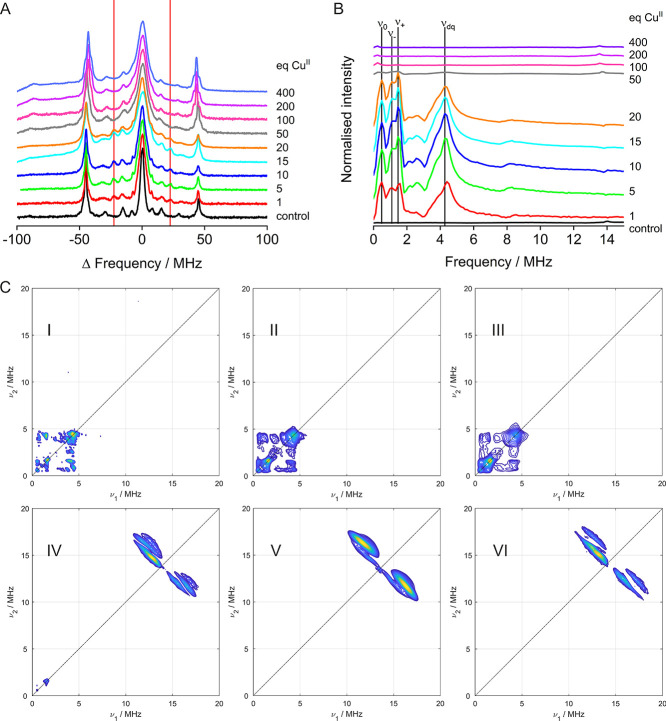
Figure 4 Hyperfine spectroscopy. (A) Stacked plot of EDNMR spectra obtained at Q-band frequencies (34 GHz) and low field (1.0240–1.0630 T) for increased resolution. Vertical lines indicating the additional peaks appearing in the presence of HRG are shown in red. (B) Stacked plots of three-pulse ESEEM data obtained at X-band frequencies (9.5 GHz) and on the maximum of the field-swept spectra. Vertical lines indicate the different frequencies to be expected in the presence of two histidine residues (NQI: ν0, ν+, ν–, DQ: νdq); these were employed for quantitative analysis. (C) (+,+) HYSCORE spectra for 1 (I), 5 (II), 20 (III), 50 (IV), and 400 (V) molar equivalents of CuII and control (VI; 1 equiv CuII in Tris buffer), obtained at X-band frequencies (9.5 GHz) and on the maximum of the field-swept spectra.
Figure 4 Hyperfine spectroscopy. (A) Stacked plot of EDNMR spectra obtained at Q-band frequencies (34 GHz) and low field (1.0240–1.0630 T) for increased resolution. Vertical lines indicating the additional peaks appearing in the presence of HRG are shown in red. (B) Stacked plots of three-pulse ESEEM data obtained at X-band frequencies (9.5 GHz) and on the maximum of the field-swept spectra. Vertical lines indicate the different frequencies to be expected in the presence of two histidine residues (NQI: ν0, ν+, ν–, DQ: νdq); these were employed for quantitative analysis. (C) (+,+) HYSCORE spectra for 1 (I), 5 (II), 20 (III), 50 (IV), and 400 (V) molar equivalents of CuII and control (VI; 1 equiv CuII in Tris buffer), obtained at X-band frequencies (9.5 GHz) and on the maximum of the field-swept spectra.CC BY · PubMed Central
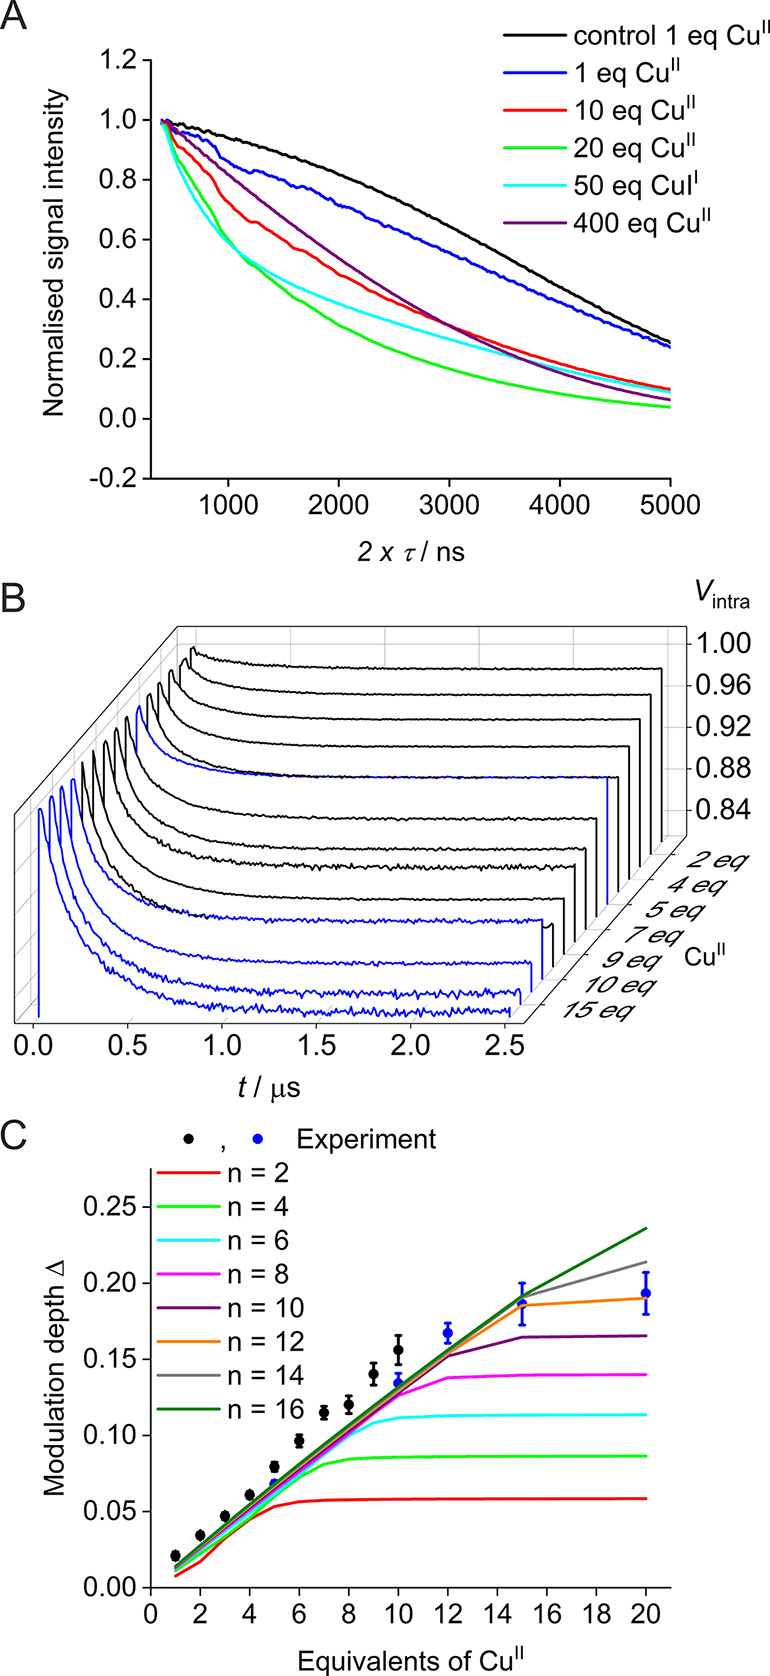
Figure 5 (A) Two-pulse decay for selected samples (zoom-in, for the full x axis, see Figure S13). (B) Waterfall plot of background-corrected PELDOR traces (for raw traces, see Figure S15) obtained from the pseudo-titration series of HRG and CuII. Samples were either prepared from the initial batch of purified HRG (black lines) or from the second batch of HRG (blue lines). (C) Corresponding mean modulation depths (±2 × σ error) as obtained from the pseudo-titration series of HRG and CuII. Samples containing 1 to 10 molar equivalents of CuII (black scatter) were prepared from the initial batch of purified HRG. A second batch of HRG was purified to further increase the equivalents of CuII (blue scatter) to observe saturation of the high-affinity binding sites. Solid lines show simulations of PELDOR modulation depths based on the speciation model corresponding to values of n = [2, 4, 6, 8, 10, 12, 14, 16]. (Simulations were performed with the following other parameters: [P]0 = 1.25 × 10⁻⁴ M, [M]0 = [0.125, 0.250, 0.375, 0.500, 0.675, 0.750, 0.875, 1.000, 1.125, 1.250, 1.500, 1.875, 2.500] × 10–3 M, KD1 = 5 × 10⁻⁸, m = 3, KD2 = 10 × 10–6, and λ = 0.015. For further details on the model, see SI.)
Figure 5 (A) Two-pulse decay for selected samples (zoom-in, for the full x axis, see Figure S13). (B) Waterfall plot of background-corrected PELDOR traces (for raw traces, see Figure S15) obtained from the pseudo-titration series of HRG and CuII. Samples were either prepared from the initial batch of purified HRG (black lines) or from the second batch of HRG (blue lines). (C) Corresponding mean modulation depths (±2 × σ error) as obtained from the pseudo-titration series of HRG and CuII. Samples containing 1 to 10 molar equivalents of CuII (black scatter) were prepared from the initial batch of purified HRG. A second batch of HRG was purified to further increase the equivalents of CuII (blue scatter) to observe saturation of the high-affinity binding sites. Solid lines show simulations of PELDOR modulation depths based on the speciation model corresponding to values of n = [2, 4, 6, 8, 10, 12, 14, 16]. (Simulations were performed with the following other parameters: [P]0 = 1.25 × 10⁻⁴ M, [M]0 = [0.125, 0.250, 0.375, 0.500, 0.675, 0.750, 0.875, 1.000, 1.125, 1.250, 1.500, 1.875, 2.500] × 10–3 M, KD1 = 5 × 10⁻⁸, m = 3, KD2 = 10 × 10–6, and λ = 0.015. For further details on the model, see SI.)CC BY · PubMed Central

Verification

Claims the paper makes

The claims and statistics of this paper haven’t been checked yet.

Run the check — free, no account needed. It reads the open-access text and checks the sources it cites.

A few free checks a day · papers already verified open instantly · results are public

Self-check

Percentages, sums and reported differences re-computed from the paper’s own numbers.

The self-check needs the paper’s full text.

Citations

Cites

Show all 1 references

Metadata

Authors
Ackermann, K., Khazaipoul, S., Wort, J., Sobczak, A., ElMkami, H., Stewart, A., & Bode, B.
Affiliations
  • University of St Andrews (GB)
  • University of St Andrews
Corresponding author
  • Stewart, Alan
  • Bode, Bela
Venue
Journal of the American Chemical Society
Published
2023-01-11
Volume
145
Issue
14
Pages
8064-8072
ISSN
0002-7863 (ISSN-L)
OpenAlex
W4362460408
Cited by
24
References
1
Citations by year
2026: 6 · 2025: 6 · 2024: 9 · 2023: 3
FWCI
2.90
Type
journal article
Language
en
Open access
Locations
  • Journal of the American Chemical Society (publishedVersion, cc-by)
  • ChemRxiv (acceptedVersion, cc-by)
  • PubMed Central (publishedVersion, cc-by)
  • PubMed (publishedVersion)
  • St Andrews Research Repository (St Andrews Research Repository) (submittedVersion, cc-by)
Funders
  • Wellcome Trust (204821/Z/16/Z)
  • British Heart Foundation (PG/15/9/31270, FS/15/42/31556)
  • Leverhulme Trust (RPG-2018–397)
  • Biotechnology and Biological Sciences Research Council (BB/R013780/1, BB/T017740/1)
Topics
  • Physical Sciences › Chemistry › Spectroscopy › Electron Spin Resonance Studies
  • Life Sciences › Biochemistry, Genetics and Molecular Biology › Molecular Biology › Protein Structure and Dynamics
  • Life Sciences › Biochemistry, Genetics and Molecular Biology › Structural Biology › Enzyme Structure and Function
Keywords
histidine-rich glycoprotein, metal binding sites, zinc binding, divalent metal ions, intrinsically disordered regions, native protein structure, secondary structure prediction, protein tertiary structure prediction, electron spin resonance, plasma glycoproteins
MeSH terms
Histidine-Rich Glycoprotein, Animals, Binding Sites, Blood Coagulation, Glycoproteins, Mammals

About these checks

Registry, retraction, Cites and statistics results are computed, not judged, with one exception: a printed reference that no index lists is read once by a model before it counts as a citation error. Claims are extracted by a model and kept only when their quote appears verbatim in the text; each cited source is then checked, with a model’s help, for whether it says what the claim relies on. Those verdicts can be wrong — read the claim’s quote and the cited source before relying on one.

Statistics and arithmetic are recomputed, not judged.

Confidence bands are shown only for fields calibrated on our annotated test set. None is calibrated yet, so no band is shown.

What counts as a claim ›How we measure confidence ›How we check this ›

Are you an author, or do you see a problem with this page? Request a review

How to cite

Cite CoChat for the checks on this page, and the paper for its own findings.

This page
CoChat. (2026). Citation check: Investigating Native Metal Ion Binding Sites in Mammalian Histidine-Rich Glycoprotein. https://app.cochat.ai/papers/10.26434/chemrxiv-2023-f6n6p
The paper
Ackermann, K., Khazaipoul, S., Wort, J., Sobczak, A., ElMkami, H., Stewart, A., & Bode, B. (2023). Investigating Native Metal Ion Binding Sites in Mammalian Histidine-Rich Glycoprotein. Journal of the American Chemical Society. https://doi.org/10.26434/chemrxiv-2023-f6n6p