

The DOI matches its Crossref record; 1 of the 1 references it cites were found in a registry or an index.
Docking-informed machine learning for kinome wide affinity prediction
Open accessPreprint — published as 10.1021/acs.jcim.4c01260 · Paper page
Abstract
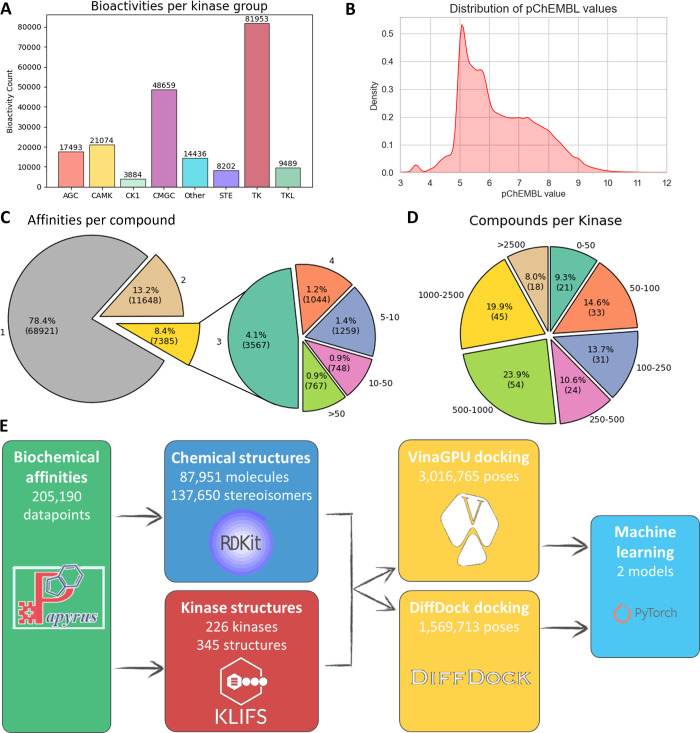
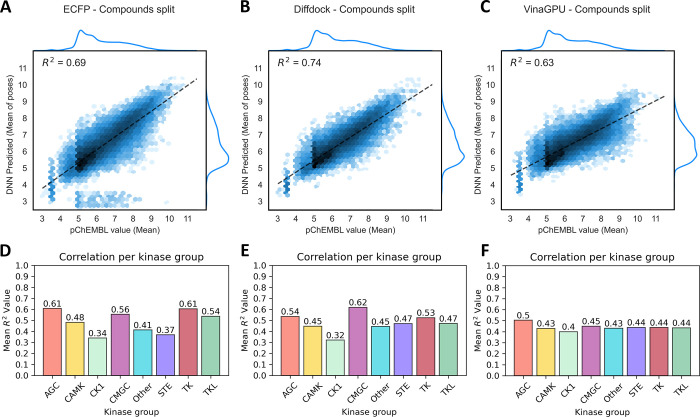
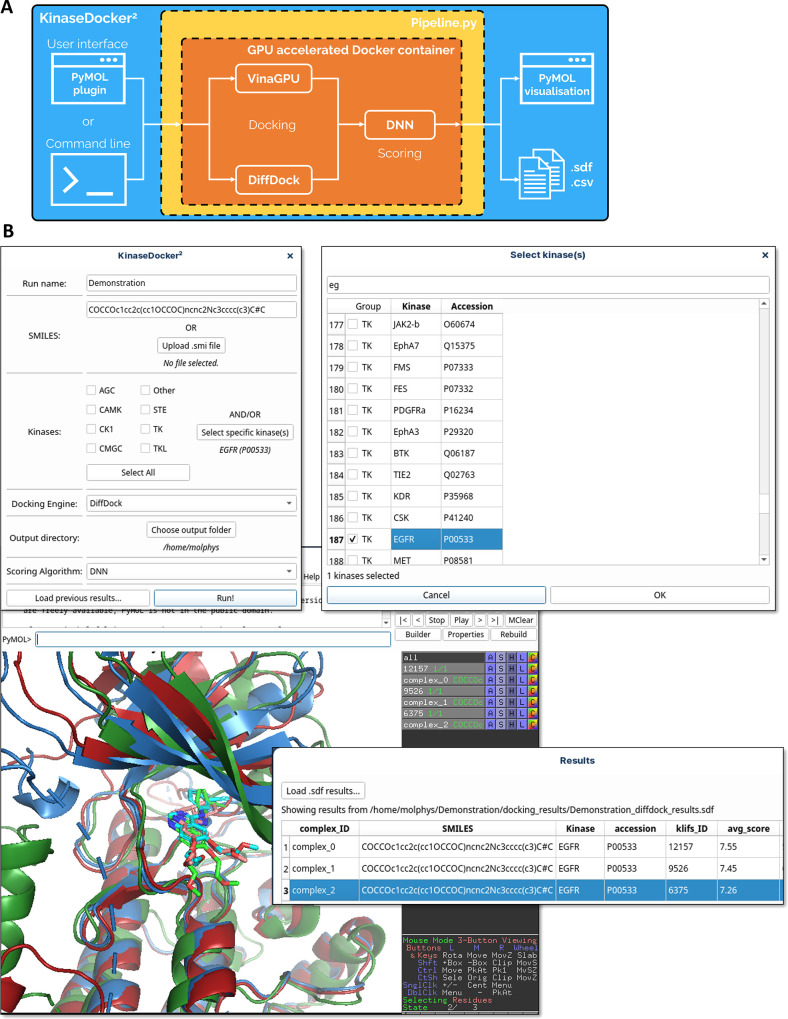
Kinase inhibitors are an important class of anti-cancer drugs, with 80 inhibitors clinically approved, and >100 in active clinical testing. Most bind competitively in the ATP-binding site, leading to challenges with selectivity for a specific kinase, resulting in risks for toxicity and general off-target effects. Assessing the binding of an inhibitor for the entire kinome is experimentally possible but expensive. A reliable and interpretable computational prediction of kinase selectivity would greatly benefit the inhibitor discovery and optimisation process. Here, we use machine learning on docked poses to address this need. To this end, we aggregated all known inhibitor-kinase affinities and generated the complete accompanying 3D interactome by docking all inhibitors to the respective high quality X-ray structures. We then used this resource to train a neural network as a kinase-specific scoring function, which achieved an overall performance (R²) of 0.63-0.74 on unseen inhibitors across the kinome. The entire pipeline from molecule to 3D-based affinity prediction has been fully automated and wrapped in a freely available package. This has a graphical user interface which is tightly integrated with PyMOL to allow immediate adoption in the medicinal chemistry practice.
Overview
The claims and statistics of this paper haven’t been checked yet.
Run the check — free, no account needed. It reads the open-access text and checks the sources it cites.
Integrity signals
Registry
Cites
Statistics
Figures
Verification
Claims the paper makes
The claims and statistics of this paper haven’t been checked yet.
Run the check — free, no account needed. It reads the open-access text and checks the sources it cites.
Self-check
Percentages, sums and reported differences re-computed from the paper’s own numbers.
The self-check needs the paper’s full text.
Citations
Cites
Highly accurate protein structure prediction with AlphaFold
Jumper, J., Evans, R., Pritzel, A., Green, T., Figurnov, M., Ronneberger, O., Tunyasuvunakool, K., Bates, R., Žídek, A., Potapenko, A., et al. (2021) · Nature · doi:10.1038/s41586-021-03819-2 · Cited by 43,764
Metadata
- Authors
- Schifferstein, J., Bernatavicius, A., & Janssen, A. P. A.
- Affiliations
- Leiden University (NL)
- Corresponding author
- Janssen, Antonius P.A.
- Venue
- Journal of Chemical Information and Modeling
- Publisher
- American Chemical Society (ACS)
- Published
- 2024-04-03
- Volume
- 64
- Issue
- 24
- Pages
- 9196-9204
- ISSN
- 1549-9596 (ISSN-L)
- PMC
- PMC11684025
- OpenAlex
- W4405222290
- Cited by
- 8
- References
- 1
- Citations by year
- 2026: 5 · 2025: 3
- FWCI
- 1.70
- Type
- journal article
- Language
- en
- Open access
- hybrid
- doi.org
- Locations
- Journal of Chemical Information and Modeling (publishedVersion, cc-by)
- ChemRxiv (acceptedVersion, cc-by-nc)
- PubMed Central (publishedVersion, cc-by)
- PubMed (publishedVersion)
- Leiden Repository (Leiden University) (submittedVersion, cc-by)
- Funders
- Oncode Institute
- Topics
- Life Sciences › Pharmacology, Toxicology and Pharmaceutics › Drug Discovery › Computational Drug Discovery Methods
- Physical Sciences › Materials Science › Materials Chemistry › Machine Learning in Materials Science
- Life Sciences › Biochemistry, Genetics and Molecular Biology › Molecular Biology › Protein Degradation and Inhibitors
- Keywords
- kinase inhibitors, kinase selectivity, binding affinity prediction, inhibitor discovery, off-target toxicity, X-ray structure
- MeSH terms
- Machine Learning, Binding Sites, Humans, Protein Binding, Protein Conformation, Protein Kinases, Protein Kinase Inhibitors, Molecular Docking Simulation
About these checks
Registry, retraction, Cites and statistics results are computed, not judged, with one exception: a printed reference that no index lists is read once by a model before it counts as a citation error. Claims are extracted by a model and kept only when their quote appears verbatim in the text; each cited source is then checked, with a model’s help, for whether it says what the claim relies on. Those verdicts can be wrong — read the claim’s quote and the cited source before relying on one.
Statistics and arithmetic are recomputed, not judged.
Confidence bands are shown only for fields calibrated on our annotated test set. None is calibrated yet, so no band is shown.
What counts as a claim ›How we measure confidence ›How we check this ›
Are you an author, or do you see a problem with this page? Request a review
