

The DOI matches its Crossref record; 14 of the 14 references it cites were found in a registry or an index.
Robust point and variance estimation for ecological and evolutionary meta-analyses with selective reporting and dependent effect sizes
Abstract
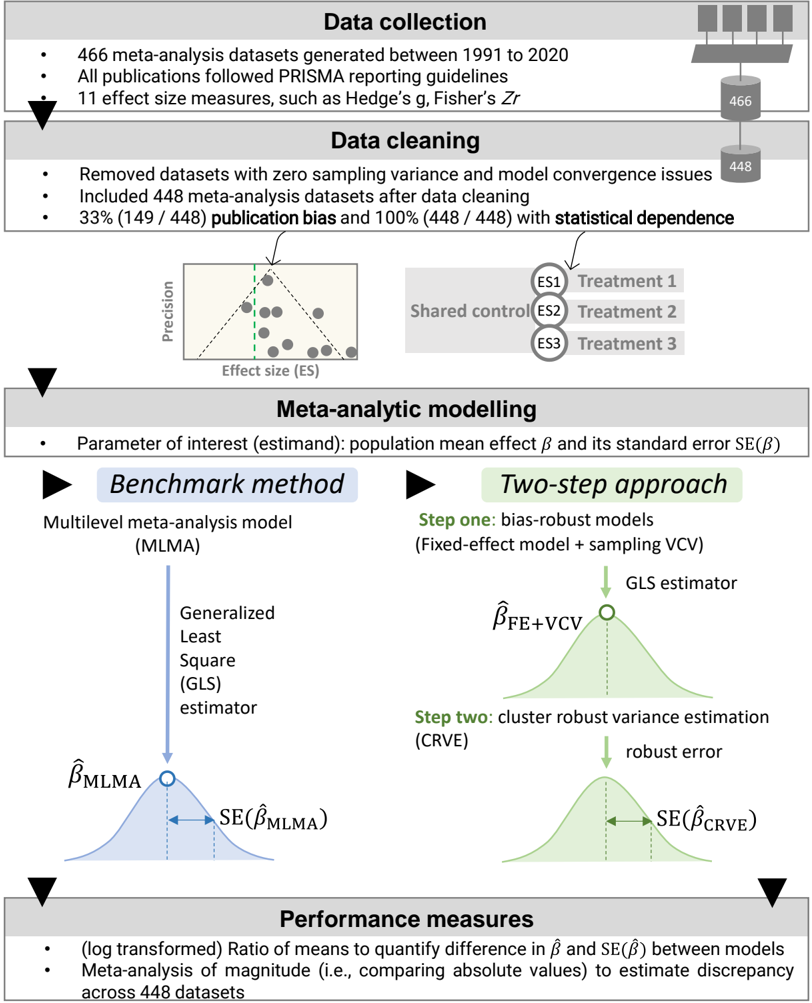
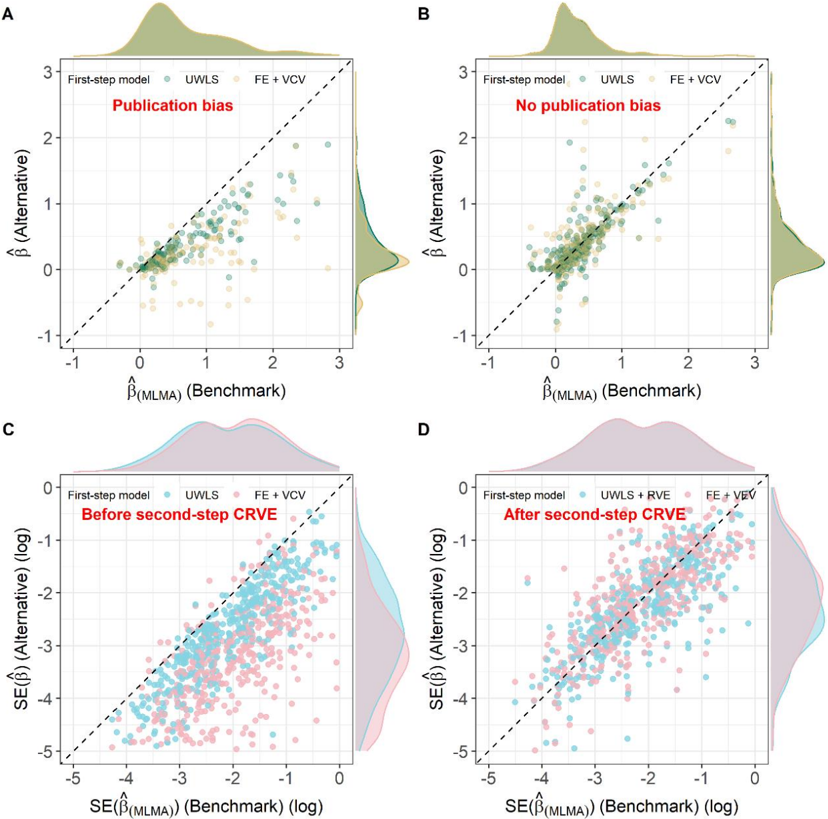
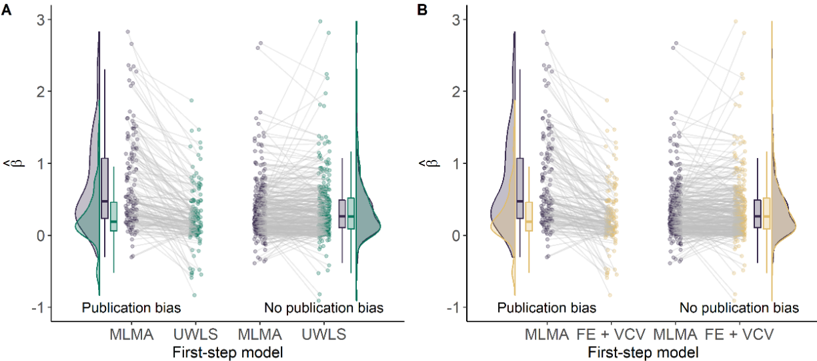
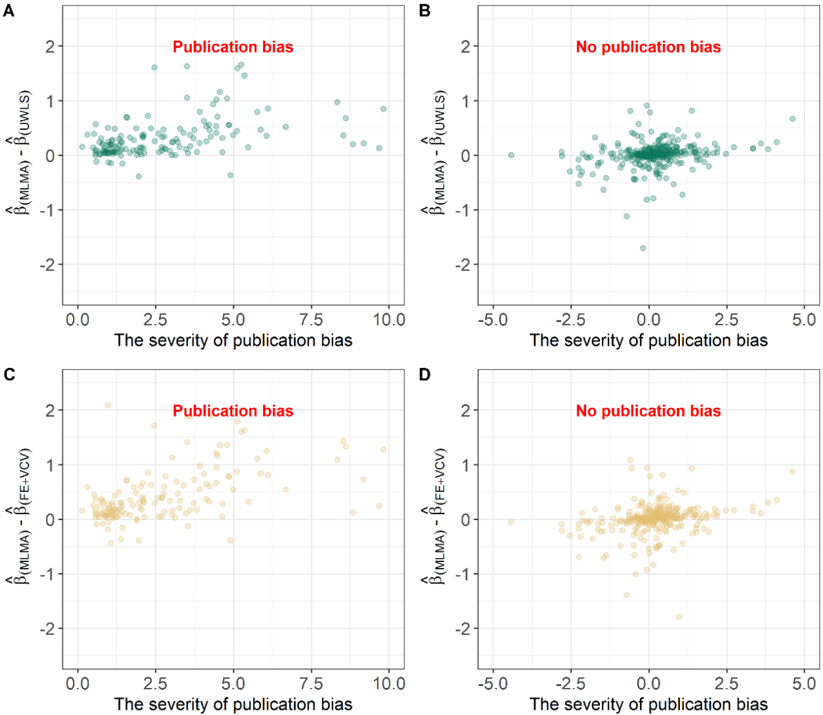
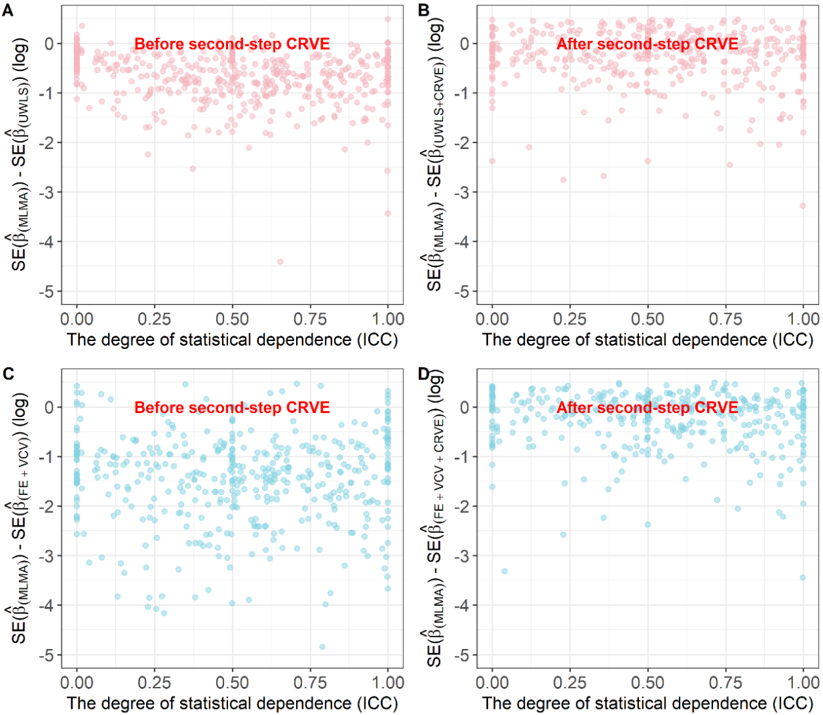
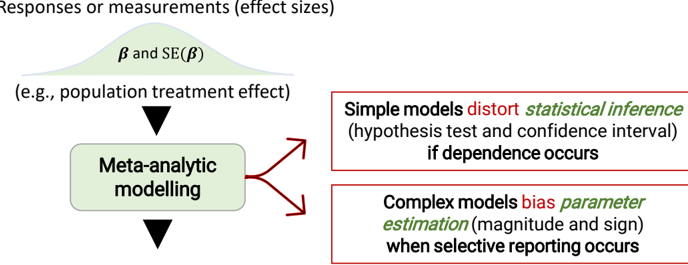
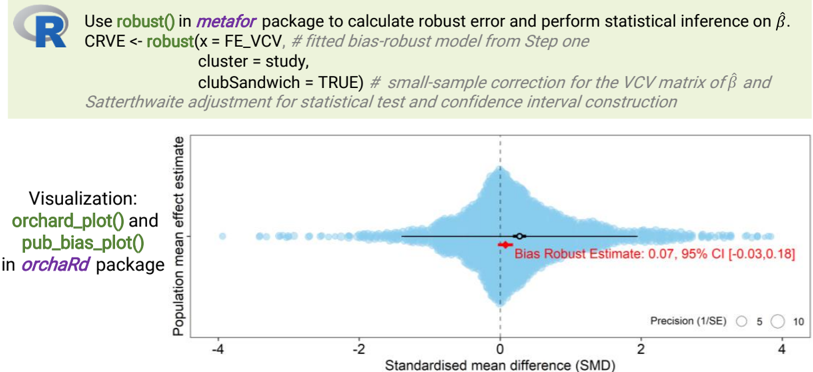
Meta-analysis produces a quantitative synthesis of evidence-based knowledge, shaping not only research trends but also policy and practices in ecology and evolution. However, two statistical issues, selective reporting and statistical dependence, can severally distort meta-analytic evidence. Here, we propose a two-step procedure to tackle these challenges concurrently and re-analyse 448 ecological and evolutionary meta-analyses. First, we employ bias-robust weighting schemes under the generalized least square estimator to obtain less biased population mean effect sizes by mitigating selective reporting. Second, we use cluster-robust variance estimation to account for statistical dependence and reduce bias in estimating standard errors, ensuring valid statistical inference. Re-analyses of 448 meta-analyses show that ignoring the two issues tends to overestimate effect sizes by an average of 110% and underestimate standard errors by 120%. Our approach is effective at mitigating these biases in meta-analytic evidence. To facilitate the implementation, we have developed a website showing the step-by-step tutorial available on our website. Complementing the current meta-analytic practice with the proposed method can facilitate a transition to a more pluralistic approach in quantitative evidence synthesis in ecology and evolution.
Overview
The claims and statistics of this paper haven’t been checked yet.
Run the check — free, no account needed. It reads the open-access text and checks the sources it cites.
Integrity signals
Registry
Cites
Statistics
Figures
Verification
Claims the paper makes
The claims and statistics of this paper haven’t been checked yet.
Run the check — free, no account needed. It reads the open-access text and checks the sources it cites.
Claims other papers make about this one
Each is checked against this paper’s own text: does it say what the citing paper says it does?
In the citing paper
“Publication bias was visually assessed via funnel plots for multilevel meta-analysis using the code provided by Fernández-Castilla and colleagues243, and formally with the three-level version of Egger’s regression test244,245.”
From Prevalence and severity of mental health problems in early-career researchers: a systematic review and meta-analysis (2026) · cites this paper as [245]
Self-check
Percentages, sums and reported differences re-computed from the paper’s own numbers.
The self-check needs the paper’s full text.
Citations
Cites
Publication bias in the social sciences: Unlocking the file drawer
Franco, A., Malhotra, N., & Simonovits, G. (2014) · Science · doi:10.1126/science.1255484 · Cited by 1,542
Cheung, M. W.-L. (2014) · Psychological Methods · doi:10.1037/a0032968 · Cited by 1,342
Publication bias in meta-analysis its causes and consequences
Thornton, A. (2000) · Journal of Clinical Epidemiology · doi:10.1016/s0895-4356(99)00161-4 · Cited by 1,291
Methodological issues and advances in biological meta-analysis
Nakagawa, S., & Santos, E. S. A. (2012) · Evolutionary Ecology · doi:10.1007/s10682-012-9555-5 · Cited by 1,032
Self-citationStanley, T. D., & Doucouliagos, H. (2014) · Research Synthesis Methods · doi:10.1002/jrsm.1095 · Cited by 916
Multivariate meta-analysis for non-linear and other multi-parameter associations
Gasparrini, A., Armstrong, B., & Kenward, M. G. (2012) · Statistics in Medicine · doi:10.1002/sim.5471 · Cited by 772
Meta-analysis with robust variance estimation: Expanding the range of working models
Pustejovsky, J. E., & Tipton, E. (2022) · Prevention Science · doi:10.1007/s11121-021-01246-3 · Cited by 737
Meta-evaluation of meta-analysis: ten appraisal questions for biologists
Nakagawa, S., Noble, D. W. A., Senior, A. M., & Lagisz, M. (2017) · BMC Biology · doi:10.1186/s12915-017-0357-7 · Cited by 579
Self-citationA simple confidence interval for meta-analysis
Sidik, K., & Jonkman, J. N. (2002) · Statistics in Medicine · doi:10.1002/sim.1262 · Cited by 431
Meta-assessment of bias in science
Fanelli, D., Costas, R., & Ioannidis, J. P. A. (2017) · Proceedings of the National Academy of Sciences · doi:10.1073/pnas.1618569114 · Cited by 364
Heterogeneity in ecological and evolutionary meta‐analyses: its magnitude and implications
Senior, A. M., Grueber, C. E., Kamiya, T., Lagisz, M., O'Dwyer, K., Santos, E. S. A., & Nakagawa, S. (2016) · Ecology · doi:10.1002/ecy.1591 · Cited by 299
Self-citationA multivariate mixed linear model for meta-analysis.
Kalaian, H. A., & Raudenbush, S. W. (1996) · Psychological Methods · doi:10.1037/1082-989x.1.3.227 · Cited by 229
Neither fixed nor random: weighted least squares meta‐regression
Stanley, T. D., & Doucouliagos, H. (2017) · Research Synthesis Methods · doi:10.1002/jrsm.1211 · Cited by 205
Accounting for heterogeneity via random-effects models and moderator analyses in meta-analysis.
Viechtbauer, W. (2007) · Zeitschrift für Psychologie / Journal of Psychology · doi:10.1027/0044-3409.215.2.104 · Cited by 193
Research works printed but not linked: 22
- Nakagawa, S., Yang, Y., Macartney, E. L., Spake, R. & Lagisz, M. Quantitative evidence synthesis: a practical guide on meta-analysis, meta-regression, and publication bias tests for environmental sciences. Environmental Evidence 12, 8, doi:10.1186/s13750- 023-00301-6 (2023). · DOI
- Pigott, T. D. & Polanin, J. R. Methodological guidance paper: High-quality meta- analysis in a systematic review. Review of Educational Research 90, 24-46 (2020).
- Cheung, M. W.-L. A guide to conducting a meta-analysis with non-independent effect sizes. Neuropsychology review 29, 387-396 (2019).
- Hansen, C., Steinmetz, H. & Block, J. 1-19 (Springer, 2021).
- Stanley, T. D. et al. Meta-analysis of economics research reporting guidelines. Journal of economic surveys 27, 390-394 (2013).
- Andrews, I. & Kasy, M. Identification of and correction for publication bias. American Economic Review 109, 2766-2794 (2019).
- Borenstein, M., Hedges, L. V., Higgins, J. P. & Rothstein, H. R. Introduction to meta- analysis. (John Wiley & Sons, 2021).
- Cheung, M. W.-L. Multivariate meta-analysis as structural equation models. Structural Equation Modeling: A Multidisciplinary Journal 20, 429-454 (2013).
- Pustejovsky, J. E. & Tipton, E. Small-sample methods for cluster-robust variance estimation and hypothesis testing in fixed effects models. Journal of Business & Economic Statistics 36, 672-683 (2018).
- Sidik, K. & Jonkman, J. N. A note on variance estimation in random effects meta- regression. Journal of biopharmaceutical statistics 15, 823-838 (2005).
- Rosenthal, R. The file drawer problem and tolerance for null results. Psychological bulletin 86, 638-641 (1979).
- Head, M. L., Holman, L., Lanfear, R., Kahn, A. T. & Jennions, M. D. The extent and consequences of p-hacking in science. PLoS biology 13, e1002106 (2015).
- Sterne, J. A., Gavaghan, D. & Egger, M. Publication and related bias in meta-analysis: power of statistical tests and prevalence in the literature. Journal of clinical epidemiology 53, 1119-1129 (2000).
- Bramley, P., López-López, J. A. & Higgins, J. P. T. Examining how meta-analytic methods perform in the presence of bias: A simulation study. Research Synthesis Methods 12, 816-830, doi:https://doi.org/10.1002/jrsm.1516 (2021). · DOI
- Morrissey, M. B. Meta-analysis of magnitudes, differences and variation in evolutionary parameters. Journal of Evolutionary Biology 29, 1882-1904 (2016).
- Viechtbauer, W. Conducting meta-analyses in R with the metafor package. Journal of statistical software 36, 1-48 (2010).
- Bird, G., Kaczvinsky, C., Wilson, A. E. & Hardy, N. B. When do herbivorous insects compete? A phylogenetic meta-analysis. Ecology Letters 22, 875-883 (2019).
- Nakagawa, S. et al. A robust and readily implementable method for the meta- analysis of response ratios with and without missing standard deviations. Ecology Letters 26, 232-244 (2023).
- Moher, D., Liberati, A., Tetzlaff, J., Altman, D. G. & Group, P. Preferred reporting items for systematic reviews and meta-analyses: the PRISMA statement. PLoS med 6, e1000097 (2009).
- Searle, S. R. Another Look at Henderson's Methods of Estimating Variance Components. Biometrics 24, 749-787, doi:10.2307/2528870 (1968). · DOI
- Hartung, J. An alternative method for meta-analysis. Biometrical Journal: Journal of Mathematical Methods in Biosciences 41, 901-916 (1999).
- Rosenfeld, A. H. The particle data group: Growth and operations-eighteen years of particle physics. Annual Review of Nuclear Science 25, 555-598 (1975).
Cited by
Sorted by citations
Dreisoerner, A., Goetz, V., Frohnmayer, D., Tran, U. S., Voracek, M., & Nater, U. M. (2026) · Nature Human Behaviour · doi:10.1038/s41562-026-02505-5 · Cited by 2
Metadata
- Authors
- Yang, Y., Lagisz, M., Williams, C., Pan, J., Noble, D., & Nakagawa, S.
- Publisher
- California Digital Library (CDL)
- Published
- 2023-10-03
- Cited by
- 2
- References
- 14
- Type
- Preprint
About these checks
Registry, retraction, Cites and statistics results are computed, not judged, with one exception: a printed reference that no index lists is read once by a model before it counts as a citation error. Claims are extracted by a model and kept only when their quote appears verbatim in the text; each cited source is then checked, with a model’s help, for whether it says what the claim relies on. Those verdicts can be wrong — read the claim’s quote and the cited source before relying on one.
Statistics and arithmetic are recomputed, not judged.
Confidence bands are shown only for fields calibrated on our annotated test set. None is calibrated yet, so no band is shown.
What counts as a claim ›How we measure confidence ›How we check this ›
Are you an author, or do you see a problem with this page? Request a review
