Cited by 101Reproductive tract infections researchHIV/AIDS Research and InterventionsHealth Systems, Economic Evaluations, Quality of Life

The DOI matches its Crossref record; 128 of the 132 references it cites were found in a registry or an index.

Effectiveness and cost-effectiveness of traditional and new partner notification technologies for curable sexually transmitted infections: observational study, systematic reviews and mathematical modelling

Open access

Abstract

BACKGROUND: Partner notification is essential to the comprehensive case management of sexually transmitted infections. Systematic reviews and mathematical modelling can be used to synthesise information about the effects of new interventions to enhance the outcomes of partner notification. OBJECTIVE: To study the effectiveness and cost-effectiveness of traditional and new partner notification technologies for curable sexually transmitted infections (STIs). DESIGN: Secondary data analysis of clinical audit data; systematic reviews of randomised controlled trials (MEDLINE, EMBASE and Cochrane Central Register of Controlled Trials) published from 1 January 1966 to 31 August 2012 and of studies of health-related quality of life (HRQL) [MEDLINE, EMBASE, ISI Web of Knowledge, NHS Economic Evaluation Database (NHS EED), Database of Abstracts of Reviews of Effects (DARE) and Health Technology Assessment (HTA)] published from 1 January 1980 to 31 December 2011; static models of clinical effectiveness and cost-effectiveness; and dynamic modelling studies to improve parameter estimation and examine effectiveness. SETTING: General population and genitourinary medicine clinic attenders. PARTICIPANTS: Heterosexual women and men. INTERVENTIONS: Traditional partner notification by patient or provider referral, and new partner notification by expedited partner therapy (EPT) or its UK equivalent, accelerated partner therapy (APT). MAIN OUTCOME MEASURES: Population prevalence; index case reinfection; and partners treated per index case. RESULTS: Enhanced partner therapy reduced reinfection in index cases with curable STIs more than simple patient referral [risk ratio (RR) 0.71; 95% confidence interval (CI) 0.56 to 0.89]. There are no randomised trials of APT. The median number of partners treated for chlamydia per index case in UK clinics was 0.60. The number of partners needed to treat to interrupt transmission of chlamydia was lower for casual than for regular partners. In dynamic model simulations, >10% of partners are chlamydia positive with look-back periods of up to 18 months. In the presence of a chlamydia screening programme that reduces population prevalence, treatment of current partners achieves most of the additional reduction in prevalence attributable to partner notification. Dynamic model simulations show that cotesting and treatment for chlamydia and gonorrhoea reduce the prevalence of both STIs. APT has a limited additional effect on prevalence but reduces the rate of index case reinfection. Published quality-adjusted life-year (QALY) weights were of insufficient quality to be used in a cost-effectiveness study of partner notification in this project. Using an intermediate outcome of cost per infection diagnosed, doubling the efficacy of partner notification from 0.4 to 0.8 partners treated per index case was more cost-effective than increasing chlamydia screening coverage. CONCLUSIONS: There is evidence to support the improved clinical effectiveness of EPT in reducing index case reinfection. In a general heterosexual population, partner notification identifies new infected cases but the impact on chlamydia prevalence is limited. Partner notification to notify casual partners might have a greater impact than for regular partners in genitourinary clinic populations. Recommendations for future research are (1) to conduct randomised controlled trials using biological outcomes of the effectiveness of APT and of methods to increase testing for human immunodeficiency virus (HIV) and STIs after APT; (2) collection of HRQL data should be a priority to determine QALYs associated with the sequelae of curable STIs; and (3) standardised parameter sets for curable STIs should be developed for mathematical models of STI transmission that are used for policy-making. FUNDING: The National Institute for Health Research Health Technology Assessment programme.

Overview

The claims and statistics of this paper haven’t been checked yet.

Run the check — free, no account needed. It reads the open-access text and checks the sources it cites.

A few free checks a day · papers already verified open instantly · results are public

Integrity signals

Registry

Crossref · 10.3310/hta18020

Cites

128 of 128 references verified0 citation errors · 0 not checkable

Statistics

Figures
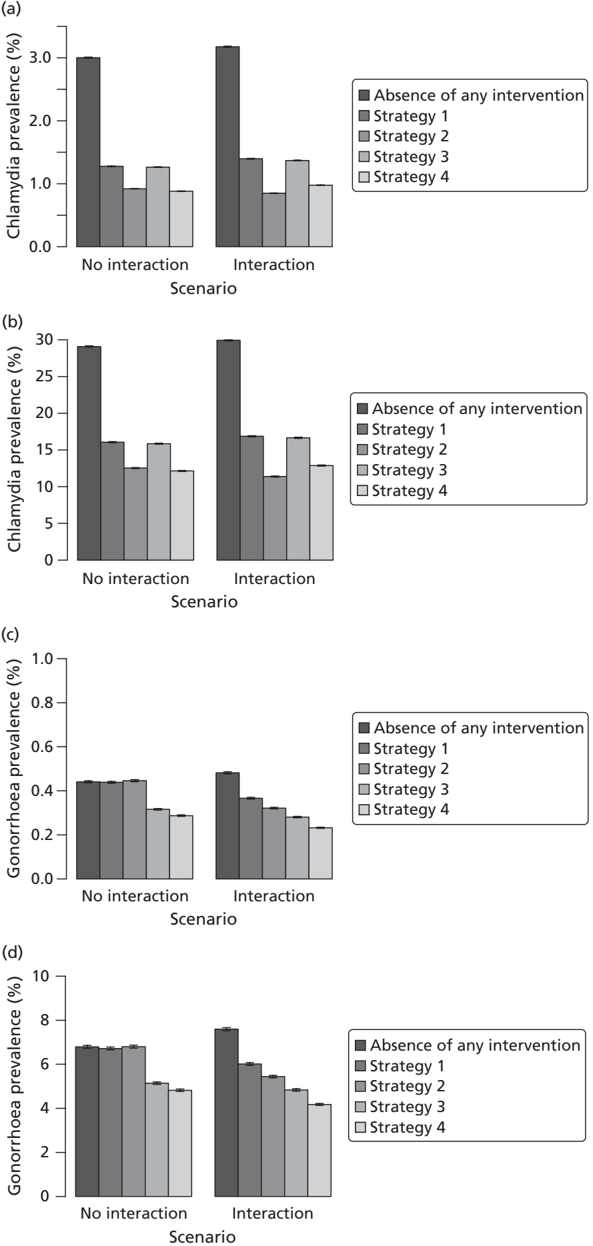
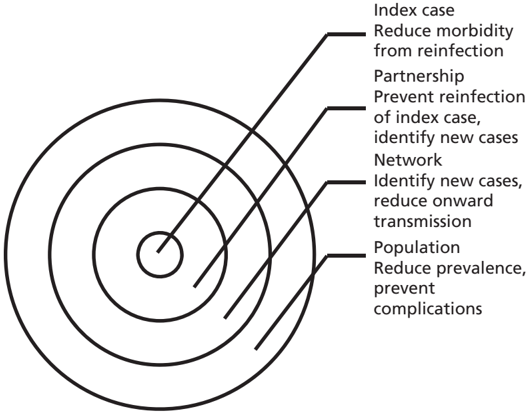
FIGURE 1 Levels and outcomes of partner notification. Adapted from Low et al. 4
FIGURE 1 Levels and outcomes of partner notification. Adapted from Low et al. 4CC-BY · From the PDF
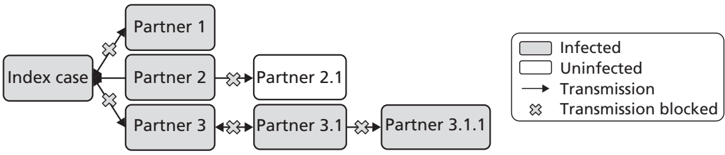
FIGURE 2 Mechanisms of action of partner notification in three different partnership types. Partner 1: ongoing regular partnership. Partner notification leads to identification of Partner 1; treatment prevents reinfection between index case and Partner 1; Partner 2: terminated partnership. Partner 2 was the source of index case infection. Partner notification identifies Partner 2 as a new index case; treatment prevents transmission to Partner 2.1; Partner 3: ongoing regular partnership of Partner 3 with index case and casual partnership with Partner 3.1. Partner notification prevents reinfection; partner notification identifies Partner 3 and Partner 3.1 as new index cases; treatment prevents transmission to Partner 3.1.1.
FIGURE 2 Mechanisms of action of partner notification in three different partnership types. Partner 1: ongoing regular partnership. Partner notification leads to identification of Partner 1; treatment prevents reinfection between index case and Partner 1; Partner 2: terminated partnership. Partner 2 was the source of index case infection. Partner notification identifies Partner 2 as a new index case; treatment prevents transmission to Partner 2.1; Partner 3: ongoing regular partnership of Partner 3 with index case and casual partnership with Partner 3.1. Partner notification prevents reinfection; partner notification identifies Partner 3 and Partner 3.1 as new index cases; treatment prevents transmission to Partner 3.1.1.CC-BY · From the PDF
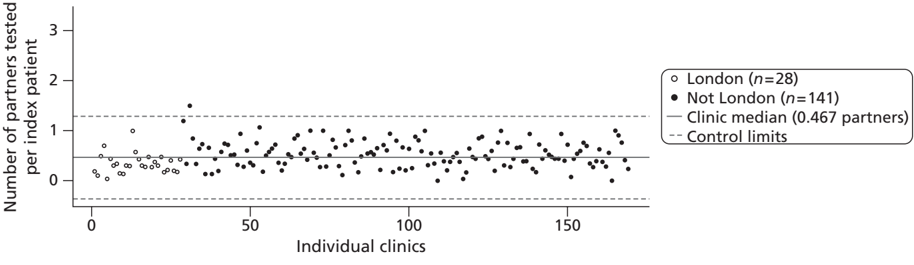
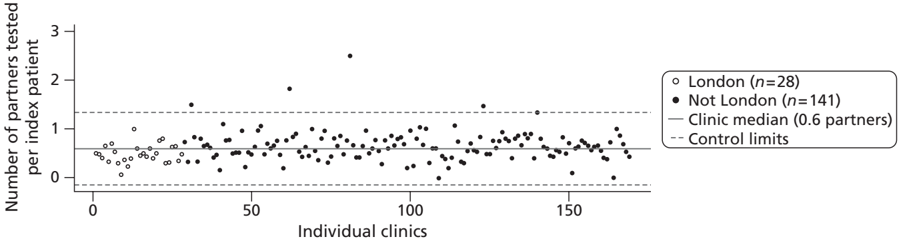
FIGURE 5 Control chart for partners tested for chlamydia per index case. Combined outcome was defined as outcome verified by a health-care worker or, if data were missing, as reported by the patient. All cases were included and those with missing data were coded as having zero partners tested.
FIGURE 5 Control chart for partners tested for chlamydia per index case. Combined outcome was defined as outcome verified by a health-care worker or, if data were missing, as reported by the patient. All cases were included and those with missing data were coded as having zero partners tested.CC-BY · From the PDF
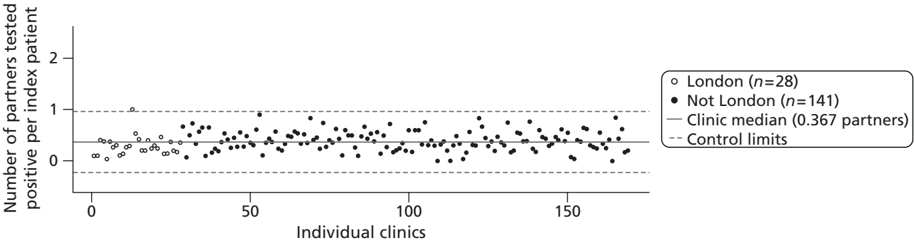
FIGURE 6 Control chart for partners tested positive for chlamydia per index case. Combined outcome was defined as outcome verified by a health-care worker or, if data were missing, as reported by the patient. All cases were included and those with missing data were coded as having zero partners tested.
FIGURE 6 Control chart for partners tested positive for chlamydia per index case. Combined outcome was defined as outcome verified by a health-care worker or, if data were missing, as reported by the patient. All cases were included and those with missing data were coded as having zero partners tested.CC-BY · From the PDF
FIGURE 7 Control chart for partners treated for chlamydia per index case. Combined outcome was defined as outcome verified by a health-care worker or, if data were missing, as reported by the patient. All cases were included and those with missing data were coded as having zero partners tested.
FIGURE 7 Control chart for partners treated for chlamydia per index case. Combined outcome was defined as outcome verified by a health-care worker or, if data were missing, as reported by the patient. All cases were included and those with missing data were coded as having zero partners tested.CC-BY · From the PDF
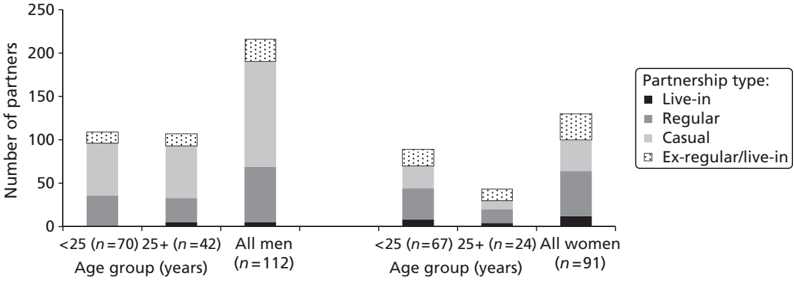
FIGURE 8 Frequency distribution of partners over the past year, by partnership type, sex and age group of index case. Numbers in parentheses correspond to the number of index cases in each group.
FIGURE 8 Frequency distribution of partners over the past year, by partnership type, sex and age group of index case. Numbers in parentheses correspond to the number of index cases in each group.CC-BY · From the PDF
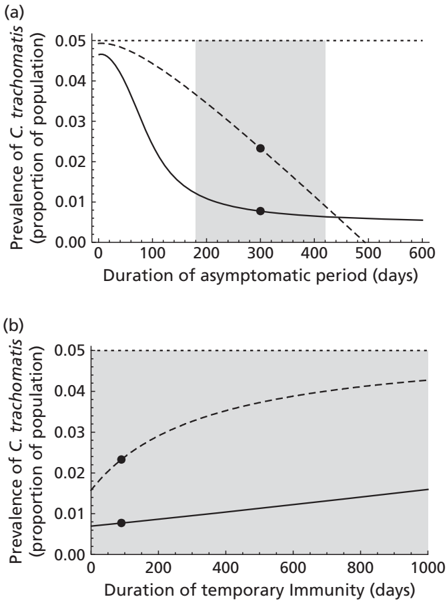
FIGURE 9 Prevalence of chlamydia after the introduction of a screening programme. Dotted line, baseline prevalence in the absence of a screening programme; dashed line, long-term prevalence if the population receives screening at a rate of 0.05 per year; solid line, prevalence after screening the population at a rate of 0.25 per year for 10 years; grey area, parameter range; black dots, baseline scenario. (a) Chlamydia prevalence as a function of the duration of the asymptomatic period. Most estimates on the duration of the asymptomatic period are within 200 -400 days; and (b) chlamydia prevalence as a function of the duration of temporary immunity. Reprinted from Epidemics , vol. 2, Althaus CL, Heijne JCM, Roellin A, Low N, Transmission dynamics of Chlamydia trachomatis affect the impact of screening programme, pp. 123 -31, 2010, with permission from Elsevier. 46
FIGURE 9 Prevalence of chlamydia after the introduction of a screening programme. Dotted line, baseline prevalence in the absence of a screening programme; dashed line, long-term prevalence if the population receives screening at a rate of 0.05 per year; solid line, prevalence after screening the population at a rate of 0.25 per year for 10 years; grey area, parameter range; black dots, baseline scenario. (a) Chlamydia prevalence as a function of the duration of the asymptomatic period. Most estimates on the duration of the asymptomatic period are within 200 -400 days; and (b) chlamydia prevalence as a function of the duration of temporary immunity. Reprinted from Epidemics , vol. 2, Althaus CL, Heijne JCM, Roellin A, Low N, Transmission dynamics of Chlamydia trachomatis affect the impact of screening programme, pp. 123 -31, 2010, with permission from Elsevier. 46CC-BY · From the PDF
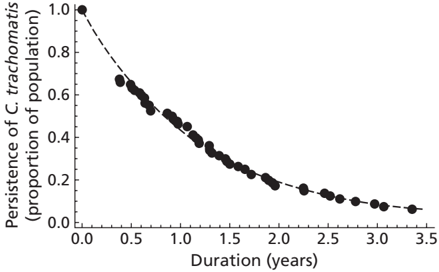
FIGURE 10 Persistence of chlamydia in asymptomatically infected women. Data from Molano et al. 85 and reprinted from Epidemics , vol. 2, Althaus CL, Heijne JCM, Roellin A, Low N, Transmission dynamics of Chlamydia trachomatis affect the impact of screening programme, pp. 123 -31, 2010, with permission from Elsevier. 46
FIGURE 10 Persistence of chlamydia in asymptomatically infected women. Data from Molano et al. 85 and reprinted from Epidemics , vol. 2, Althaus CL, Heijne JCM, Roellin A, Low N, Transmission dynamics of Chlamydia trachomatis affect the impact of screening programme, pp. 123 -31, 2010, with permission from Elsevier. 46CC-BY · From the PDF
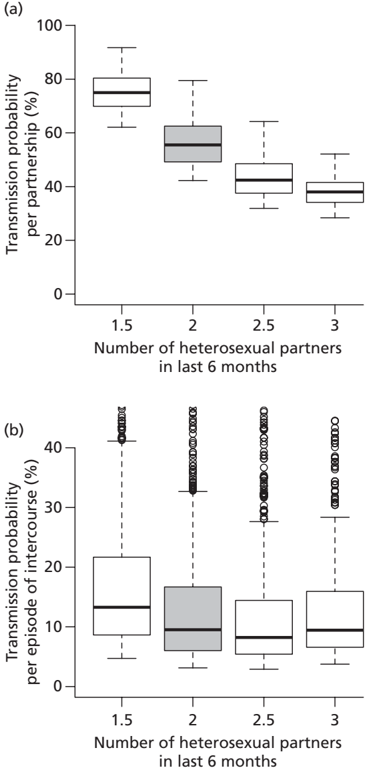
FIGURE 11 Estimated chlamydia transmission probabilities for different values of the number of partners in the last 6 months. (a) Per-partnership transmission probability of chlamydia; and (b) per-sex act transmission probability of chlamydia. Each box plot represents estimates from 1000 different parameter combinations. The baseline scenario, where it is assumed that individuals in a partnership at steady-state have on average of two heterosexual partners during the previous 6 months, is in grey. It is assumed that individuals have one episode of heterosexual intercourse every 5 days. Reprinted with permission from Althaus CL, Heijne JC, Low N, Towards more robust estimates of the transmissibility of Chlamydia trachomatis . Sex Transm Dis , vol. 39, issue 5, pp. 402 -4, 2012. 47
FIGURE 11 Estimated chlamydia transmission probabilities for different values of the number of partners in the last 6 months. (a) Per-partnership transmission probability of chlamydia; and (b) per-sex act transmission probability of chlamydia. Each box plot represents estimates from 1000 different parameter combinations. The baseline scenario, where it is assumed that individuals in a partnership at steady-state have on average of two heterosexual partners during the previous 6 months, is in grey. It is assumed that individuals have one episode of heterosexual intercourse every 5 days. Reprinted with permission from Althaus CL, Heijne JC, Low N, Towards more robust estimates of the transmissibility of Chlamydia trachomatis . Sex Transm Dis , vol. 39, issue 5, pp. 402 -4, 2012. 47CC-BY · From the PDF
Image 10
CC-BY · From the PDF
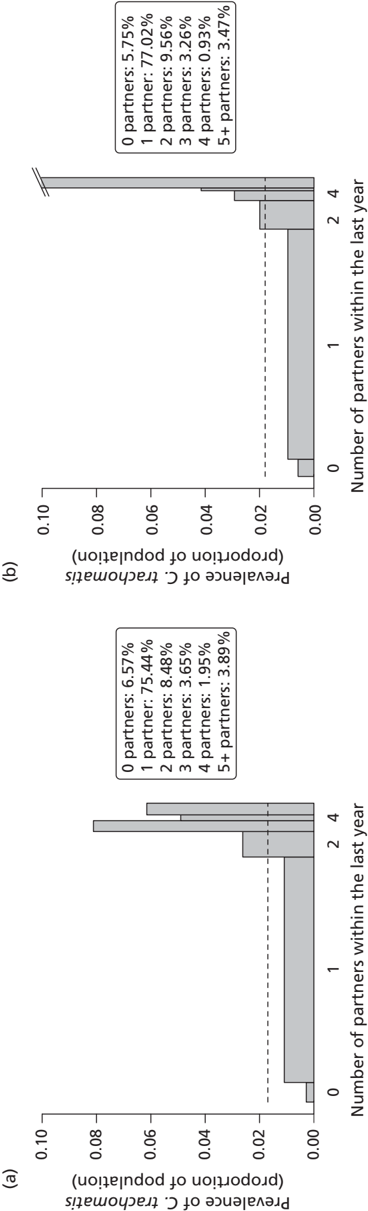
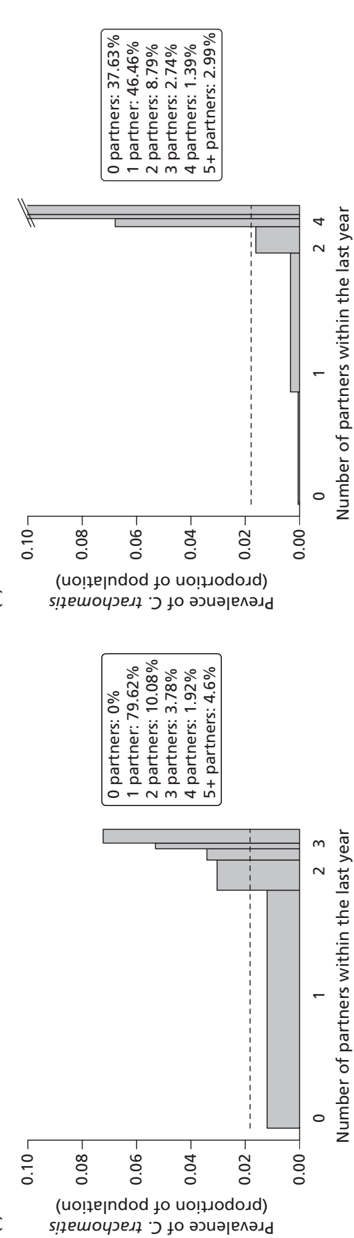
FIGURE 12 Asymmetrical distributions of chlamydia infections among individuals according to level of sexual activity. (a) Natsal-2; 8 (b) Kretzschmar model; 38 (c) Turner model; 40 and (d) ClaSS model. 39 The width of each bar represents the proportion of people who have had a given number of sexual partners within the last year (the legend shows the distribution of sexual partner numbers). The height of the bar indicates the prevalence of chlamydia in each group. Note that the prevalence in the group with highest activity (> 5 partners) is 20% in the Kretzschmar model and 34% in the ClaSS model. Overall prevalence for women and men aged 18 -44 years is given by the dashed line and is approximately the same in all graphs (1.7%). Reproduced with permission from Althaus CL, Turner KM, Schmid BV, Heijne JC, Kretzschmar M, Low N, Transmission of Chlamydia trachomatis through sexual partnerships: a comparison between three individual-based models and empirical data, J R Soc Interface 2012; 9:136 -46. 48
FIGURE 12 Asymmetrical distributions of chlamydia infections among individuals according to level of sexual activity. (a) Natsal-2; 8 (b) Kretzschmar model; 38 (c) Turner model; 40 and (d) ClaSS model. 39 The width of each bar represents the proportion of people who have had a given number of sexual partners within the last year (the legend shows the distribution of sexual partner numbers). The height of the bar indicates the prevalence of chlamydia in each group. Note that the prevalence in the group with highest activity (> 5 partners) is 20% in the Kretzschmar model and 34% in the ClaSS model. Overall prevalence for women and men aged 18 -44 years is given by the dashed line and is approximately the same in all graphs (1.7%). Reproduced with permission from Althaus CL, Turner KM, Schmid BV, Heijne JC, Kretzschmar M, Low N, Transmission of Chlamydia trachomatis through sexual partnerships: a comparison between three individual-based models and empirical data, J R Soc Interface 2012; 9:136 -46. 48CC-BY · From the PDF
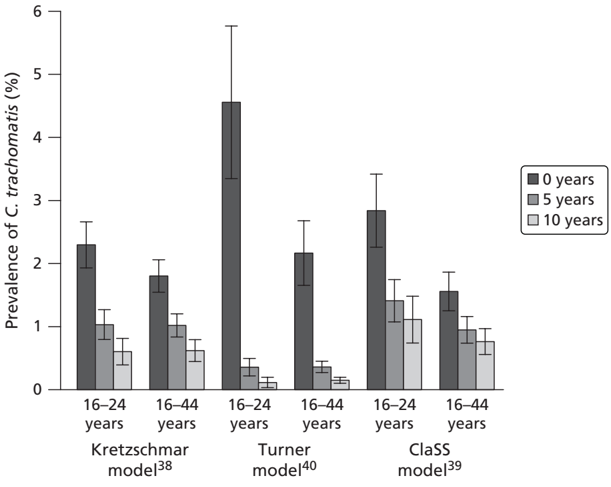
FIGURE 13 Impact of a standardised screening programme on the prevalence of chlamydia. The proportion of eligible people receiving screening at least once a year is 20%, and 40% of the current or most recent partners of an index case are successfully notified and treated. Means of 100 simulations runs are shown together with the SD. Reproduced with permission from Althaus CL, Turner KM, Schmid BV, Heijne JC, Kretzschmar M, Low N, Transmission of Chlamydia trachomatis through sexual partnerships: a comparison between three individual-based models and empirical data, J R Soc Interface 2012; 9 :136 -46. 48
FIGURE 13 Impact of a standardised screening programme on the prevalence of chlamydia. The proportion of eligible people receiving screening at least once a year is 20%, and 40% of the current or most recent partners of an index case are successfully notified and treated. Means of 100 simulations runs are shown together with the SD. Reproduced with permission from Althaus CL, Turner KM, Schmid BV, Heijne JC, Kretzschmar M, Low N, Transmission of Chlamydia trachomatis through sexual partnerships: a comparison between three individual-based models and empirical data, J R Soc Interface 2012; 9 :136 -46. 48CC-BY · From the PDF
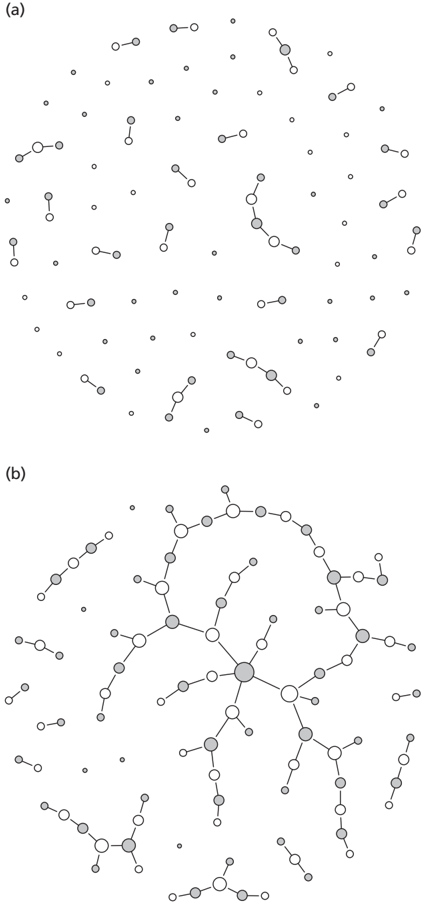
FIGURE 14 Sexual partnership networks from the individual-based model. Different sexes are indicated by filled and empty circles. (a) At cross-section, individuals can be single, form a sexual partnership or have two concurrent sexual partnerships; and (b) large connected components emerge during a period of 1 year. For illustrative purposes, the population size was limited to 100, resulting in higher connected networks compared with larger population sizes.
FIGURE 14 Sexual partnership networks from the individual-based model. Different sexes are indicated by filled and empty circles. (a) At cross-section, individuals can be single, form a sexual partnership or have two concurrent sexual partnerships; and (b) large connected components emerge during a period of 1 year. For illustrative purposes, the population size was limited to 100, resulting in higher connected networks compared with larger population sizes.CC-BY · From the PDF
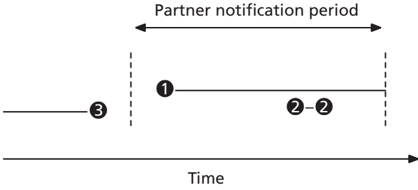
FIGURE 15 Partnership histories and partner notification strategies. The scheme shows an example of an individual ' s history of three sexual partnerships. The partnerships can either be separated by a period of being single (partnership 1 and 3) or be concurrent (partnership 1 and 2). One strategy is to notify partners of an index case in order of their recency, e.g. the first, second or third most recent partner(s). Another strategy is to notify all partners from a certain time period, e.g. the partners from partnership 1 and 2 only. Reprinted with permission from Althaus CL, Heijne JCM, Herzog SA, Roellin A, Low N, Individual and population level effects of partner notification for Chlamydia trachomatis , PLOS ONE 2012; 7 :e51438. 49
FIGURE 15 Partnership histories and partner notification strategies. The scheme shows an example of an individual ' s history of three sexual partnerships. The partnerships can either be separated by a period of being single (partnership 1 and 3) or be concurrent (partnership 1 and 2). One strategy is to notify partners of an index case in order of their recency, e.g. the first, second or third most recent partner(s). Another strategy is to notify all partners from a certain time period, e.g. the partners from partnership 1 and 2 only. Reprinted with permission from Althaus CL, Heijne JCM, Herzog SA, Roellin A, Low N, Individual and population level effects of partner notification for Chlamydia trachomatis , PLOS ONE 2012; 7 :e51438. 49CC-BY · From the PDF
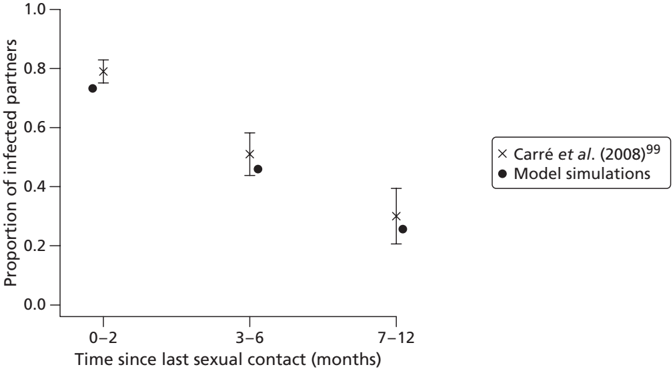
FIGURE 16 Simulated and empirical data of chlamydia positivity in partners of index cases. Black crosses correspond to the proportion (with 95% CI) of positive partners out of those with a positive test. 99 The black circles represent simulated data from the model. In the simulations, the steady-state prevalence of chlamydia is 3%. Means of 100 simulation runs are shown. Standard errors are small and omitted for better visibility. Reprinted with permission from Althaus CL, Heijne JCM, Herzog SA, Roellin A, Low N, Individual and population level effects of partner notification for Chlamydia trachomatis , PLOS ONE 2012; 7 :e51438. 49
FIGURE 16 Simulated and empirical data of chlamydia positivity in partners of index cases. Black crosses correspond to the proportion (with 95% CI) of positive partners out of those with a positive test. 99 The black circles represent simulated data from the model. In the simulations, the steady-state prevalence of chlamydia is 3%. Means of 100 simulation runs are shown. Standard errors are small and omitted for better visibility. Reprinted with permission from Althaus CL, Heijne JCM, Herzog SA, Roellin A, Low N, Individual and population level effects of partner notification for Chlamydia trachomatis , PLOS ONE 2012; 7 :e51438. 49CC-BY · From the PDF
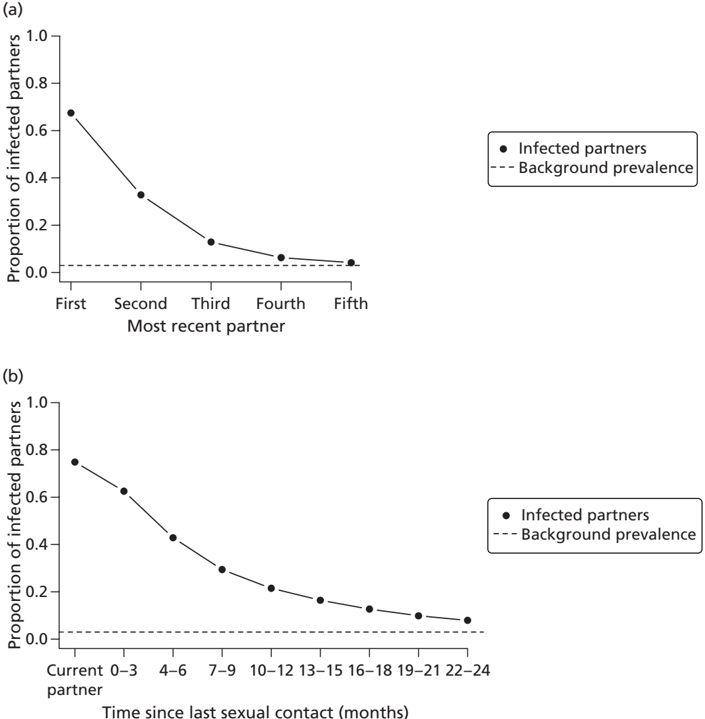
FIGURE 17 Proportion of chlamydia-positive partners of index cases. (a) The proportion of infected partners in order of their recency; and (b) the proportion of infected partners grouped into different look-back periods in order of their break-up date. Steady-state chlamydia prevalence is 3% (dashed line). For each strategy, means of 100 simulation runs are shown. Standard errors are small and omitted for better visibility. Reprinted with permission from Althaus CL, Heijne JCM, Herzog SA, Roellin A, Low N, Individual and population level effects of partner notification for Chlamydia trachomatis , PLOS ONE 2012; 7 :e51438. 49
FIGURE 17 Proportion of chlamydia-positive partners of index cases. (a) The proportion of infected partners in order of their recency; and (b) the proportion of infected partners grouped into different look-back periods in order of their break-up date. Steady-state chlamydia prevalence is 3% (dashed line). For each strategy, means of 100 simulation runs are shown. Standard errors are small and omitted for better visibility. Reprinted with permission from Althaus CL, Heijne JCM, Herzog SA, Roellin A, Low N, Individual and population level effects of partner notification for Chlamydia trachomatis , PLOS ONE 2012; 7 :e51438. 49CC-BY · From the PDF
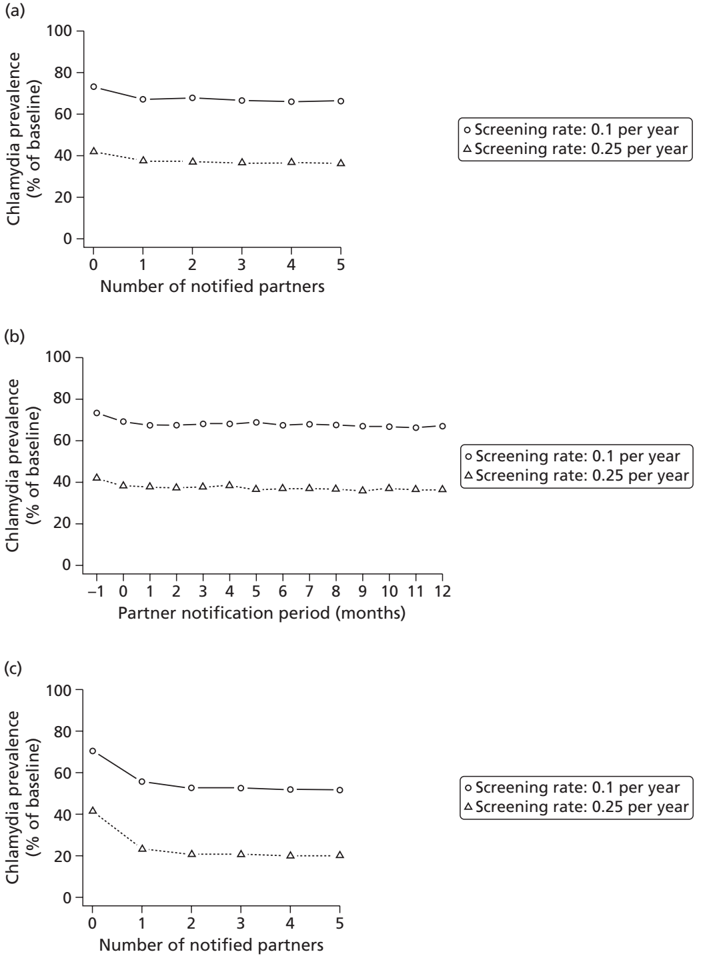
FIGURE 18 Population level effect of partner notification. Graphs show the reduction in the prevalence of chlamydia after screening for 5 years at a rate of 0.1 or 0.25 per year. (a), (c) and (e) show prevalence for different numbers of notified partners; (b), (d) and (f) show prevalence for different partner notification periods. The probability, p , that each notified partner will be tested and successfully treated is set to 10% (a and b), 50% (c and d) or 90% (e and f). For each strategy, means of 100 simulation runs are shown. Standard errors are small and omitted for better visibility. ( continued )
FIGURE 18 Population level effect of partner notification. Graphs show the reduction in the prevalence of chlamydia after screening for 5 years at a rate of 0.1 or 0.25 per year. (a), (c) and (e) show prevalence for different numbers of notified partners; (b), (d) and (f) show prevalence for different partner notification periods. The probability, p , that each notified partner will be tested and successfully treated is set to 10% (a and b), 50% (c and d) or 90% (e and f). For each strategy, means of 100 simulation runs are shown. Standard errors are small and omitted for better visibility. ( continued )CC-BY · From the PDF
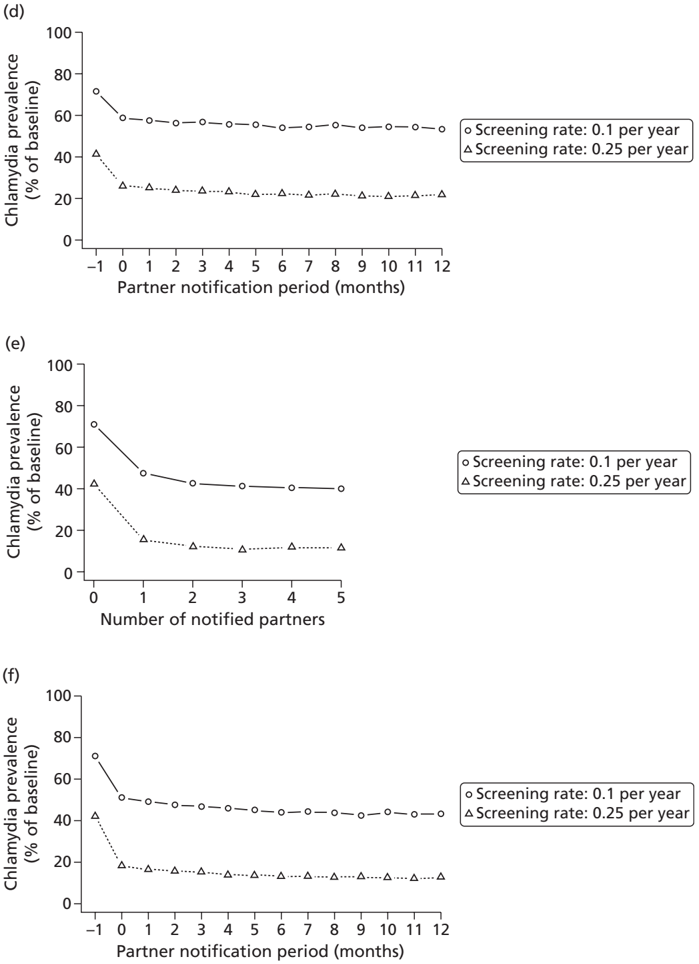
FIGURE 18 Population level effect of partner notification. Graphs show the reduction in the prevalence of chlamydia after screening for 5 years at a rate of 0.1 or 0.25 per year. (a), (c) and (e) show prevalence for different numbers of notified partners; (b), (d) and (f) show prevalence for different partner notification periods. The probability, p , that each notified partner will be tested and successfully treated is set to 10% (a and b), 50% (c and d) or 90% (e and f). For each strategy, means of 100 simulation runs are shown. Standard errors are small and omitted for better visibility.
FIGURE 18 Population level effect of partner notification. Graphs show the reduction in the prevalence of chlamydia after screening for 5 years at a rate of 0.1 or 0.25 per year. (a), (c) and (e) show prevalence for different numbers of notified partners; (b), (d) and (f) show prevalence for different partner notification periods. The probability, p , that each notified partner will be tested and successfully treated is set to 10% (a and b), 50% (c and d) or 90% (e and f). For each strategy, means of 100 simulation runs are shown. Standard errors are small and omitted for better visibility.CC-BY · From the PDF
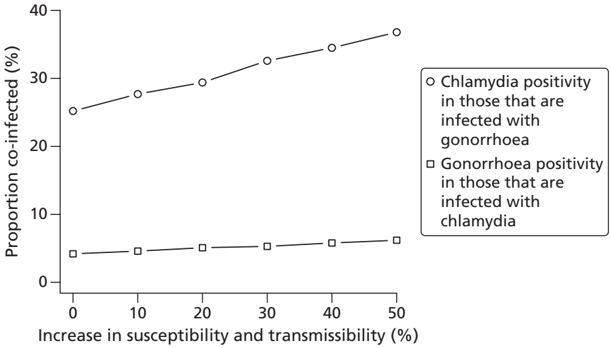
FIGURE 19 Rates of co-infection with chlamydia and gonorrhoea. Increasing the susceptibility and transmissibility of one organism if the other organism is present results in an increase in co-infection rates, particularly the rate of chlamydia positivity in those who are infected with gonorrhoea.
FIGURE 19 Rates of co-infection with chlamydia and gonorrhoea. Increasing the susceptibility and transmissibility of one organism if the other organism is present results in an increase in co-infection rates, particularly the rate of chlamydia positivity in those who are infected with gonorrhoea.CC-BY · From the PDF
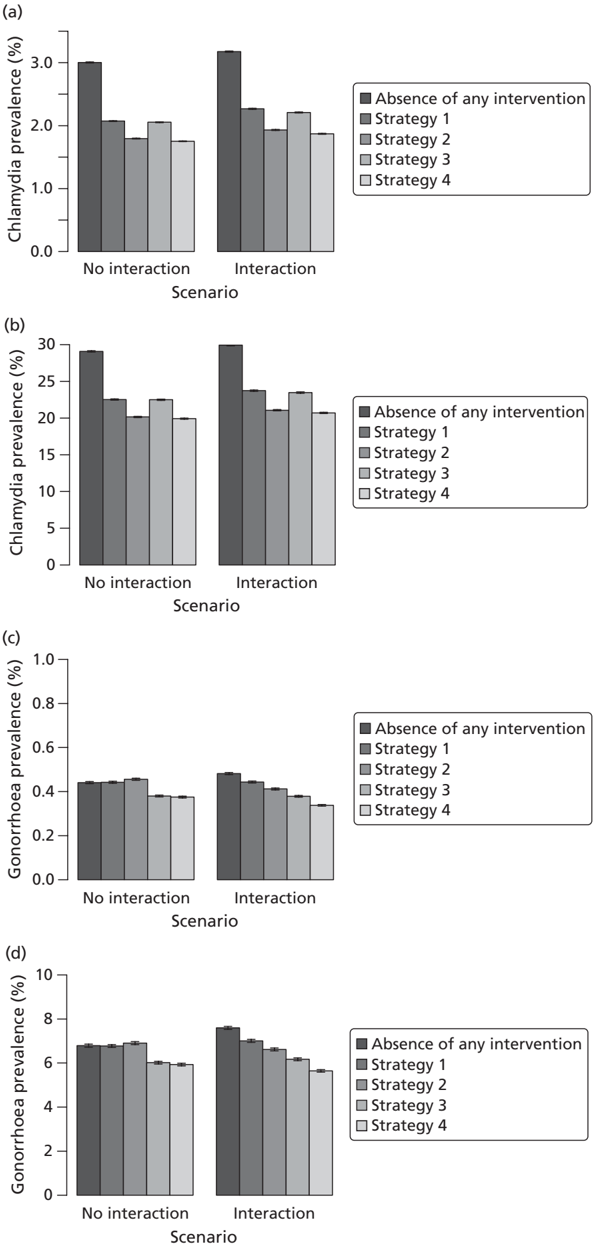
FIGURE 20 Effects of screening and partner notification for chlamydia (a and b) and gonorrhoea (c and d), assuming that the average screening interval for all individuals is 5 years. The prevalence rates of four different scenarios are contrasted with those in absence of any intervention. Strategy 1, routine testing for chlamydia; strategy 2, APT for chlamydia; strategy 3, routine testing for chlamydia and gonorrhoea; strategy 4, APT for chlamydia and gonorrhoea. Overall (a and c): general population of 16- to 29-year-olds. High risk (b and d): individuals with 10 new heterosexual partners per year (1.5% of the general population).
FIGURE 20 Effects of screening and partner notification for chlamydia (a and b) and gonorrhoea (c and d), assuming that the average screening interval for all individuals is 5 years. The prevalence rates of four different scenarios are contrasted with those in absence of any intervention. Strategy 1, routine testing for chlamydia; strategy 2, APT for chlamydia; strategy 3, routine testing for chlamydia and gonorrhoea; strategy 4, APT for chlamydia and gonorrhoea. Overall (a and c): general population of 16- to 29-year-olds. High risk (b and d): individuals with 10 new heterosexual partners per year (1.5% of the general population).CC-BY · From the PDF
FIGURE 21 Effects of screening and partner notification for chlamydia (a and b) and gonorrhoea (c and d), assuming that the average screening interval for all individuals is 2 years. The prevalence rates of four different scenarios are contrasted with those in absence of any intervention. Strategy 1, routine testing for chlamydia; strategy 2, APT for chlamydia; strategy 3, routine testing for chlamydia and gonorrhoea; strategy 4, APT for chlamydia and gonorrhoea. Overall (a and c): general population of 16- to 29-year-olds. High risk (b and d): individuals with 10 new heterosexual partners per year (1.5% of the general population).
FIGURE 21 Effects of screening and partner notification for chlamydia (a and b) and gonorrhoea (c and d), assuming that the average screening interval for all individuals is 2 years. The prevalence rates of four different scenarios are contrasted with those in absence of any intervention. Strategy 1, routine testing for chlamydia; strategy 2, APT for chlamydia; strategy 3, routine testing for chlamydia and gonorrhoea; strategy 4, APT for chlamydia and gonorrhoea. Overall (a and c): general population of 16- to 29-year-olds. High risk (b and d): individuals with 10 new heterosexual partners per year (1.5% of the general population).CC-BY · From the PDF
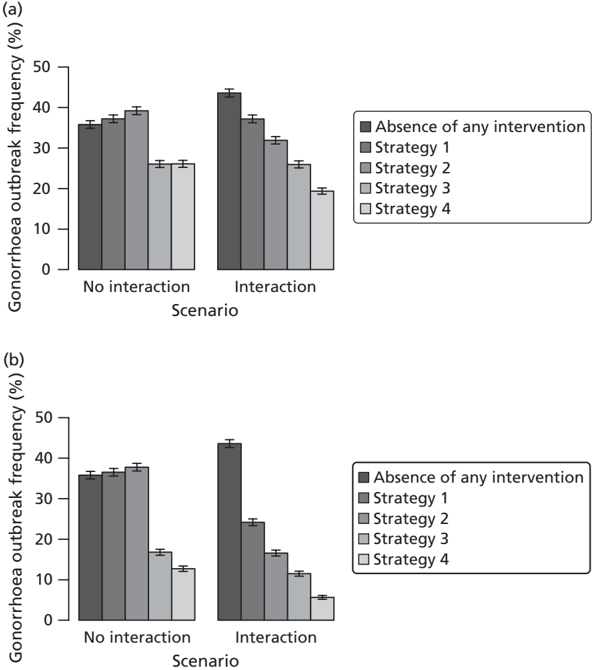
FIGURE 22 Outbreak frequency of gonorrhoea. (a) 5-year screening interval; (b) 2-year screening interval. Gonorrhoea prevalence is measured once a year and an outbreak is defined when the observed annual prevalence in the general population exceeds 0.5%. The prevalence rates of four different scenarios are contrasted to those in absence of any intervention. Strategy 1, routine testing for chlamydia; strategy 2, APT for chlamydia; strategy 3, routine testing for chlamydia and gonorrhoea; strategy 4, APT for chlamydia and gonorrhoea. Overall: general population of 16- to 29-year-olds. High risk: individuals with 10 new heterosexual partners per year (1.5% of the general population).
FIGURE 22 Outbreak frequency of gonorrhoea. (a) 5-year screening interval; (b) 2-year screening interval. Gonorrhoea prevalence is measured once a year and an outbreak is defined when the observed annual prevalence in the general population exceeds 0.5%. The prevalence rates of four different scenarios are contrasted to those in absence of any intervention. Strategy 1, routine testing for chlamydia; strategy 2, APT for chlamydia; strategy 3, routine testing for chlamydia and gonorrhoea; strategy 4, APT for chlamydia and gonorrhoea. Overall: general population of 16- to 29-year-olds. High risk: individuals with 10 new heterosexual partners per year (1.5% of the general population).CC-BY · From the PDF
Image 23
CC-BY · From the PDF
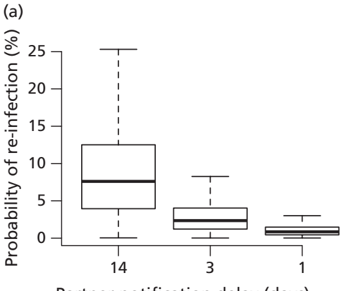
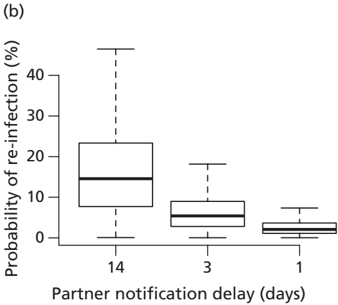
FIGURE 23 Reinfection rates of treated index cases by their untreated partners. (a) Chlamydia; and (b) gonorrhoea. The figures show box plots of 1000 different parameter combinations.
FIGURE 23 Reinfection rates of treated index cases by their untreated partners. (a) Chlamydia; and (b) gonorrhoea. The figures show box plots of 1000 different parameter combinations.CC-BY · From the PDF
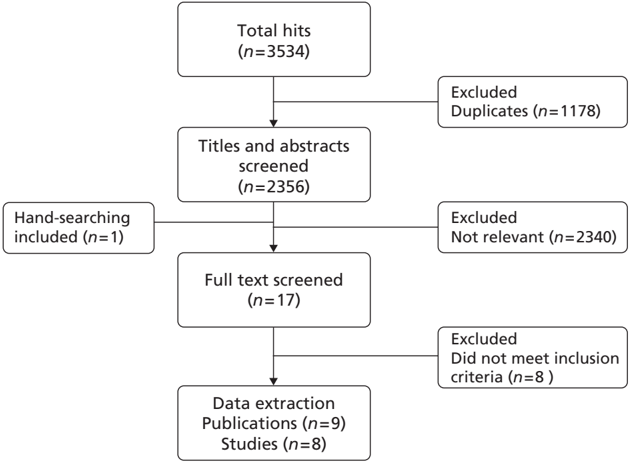
FIGURE 24 Flow chart of included studies.
FIGURE 24 Flow chart of included studies.CC-BY · From the PDF

Verification

Claims the paper makes

The claims and statistics of this paper haven’t been checked yet.

Run the check — free, no account needed. It reads the open-access text and checks the sources it cites.

A few free checks a day · papers already verified open instantly · results are public

Claims other papers make about this one

Each is checked against this paper’s own text: does it say what the citing paper says it does?

Self-check

Percentages, sums and reported differences re-computed from the paper’s own numbers.

The self-check needs the paper’s full text.

Citations

Cites

Show all 132 references

Research works printed but not linked: 14

  1. Althaus C, Heijne CM, Roellin A, Low N. Transmission dynamics of Chlamydia trachomatis affect the impact of screening programmes. Epidemics 2010;2:123-31.
  2. Herzog S, McClean H, Carne C, Low N. Variation in partner notification outcomes for chlamydia in UK genitouinary medicine clinics: multi-level study. Sex Transm Infect 2011;87:420-5.
  3. Turner K, Adams E, Macleod J, Bell G, Clarke J, Horner P. Costs and cost effectiveness of different strategies for chlamydia screening and partner notification: an economic and mathematical modelling study. BMJ 2011;342:c7250.
  4. Althaus CL, Turner KME, Schmid BV, Heijne JCM, Kretzschmar M, Low N. Transmission of Chlamydia trachomatis through sexual partnerships: a comparison between three individual-based models and empirical data. J R Soc Interface 2012;9:136-46. References
  5. WHO/UNAIDS. Sexually Transmitted Diseases: Policies and Principles for Prevention and Care. Geneva: UNAIDS, UNAIDS Best Practice Collection; 1999. pp. 1-47.
  6. Golden MR, Faxelid E, Low N. Partner notification for sexually transmitted infections including HIV infection: an evidence-based assessment. In Holmes KK, Sparling PF, Stamm WE, Piot P, Wasserheit JN, Corey L, et al., editors. Sexually Transmitted Diseases. 4th edn. New York, NY: McGraw-Hill; 2008. pp. 965-84.
  7. Hoaglin DC. Understanding Robust and Explanatory Data Analysis. New York, NY: Wiley & Sons; 2000.
  8. Twisk JWR. Applied Multilevel Analysis: A Practical Guide. Cambridge: Cambridge University Press; 2006.
  9. Low N, McCarthy A, Macleod J, Salisbury C, Campbell R, Roberts TE et al. Epidemiological, social, diagnostic and economic evaluation of population screening for genital chlamydial infection. Health Technol Assess 2007; 11(8):1-184.
  10. Turner KM, Adams EJ, Gay N, Ghani AC, Mercer C, Edmunds WJ. Developing a realistic sexual network model of chlamydia transmission in Britain. Theor Biol Med Model 2006; 3:3.
  11. Bignell C, FitzGerald M. UK national guideline for the management of gonorrhoea in adults, 2011. Int J STD AIDS 2011; 22:541-547.
  12. Kretzschmar M, Turner KM, Barton PM, Edmunds WJ, Low N. Predicting the population impact of chlamydia screening programmes: comparative mathematical modelling study. Sex Transm Infect 2009; 85:359-366.
  13. Low N, McCarthy A, Roberts TE, Huengsberg M, Sanford E, Sterne JAC et al. Partner notification for chlamydia in primary care: randomised controlled trial and analysis of resource use. BMJ 2006; 332:14-19.
  14. sexually transmitted disease*:ti,ab,kw OR sexually transmissible disease*:ti,ab,kw OR sexually transmitted infection*:ti,ab,kw OR sexually transmissible infection*:ti,ab,kw OR sexually transmitted infectious disease*:ti,ab, kw OR sexually transmissible infectious disease*:ti,ab,kw OR sexually transmitted disorder*:ti,ab,kw OR sexually transmissible disorder*:ti,ab,kw OR STI:ti,ab,kw OR STIs:ti,ab,kw OR STD:ti,ab,kw OR STIs:ti,ab,kw OR venereal disease*:ti,ab,kw OR venereal infection*:ti,ab,kw OR venereal disorder*:ti,ab,kw OR genital herpes:ti,ab,kw OR herpes genitalis:ti,ab,kw OR genital infection*:ti,ab,kw OR genital disorder*:ti,ab,kw #17 herpes simplex:ti,ab,kw OR herpes virus:ti,ab,kw OR HSV-1:ti,ab,kw OR HSV-2:ti,ab,kw OR chancroid*:ti,ab,kw OR haemophilus ducreyi:ti,ab,kw OR chlamydia infection*:ti,ab,kw OR chlamydia trachomatis:ti,ab,kw OR gonorrhoea*:ti,ab,kw OR gonorrhea*:ti,ab,kw OR syphilis:ti,ab,kw OR syphillis:ti,ab,kw OR condylomata lata:ti,ab, kw OR chancre*:ti,ab,kw OR lymphogranuloma venereum:ti,ab,kw OR granuloma inguinale:ti,ab,kw OR donovania:ti,ab,kw OR donovanosis:ti,ab,kw OR calymmatobacterium granulomatis:ti,ab,kw OR klebsiella granulomatis:ti,ab,kw OR klebsiella granulomatis:ti,ab,kw OR treponema pallidum:ti,ab,kw OR genital wart*:ti,ab, kw OR venereal wart*:ti,ab,kw OR hpv-6:ti,ab,kw OR hpv-11:ti,ab,kw OR hpv6:ti,ab,kw OR human papillomavirus: ti,ab,kw OR hepatitis b:ti,ab,kw OR trichomonas vaginitis:ti,ab,kw OR genital ulcer*:ti,ab,kw OR anogenital ulcer*: ti,ab,kw OR anorectal ulcer*:ti,ab,kw OR anorectal ulcer*:ti,ab,kw OR penile ulcer*:ti,ab,kw #18 (#15 OR #16 OR #17) #19 MeSH descriptor HIV Infections explode all trees DOI: 10.3310/hta18020 HEALTH TECHNOLOGY ASSESSMENT 2014 VOL. 18 NO. 2 #1 Chlamydia.mp. or exp CHLAMYDIA/ or CHLAMYDIA TRACHOMATIS/ #2 Gonorrhea.mp. or exp GONORRHEA/ #3 Pelvic inflammatory disease.mp. or exp pelvic inflammatory disease/ #4 PID.mp. or exp pelvic inflammatory disease/ #5 Cervicitis.mp. or exp uterine cervicitis/ #6 Chronic pelvic pain.mp. #7 Ectopic pregnancy.mp. or exp ectopic pregnancy/ #8 Epididymitis.mp. #9 Economic evaluation.mp. or economic evaluation/ #10 Cost-utility analysis.mp. or "cost utility analysis"/ #11 Cost-effectiveness analysis.mp. or "cost effectiveness analysis"/ #12 Quality of life.mp. or "quality of life"/ #13 1 or 2 or 3 or 4 or 5 or 6 or 7 or 8 #14 9 or 10 or 11 #15 13 and 14 #16 14 and 15 #17 15 or 16

Cited by

Sorted by citations

See all 101

Metadata

Authors
Althaus, C. L., Turner, K. M., Mercer, C. H., Auguste, P., Roberts, T. E., Bell, G., Herzog, S. A., Cassell, J. A., Edmunds, W. J., White, P. J., Ward, H., & Low, N.
Affiliations
  • University of Bern (CH)
  • School of Social and Community Medicine, University of Bristol, Bristol, UK
  • University College London (GB)
  • University of Birmingham (GB)
  • Sheffield Teaching Hospitals NHS Foundation Trust (GB)
  • Brighton and Sussex Medical School (GB)
  • London School of Hygiene & Tropical Medicine (GB)
  • Public Health England (GB)
  • Imperial College London (GB)
Corresponding author
Low, Nicola
Venue
Health Technology Assessment
Published
2014-01
Volume
18
Issue
2
Pages
1-100, vii
ISSN
  • 1366-5278 (ISSN-L)
  • 2046-4924
OpenAlex
W2058667696
Cited by
101
References
132
Citations by year
2026: 4 · 2025: 2 · 2024: 2 · 2023: 9 · 2022: 12 · 2021: 10 · 2020: 13 · 2019: 10 · 2018: 8 · 2017: 5 · 2016: 8 · 2015: 11 · 2014: 5
FWCI
1.39
Type
journal article
Language
en
Open access
Locations
  • Health Technology Assessment (publishedVersion, cc-by)
  • PubMed Central (publishedVersion)
  • PubMed (publishedVersion)
  • LSHTM Research Online (London School of Hygiene and Tropical Medicine) (acceptedVersion)
  • Sussex Research Online (University of Sussex) (submittedVersion)
  • BORIS (University Library Bern) (submittedVersion)
  • DOAJ (DOAJ: Directory of Open Access Journals) (submittedVersion, cc-by-sa)
  • Figshare (submittedVersion, cc-by)
  • Bristol Research (University of Bristol) (submittedVersion)
Funders
National Institute for Health Research
Topics
  • Life Sciences › Immunology and Microbiology › Microbiology › Reproductive tract infections research
  • Health Sciences › Medicine › Infectious Diseases › HIV/AIDS Research and Interventions
  • Social Sciences › Economics, Econometrics and Finance › Economics and Econometrics › Health Systems, Economic Evaluations, Quality of Life
Keywords
partner notification, expedited partner therapy, chlamydia, gonorrhea, cost-effectiveness, health-related quality of life, partner testing, STI screening, STI prevalence, transmission interruption, genitourinary medicine clinics, lookback period
MeSH terms
Adolescent, Adult, Cost-Benefit Analysis, Female, United Kingdom, Humans, Male, Models, Biological, Sexually Transmitted Diseases, State Medicine, Models, Statistical, Contact Tracing, Quality-Adjusted Life Years, Secondary Prevention, Young Adult

About these checks

Registry, retraction, Cites and statistics results are computed, not judged, with one exception: a printed reference that no index lists is read once by a model before it counts as a citation error. Claims are extracted by a model and kept only when their quote appears verbatim in the text; each cited source is then checked, with a model’s help, for whether it says what the claim relies on. Those verdicts can be wrong — read the claim’s quote and the cited source before relying on one.

Statistics and arithmetic are recomputed, not judged.

Confidence bands are shown only for fields calibrated on our annotated test set. None is calibrated yet, so no band is shown.

What counts as a claim ›How we measure confidence ›How we check this ›

Are you an author, or do you see a problem with this page? Request a review