

The DOI matches its Crossref record; 21 of the 21 references it cites were found in a registry or an index.
Elevated Pre-Pregnancy Blood Pressure and the Risk of Adverse Pregnancy Outcomes: Evidence From a Nationwide Population-Based Study
Open accessAbstract
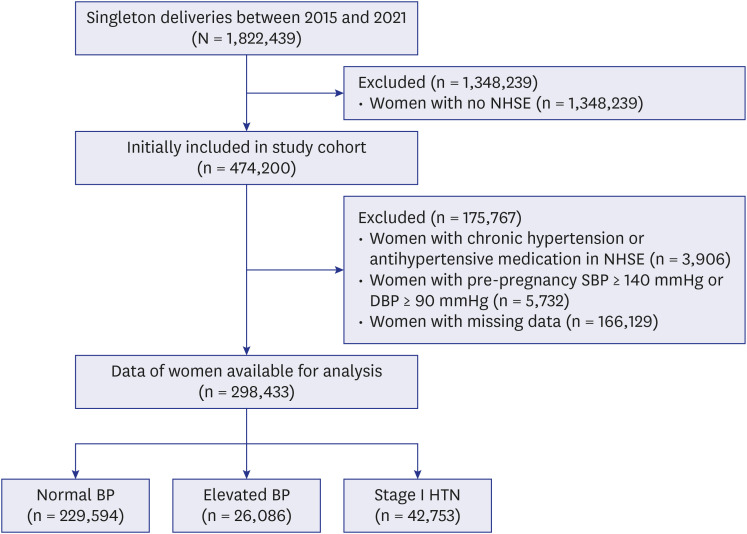
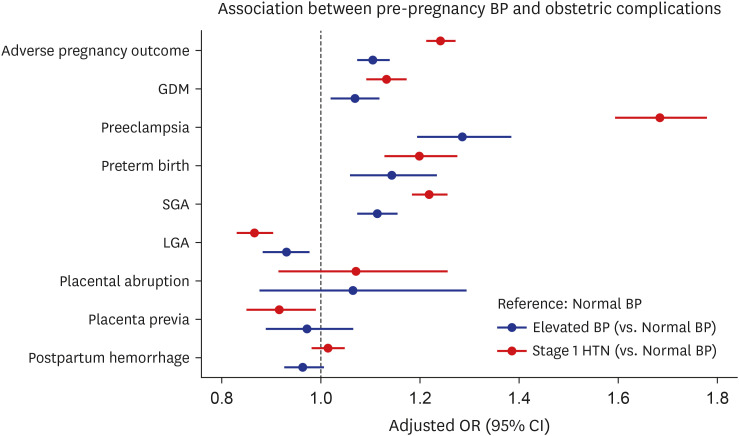
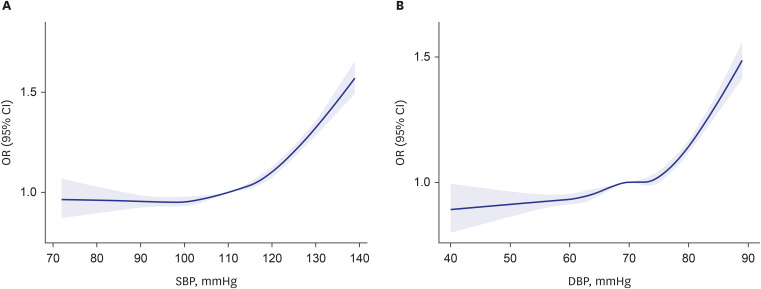
BACKGROUND: Pre-pregnancy blood pressure (BP) has gained attention as a potential predictor of adverse pregnancy outcomes. However, data on the impact of mildly elevated BP, particularly in women without overt hypertension, remain limited. In this study, we aimed to examine the association between pre-pregnancy BP and adverse pregnancy outcomes in women without a history of hypertension. METHODS: In this retrospective nationwide study, we included pregnant women with pre-pregnancy BP below 140/90 mmHg and no prior diagnosis of hypertension. Participants were categorized based on their pre-pregnancy BP into the normal BP (< 120/80 mmHg), elevated BP (120-129 and < 80 mmHg), and stage 1 hypertension (130-139 or 80-89 mmHg) groups. The following adverse pregnancy outcomes were recorded: preeclampsia, gestational diabetes, placental abruption, postpartum hemorrhage, preterm birth, and small or large for gestational age. Multivariable logistic regression was used to evaluate the associations between pre-pregnancy BP categories and adverse pregnancy outcomes. RESULTS: < 0.001). Compared to the normal BP group, adjusted odds ratios for adverse outcomes were 1.11 (95% confidence interval [CI], 1.07-1.14) for the elevated BP group and 1.24 (95% CI, 1.21-1.27) for the stage 1 hypertension group. A curvilinear relationship was observed between pre-pregnancy BP and the risk of adverse pregnancy outcomes. CONCLUSION: Even modest increases in pre-pregnancy BP below the clinical threshold for hypertension were associated with a higher risk of adverse pregnancy outcomes. These findings highlight the need for early BP monitoring and management before pregnancy.
Overview
The claims and statistics of this paper haven’t been checked yet.
Run the check — free, no account needed. It reads the open-access text and checks the sources it cites.
Integrity signals
Registry
Cites
Statistics
Figures
Verification
Claims the paper makes
The claims and statistics of this paper haven’t been checked yet.
Run the check — free, no account needed. It reads the open-access text and checks the sources it cites.
Claims other papers make about this one
Each is checked against this paper’s own text: does it say what the citing paper says it does?
The check wasn’t confident either way, so it gives no verdict — never disputed.
In the citing paper
“Recent evidence shows that even modest elevations in pre-pregnancy fasting glucose within the normal range are associated with increased GDM risk.30”
From Pre-Pregnancy Physical Activity Lowers Risk of Diet-Controlled but Not Insulin-Treated Gestational Diabetes Mellitus: A Korean Prospective Cohort Study (2026) · cites this paper as [30]
Experimental — accuracy not yet measured
Self-check
Percentages, sums and reported differences re-computed from the paper’s own numbers.
The self-check needs the paper’s full text.
Citations
Cites
Whelton, P. K., Carey, R. M., Aronow, W. S., Casey, D. E., Collins, K. J., Dennison Himmelfarb, C., DePalma, S. M., Gidding, S., Jamerson, K. A., Jones, D. W., et al. (2018) · Journal of the American College of Cardiology · doi:10.1016/j.jacc.2017.11.006 · Cited by 6,616
A Randomized Trial of Intensive versus Standard Blood-Pressure Control
The SPRINT Research Group (2015) · New England Journal of Medicine · doi:10.1056/nejmoa1511939 · Cited by 6,325
Gestational Hypertension and Preeclampsia
(2020) · Obstetrics & Gynecology · doi:10.1097/aog.0000000000003891 · Cited by 2,949 · cited 1×
“1,2 The incidence of gestational hypertension and preeclampsia has steadily increased with the increasing number of pregnancies resulting from in vitro fertilization and among women with pre-existing medical conditions.”
ACOG Practice Bulletin No. 203: Chronic Hypertension in Pregnancy
(2019) · Obstetrics & Gynecology · doi:10.1097/aog.0000000000003020 · Cited by 871 · cited 1×
“13 However, considering the evidence that cardiovascular risks increase even below the traditional threshold of 140/90 mmHg, the ACC/AHA lowered the diagnostic criteria for hypertension to ≥ 130/80 mmHg in 2017.”
Diagnosis, evaluation, and management of the hypertensive disorders of pregnancy
Magee, L. A., Pels, A., Helewa, M. E., Rey, É., & von Dadelszen, P. (2014) · Pregnancy Hypertension · doi:10.1016/j.preghy.2014.01.003 · Cited by 489
Competing risks model in screening for preeclampsia by maternal characteristics and medical history
Wright, D. E., Syngelaki, A., Akolekar, R., Poon, L. C., & Nicolaides, K. H. (2015) · American Journal of Obstetrics and Gynecology · doi:10.1016/j.ajog.2015.02.018 · Cited by 419
Bello, N. A., Zhou, H. C., Cheetham, T. C., Miller, E. C., Getahun, D. T., Fassett, M. J., & Reynolds, K. (2021) · JAMA Network Open · doi:10.1001/jamanetworkopen.2021.3808 · Cited by 148
Maternal Outcomes Associated With Lower Range Stage 1 Hypertension
Sutton, E. F., Hauspurg, A. K., Caritis, S. N., Powers, R. W., & Catov, J. M. (2018) · Obstetrics and Gynecology · doi:10.1097/aog.0000000000002870 · Cited by 129
Hedderson, M. M., & Ferrara, A. M. (2008) · Diabetes Care · doi:10.2337/dc08-1193 · Cited by 110
Preconception Blood Pressure and Its Change Into Early Pregnancy
Nobles, C. J., Mendola, P., Mumford, S. L., Silver, R. M., Kim, K., Andriessen, V. C., Connell, M. T., Sjaarda, L. A., Perkins, N. J., & Schisterman, E. F. (2020) · Hypertension · doi:10.1161/hypertensionaha.120.14875 · Cited by 77
In vitro fertilization is associated with the onset and progression of preeclampsia
Gui, J., Ling, Z., Hou, X., Fan, Y., Xie, K., & Shen, R. (2019) · Placenta · doi:10.1016/j.placenta.2019.09.011 · Cited by 70
Yang, Y., He, Y., Li, Q., Wang, Y., Peng, Z., Xu, J., & Ma, X. (2015) · Fertility and Sterility · doi:10.1016/j.fertnstert.2015.03.024 · Cited by 61
Ardissino, M., Slob, E. A. W., Millar, O., Reddy, R. K., Lazzari, L., Patel, K. H. K., Ryan, D., Johnson, M. R., Gill, D., & Ng, F. S. (2022) · Hypertension · doi:10.1161/hypertensionaha.121.18617 · Cited by 52
Nobles, C. J., Mendola, P., Mumford, S. L., Naimi, A. I., Yeung, E. H., Kim, K., Park, H., Wilcox, B. D., Silver, R. M., Perkins, N. J., et al. (2018) · Hypertension · doi:10.1161/hypertensionaha.117.10705 · Cited by 46
Rate of Gestational Diabetes Mellitus and Pregnancy Outcomes in Patients with Chronic Hypertension
Moussa, H. N., Longo, M., Pedroza, C., Haidar, Z. A., Figueroa, H. M., Blackwell, S. C., Sibai, B. M., & Leon, M. G. (2016) · American Journal of Perinatology · doi:10.1055/s-0036-1571318 · Cited by 46
Slade, L. J., Mistry, H. D., Bone, J. N., Wilson, M., Blackman, M., Syeda, N., von Dadelszen, P., & Magee, L. A. (2022) · American Journal of Obstetrics and Gynecology · doi:10.1016/j.ajog.2022.10.004 · Cited by 36
Hong, X., Zhao, J. Y., Huang, K.-P., Dai, Q., Zhang, H., Xuan, Y., Wu, J., Fang, S., Wang, Q., Shen, H., et al. (2019) · American Journal of Obstetrics and Gynecology · doi:10.1016/j.ajog.2019.05.038 · Cited by 29
Jin, M., Liu, X., Liu, X., Wu, Y., Zhang, Y., Zhang, L., Li, Z., Ye, R., & Li, N. (2023) · The Journal of Maternal-Fetal & Neonatal Medicine · doi:10.1080/14767058.2023.2296366 · Cited by 29
Pre-pregnancy blood pressure and pregnancy outcomes: a nationwide population-based study
Jung, Y. M., Oh, G. C., Noh, E., Lee, H., Oh, M., Park, J. S., Jun, J. K., Lee, S. M., & Cho, G. J. (2022) · BMC Pregnancy and Childbirth · doi:10.1186/s12884-022-04573-7 · Cited by 23
Self-citationPreconception Blood Pressure and Adverse Pregnancy Outcomes: A Population-Based Cohort Study
Xiong, W., Han, L., Tang, X., Wang, Q., Chen, W. L., Li, R., Zhang, H., Liu, X., Nie, H., Qin, W., et al. (2024) · Hypertension · doi:10.1161/hypertensionaha.123.22296 · Cited by 15
Xiong, W., Lu, H., Tang, X., Wang, Q., Chen, W., Li, R., Zhang, H., Liu, X., Nie, H., Qin, W., et al. (2023) · Hypertension Research · doi:10.1038/s41440-023-01483-9 · Cited by 8
Cited by
Sorted by citations
Han, H.-J., Lee, H. J., Kim, T. H., Kwak, M., Kim, J. W., Yang, S. J., Kim, J. Y., Choi, Y. J., Kim, N., Jang, J. H., et al. (2026) · Journal of Korean Medical Science · doi:10.3346/jkms.2026.41.e226
“30 This suggests that metabolic benefits of pre-pregnancy muscle-strengthening activity may begin before pregnancy and contribute to GDM prevention through enhanced glycemic control.”
Self-citationBroni, E. K., Aryee, E. K., Lachaud, A. E., Peprah, A., Lewey, J., & Levine, L. (2026) · Pregnancy · doi:10.1002/pmf2.70263
Metadata
- Authors
- Jung, Y. J., Kim, T., & Kim, Y.-H.
- Affiliations
- Yonsei University (KR)
- Sungkyunkwan University (KR)
- Corresponding author
- Kim, Young-Han
- Venue
- Journal of Korean Medical Science
- Publisher
- XMLink
- Published
- 2025
- Volume
- 40
- Issue
- 46
- Pages
- e302-e302
- ISSN
- 1011-8934 (ISSN-L)
- 1598-6357
- PMC
- PMC12669635
- OpenAlex
- W4415604346
- Cited by
- 2
- References
- 21
- Citations by year
- 2026: 2
- FWCI
- 2.34
- Type
- journal article
- Language
- en
- Open access
- gold
- doi.org
- Licence
- Locations
- Journal of Korean Medical Science (publishedVersion, cc-by-nc)
- PubMed (publishedVersion)
- Funders
- Yonsei University College of Medicine (6-2023-0099)
- Topics
- Health Sciences › Medicine › Obstetrics and Gynecology › Pregnancy and preeclampsia studies
- Health Sciences › Medicine › Cardiology and Cardiovascular Medicine › Blood Pressure and Hypertension Studies
- Health Sciences › Medicine › Obstetrics and Gynecology › Gestational Diabetes Research and Management
- Keywords
- elevated blood pressure, stage 1 hypertension, adverse pregnancy outcomes, preeclampsia, gestational diabetes mellitus, placental abruption, postpartum hemorrhage, preterm birth, small for gestational age, large for gestational age, curvilinear relationship
- MeSH terms
- Abruptio Placentae, Adult, Blood Pressure, Female, Postpartum Hemorrhage, Humans, Hypertension, Pre-Eclampsia, Pregnancy, Pregnancy Outcome, Retrospective Studies, Risk Factors, Logistic Models, Odds Ratio, Diabetes, Gestational, Premature Birth, Republic of Korea
About these checks
Registry, retraction, Cites and statistics results are computed, not judged, with one exception: a printed reference that no index lists is read once by a model before it counts as a citation error. Claims are extracted by a model and kept only when their quote appears verbatim in the text; each cited source is then checked, with a model’s help, for whether it says what the claim relies on. Those verdicts can be wrong — read the claim’s quote and the cited source before relying on one.
Statistics and arithmetic are recomputed, not judged.
Confidence bands are shown only for fields calibrated on our annotated test set. None is calibrated yet, so no band is shown.
What counts as a claim ›How we measure confidence ›How we check this ›
Are you an author, or do you see a problem with this page? Request a review
