

Microfluidic-based human prostate-cancer-on-chip
Open accessThe DOI matches its Crossref record; 102 of the 102 references it cites were found in a registry or an index.
Abstract
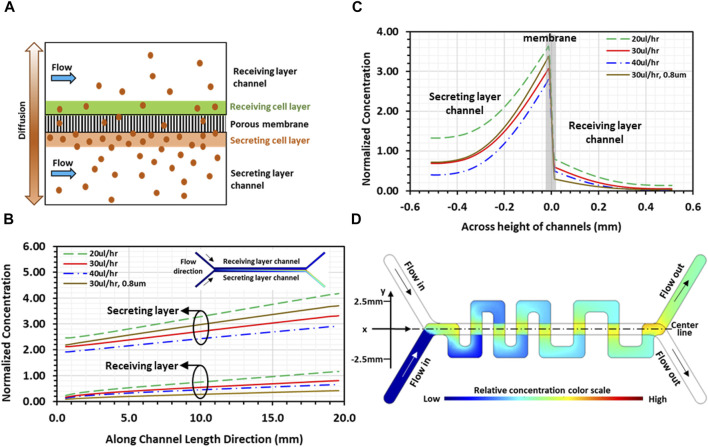
Lack of adequate models significantly hinders advances in prostate cancer treatment, where resistance to androgen-deprivation therapies and bone metastasis remain as major challenges. Current in vitro models fail to faithfully mimic the complex prostate physiology. In vivo animal models can shed light on the oncogenes involved in prostate cancer development and progression; however, the animal prostate gland is fundamentally different from that of human, and the underlying genetic mechanisms are different. To address this problem, we developed the first in vitro microfluidic human Prostate-Cancer-on-Chip (PCoC) model, where human prostate cancer and stromal fibroblast cells were co-cultivated in two channels separated by a porous membrane under culture medium flow. The established microenvironment enables soluble signaling factors secreted by each culture to locally diffuse through the membrane pores affecting the neighboring culture. We particularly explored the conversion of the stromal fibroblasts into cancer-associated fibroblasts (CAFs) due to the interaction between the 2 cell types. Immunofluorescence microscopy revealed that tumor cells induced CAF biomarkers, αSMA and COL1A1, in stromal fibroblasts. The stromal CAF conversion level was observed to increase along the flow direction in response to diffusion agents, consistent with simulations of solute concentration gradients. The tumor cells also downregulated androgen receptor (AR) expression in stromal fibroblasts, while an adequate level of stromal AR expression is maintained in normal prostate homeostasis. We further investigated tumor invasion into the stroma, an early step in the metastatic cascade, in devices featuring a serpentine channel with orthogonal channel segments overlaying a straight channel and separated by an 8 µm-pore membrane. Both tumor cells and stromal CAFs were observed to cross over into their neighboring channel, and the stroma’s role seemed to be proactive in promoting cell invasion. As control, normal epithelial cells neither induced CAF conversion nor promoted cell invasion. In summary, the developed PCoC model allows spatiotemporal analysis of the tumor-stroma dynamic interactions, due to bi-directional signaling and physical contact, recapitulating tissue-level multicellular responses associated with prostate cancer in vivo . Hence, it can serve as an in vitro model to dissect mechanisms in human prostate cancer development and seek advanced therapeutic strategies.
Overview
The claims and statistics of this paper haven’t been checked yet.
Free: it reads the open-access text and checks the first 5 claims that cite a source we can check. Create a free account to check every claim.
Integrity signals
Registry
Cites
Statistics
Figures




Verification
Claims the paper makes
The claims and statistics of this paper haven’t been checked yet.
Free: it reads the open-access text and checks the first 5 claims that cite a source we can check. Create a free account to check every claim.
Claims other papers make about this one
Each is checked against this paper’s own text: does it say what the citing paper says it does?
The source backs part of the claim, not all of it — or backs it for a different population, condition or comparison.
In the citing paper
“To date, MPS models have been developed for the majority of human tissues and organs, and have also been established to study a diverse range of malignancies, including cancer (Baptista et al., 2022; Hachey et al. (2021; 2024); Jiang et al., 2024; Haque et al., 2022; Shen et al., 2023; Flont et al., 2023; Straehla et al., 2022).”
From Microphysiological systems as models for immunologically ‘cold’ tumors (2024) · cites this paper as Jiang et al., 2024
Experimental — accuracy not yet measuredThe source backs part of the claim, not all of it — or backs it for a different population, condition or comparison.
In the citing paper
“Tumor chips have been developed to model a broad variety of cancers, including primary lung cancer, prostate cancer, breast cancer, colorectal cancer, pancreatic cancer, melanoma, liver cancer and glioblastoma (among other cancers), as well as cancer metastasis to the bone, the brain, the liver and the lung (Hachey et al. (2021; 2024); Jiang et al. (2024); Haque et al. (2022); Shen et al. (2023);”
From Microphysiological systems as models for immunologically ‘cold’ tumors (2024) · cites this paper as Jiang et al., 2024
Experimental — accuracy not yet measuredThe cited source says what the claim attributes to it.
In the citing paper
“Interestingly, the prostate tumor cells were able to drive the conversion of normal fibroblasts into CAFs, characterized by strong expression of aSMA and COL1A1, downregulation of AR and elongated morphology (Jiang et al., 2024).”
From Microphysiological systems as models for immunologically ‘cold’ tumors (2024) · cites this paper as Jiang et al., 2024
The cited source says what the claim attributes to it.
In the citing paper
“Prostate tumor cells drive the conversion of normal fibroblasts into CAFs, which promote tumor invasion via the secretion of TGF-β”
From Microphysiological systems as models for immunologically ‘cold’ tumors (2024) · cites this paper as Jiang et al., 2024
The cited source says what the claim attributes to it.
In the citing paper
“In fact, both stromal CAFs and tumor cells migrated into the neighboring channel, suggesting that the stromal compartment plays a tumor invasion-promoting role via the secretion of TGF-β.”
From Microphysiological systems as models for immunologically ‘cold’ tumors (2024) · cites this paper as Jiang et al., 2024
Self-check
Percentages, sums and reported differences re-computed from the paper’s own numbers.
The self-check needs the paper’s full text.
Citations
Cites
Molecular Mechanisms of Stress-Responsive Changes in Collagen and Elastin Networks in Skin
Aziz, J., Shezali, H., Radzi, Z., Yahya, N. A., Abu Kassim, N. H., Czernuszka, J., & Rahman, M. T. (2016) · Skin Pharmacology and Physiology · doi:10.1159/000447017 · Cited by 7,323
Tumors: Wounds That Do Not Heal
Flier, J. S., Underhill, L. H., & Dvorak, H. F. (1986) · New England Journal of Medicine · doi:10.1056/nejm198612253152606 · Cited by 4,391 · cited 1×
“This is consistent with reported observations that stromal fi broblasts undergo a paralleled stromagenesis during tumorigenesis, becoming CAFs and actively participating in and promoting tumor growth and invasion, resembling tissue responses in wound healing (Dvorak, 1986).”
A framework for advancing our understanding of cancer-associated fibroblasts
Sahai, E., Astsaturov, I., Cukierman, E., DeNardo, D. G., Egeblad, M., Evans, R. M., Fearon, D., Greten, F. R., Hingorani, S. R., Hunter, T., et al. (2020) · Nature Reviews Cancer · doi:10.1038/s41568-019-0238-1 · Cited by 3,863
Human organoids: model systems for human biology and medicine
Kim, J., Koo, B.-K., & Knoblich, J. A. (2020) · Nature Reviews Molecular Cell Biology · doi:10.1038/s41580-020-0259-3 · Cited by 2,187
The extracellular matrix modulates the hallmarks of cancer
Pickup, M. W., Mouw, J. K., & Weaver, V. M. (2014) · EMBO reports · doi:10.15252/embr.201439246 · Cited by 1,996
Cancer Invasion and the Microenvironment: Plasticity and Reciprocity
Friedl, P., & Alexander, S. (2011) · Cell · doi:10.1016/j.cell.2011.11.016 · Cited by 1,940
Wnt activity defines colon cancer stem cells and is regulated by the microenvironment
Vermeulen, L., De Sousa E Melo, F., van der Heijden, M., Cameron, K., de Jong, J. H., Borovski, T., Tuynman, J. B., Todaro, M., Merz, C., Rodermond, H., et al. (2010) · Nature Cell Biology · doi:10.1038/ncb2048 · Cited by 1,804
Human organs-on-chips for disease modelling, drug development and personalized medicine
Ingber, D. E. (2022) · Nature Reviews Genetics · doi:10.1038/s41576-022-00466-9 · Cited by 1,589
Carcinoma-associated fibroblasts stimulate tumor progression of initiated human epithelium
Olumi, A., Grossfeld, G., Hayward, S., Carroll, P., Cunha, G., Hein, P., & Tlsty, T. (2000) · Breast Cancer Research · doi:10.1186/bcr138 · Cited by 1,463
Tuxhorn, J. A., Ayala, G. E., Smith, M. J., Smith, V. C., Dang, T. D., & Rowley, D. R. (2002) · PubMed · Cited by 885
Research works printed but not linked: 2
- Rao, 2014, Evaluation of myofibroblasts by expression of alpha smooth muscle actin: a marker in fibrosis, dysplasia and carcinoma, J. Clin. Diagnostic Res., 8, ZC14, 10.7860/jcdr/2014/7820.4231 · DOI
- Rhee, 2001, Permanent phenotypic and genotypic changes of prostate cancer cells cultured in a three-dimensional rotating-wall vessel, Vitro Cell. Dev. Biol. - Animal, 37, 127, 10.1290/1071-2690(2001)037 · doi:10.1290/1071-2690(2001)037
Cited by
Cancer cell membrane-coated nanoparticles: a promising anti-tumor bionic platform
Guo, Q., Wang, S., Xu, R., Tang, Y., & Xia, X. (2024) · RSC Advances · doi:10.1039/d4ra01026d · Cited by 123
Organ-on-a-Chip Applications in Microfluidic Platforms
An, L., Liu, Y., & Liu, Y. (2025) · Micromachines · doi:10.3390/mi16020201 · Cited by 78
Cancer-on-a-chip for precision cancer medicine
Liu, L., Wang, H., Chen, R., Song, Y., Wei, W., Baek, D. S. H., Gillin, M., Kurabayashi, K., & Chen, W. (2025) · Lab on a Chip · doi:10.1039/d4lc01043d · Cited by 52
In vitro and in vivo experimental models for cancer immunotherapy study
Zhang, C., Sui, Y., Liu, S., & Yang, M. J. (2024) · Current Research in Biotechnology · doi:10.1016/j.crbiot.2024.100210 · Cited by 53
Imaging 3D cell cultures with optical microscopy
Hsieh, H.-C., Han, Q., Brenes, D., Bishop, K. W., Wang, R., Wang, Y., Poudel, C., Glaser, A. K., Freedman, B., Vaughan, J. C., et al. (2025) · Nature Methods · doi:10.1038/s41592-025-02647-w · Cited by 49
Metadata
- Authors
- Jiang, L., Khawaja, H., Tahsin, S., Clarkson, T. A., Miranti, C. K., & Zohar, Y.
- Affiliations
- University of Arizona (US)
- Corresponding author
- Jiang, Linan
- Venue
- Frontiers in Bioengineering and Biotechnology
- Publisher
- Frontiers Media SA
- Published
- 2024-01-23
- Volume
- 12
- Pages
- 1302223-1302223
- ISSN
- 2296-4185 (ISSN-L)
- PMC
- PMC10844564
- OpenAlex
- W4391144178
- Cited by
- 26
- References
- 102
- Citations by year
- 2026: 9 · 2025: 11 · 2024: 6
- FWCI
- 2.86
- Type
- journal article
- Language
- en
- Update notices
- corrigendum (2024-11-12)
- Open access
- gold
- doi.org
- Licence
- Locations
- Frontiers in Bioengineering and Biotechnology (publishedVersion, cc-by)
- PubMed Central (publishedVersion, cc-by)
- PubMed (publishedVersion)
- UA Campus Repository (The University of Arizona) (submittedVersion, cc-by)
- DOAJ (DOAJ: Directory of Open Access Journals) (submittedVersion, cc-by-sa)
- Funders
- University of Washington
- National Cancer Institute (T32CA009213, R01CA254200, U54CA143924)
- Topics
- Physical Sciences › Engineering › Biomedical Engineering › 3D Printing in Biomedical Research
- Physical Sciences › Engineering › Biomedical Engineering › Microfluidic and Capillary Electrophoresis Applications
- Health Sciences › Medicine › Oncology › Cancer Cells and Metastasis
- Keywords
- prostate cancer, tumor-stroma interactions, cancer-associated fibroblasts, stromal fibroblasts, androgen receptor, androgen deprivation therapy resistance, bone metastasis, tumor invasion, in vitro disease model
About these checks
Registry, retraction, Cites and statistics results are computed, not judged, with one exception: a printed reference that no index lists is read once by a model before it counts as a citation error. Claims are extracted by a model and kept only when their quote appears verbatim in the text; each cited source is then checked, with a model’s help, for whether it says what the claim relies on. Those verdicts can be wrong — read the claim’s quote and the cited source before relying on one.
Statistics and arithmetic are recomputed, not judged.
Confidence bands are shown only for fields calibrated on our annotated test set. None is calibrated yet, so no band is shown.
What counts as a claim ›How we measure confidence ›How we check this ›
Are you an author, or do you see a problem with this page? Request a review
How to cite
Cite CoChat for the checks on this page, and the paper for its own findings.
- This page
- CoChat. (2026). Citation check: Microfluidic-based human prostate-cancer-on-chip. https://app.cochat.ai/papers/10.3389/fbioe.2024.1302223
- The paper
- Jiang, L., Khawaja, H., Tahsin, S., Clarkson, T. A., Miranti, C. K., & Zohar, Y. (2024). Microfluidic-based human prostate-cancer-on-chip. Frontiers in Bioengineering and Biotechnology. https://doi.org/10.3389/fbioe.2024.1302223
Data sources
Bibliographic data: Semantic Scholar, OpenAlex, Crossref.
Contains information from the Semantic Scholar Academic Graph Datasets, made available under the ODC Attribution License (ODC-BY 1.0).
Semantic Scholar’s data is described in: Kinney, R., et al. (2023). The Semantic Scholar Open Data Platform. arXiv:2301.10140.
