CoChat

Integrating multiple machine learning algorithms for prognostic prediction of gastric cancer based on immune-related lncRNAs

Open access

The DOI matches its Crossref record; the references it cites are not checked yet.

Abstract

Background: Long non-coding RNAs (lncRNAs) play an important role in the immune regulation of gastric cancer (GC). However, the clinical application value of immune-related lncRNAs has not been fully developed. It is of great significance to overcome the challenges of prognostic prediction and classification of gastric cancer patients based on the current study. Methods: In this study, the R package ImmLnc was used to obtain immune-related lncRNAs of The Cancer Genome Atlas Stomach Adenocarcinoma (TCGA-STAD) project, and univariate Cox regression analysis was performed to find prognostic immune-related lncRNAs. A total of 117 combinations based on 10 algorithms were integrated to determine the immune-related lncRNA prognostic model (ILPM). According to the ILPM, the least absolute shrinkage and selection operator (LASSO) regression was employed to find the major lncRNAs and develop the risk model. ssGSEA, CIBERSORT algorithm, the R package maftools, pRRophetic, and clusterProfiler were employed for measuring the proportion of immune cells among risk groups, genomic mutation difference, drug sensitivity analysis, and pathway enrichment score. Results: A total of 321 immune-related lncRNAs were found, and there were 26 prognostic immune-related lncRNAs. According to the ILPM, 18 of 26 lncRNAs were selected and the risk score (RS) developed by the 18-lncRNA signature had good strength in the TCGA training set and Gene Expression Omnibus (GEO) validation datasets. Patients were divided into high- and low-risk groups according to the median RS, and the low-risk group had a better prognosis, tumor immune microenvironment, and tumor signature enrichment score and a higher metabolism, frequency of genomic mutations, proportion of immune cell infiltration, and antitumor drug resistance. Furthermore, 86 differentially expressed genes (DEGs) between high- and low-risk groups were mainly enriched in immune-related pathways. Conclusion: The ILPM developed based on 26 prognostic immune-related lncRNAs can help in predicting the prognosis of patients suffering from gastric cancer. Precision medicine can be effectively carried out by dividing patients into high- and low-risk groups according to the RS.

Overview

The claims and statistics of this paper haven’t been checked yet.

Free: it reads the open-access text and checks the first 5 claims that cite a source we can check. Create a free account to check every claim.

A few free checks a day · papers already verified open instantly · results are public

Integrity signals

Registry

Crossref · 10.3389/fgene.2023.1106724

Cites

Statistics

Figures

FIGURE 1 Workflow of this study.
FIGURE 1 Workflow of this study.CC BY · PubMed Central
FIGURE 2 Calculation of the C-index of 117 integrated machine learning algorithms. (A) ImmLnc identified a total of 321 lncRNAs significantly associated with immune‐related pathways. (B) Univariate Cox regression analysis of OS obtained 26 prognostic immune-related lncRNAs in the TCGA-STAD dataset (n = 296). Data are presented as a hazard ratio (HR) ± 95% confidence interval [CI]. (C) C-index of 117 kinds of prediction models was calculated across two validation datasets.
FIGURE 2 Calculation of the C-index of 117 integrated machine learning algorithms. (A) ImmLnc identified a total of 321 lncRNAs significantly associated with immune‐related pathways. (B) Univariate Cox regression analysis of OS obtained 26 prognostic immune-related lncRNAs in the TCGA-STAD dataset (n = 296). Data are presented as a hazard ratio (HR) ± 95% confidence interval [CI]. (C) C-index of 117 kinds of prediction models was calculated across two validation datasets.CC BY · PubMed Central
FIGURE 3 Lasso result diagram of TCGA training set and prognostic efficacy of the model across all datasets. (A) Multivariable Cox regression analysis (direction = forward) of OS in the TCGA-STAD dataset (n = 296), with no culling of variables. Data are presented as a hazard ratio (HR) ± 95% confidence interval [CI]. (B) Changing track of the Lasso regression independent variable; the abscissa represented the logarithm of the independent variable lambda, and the ordinate represented the coefficient of the independent variable. (C) Confidence interval under each lambda of Lasso. (D–I) Kaplan–Meier curve of OS according to the ILPM in the TCGA-STAD (n = 296, log-rank test: p <0.001): (D) GSE57303 (n = 68, log-rank test: p = = 0.029); (F) GSE62254 (n = 298, log-rank test: p <0.001); and (H) corresponding ROC curves for predicting OS at 1, 3, and 5 years in TCGA-STAD (E), GSE57303 (G), and GSE62254 (I).
FIGURE 3 Lasso result diagram of TCGA training set and prognostic efficacy of the model across all datasets. (A) Multivariable Cox regression analysis (direction = forward) of OS in the TCGA-STAD dataset (n = 296), with no culling of variables. Data are presented as a hazard ratio (HR) ± 95% confidence interval [CI]. (B) Changing track of the Lasso regression independent variable; the abscissa represented the logarithm of the independent variable lambda, and the ordinate represented the coefficient of the independent variable. (C) Confidence interval under each lambda of Lasso. (D–I) Kaplan–Meier curve of OS according to the ILPM in the TCGA-STAD (n = 296, log-rank test: p <0.001): (D) GSE57303 (n = 68, log-rank test: p = = 0.029); (F) GSE62254 (n = 298, log-rank test: p <0.001); and (H) corresponding ROC curves for predicting OS at 1, 3, and 5 years in TCGA-STAD (E), GSE57303 (G), and GSE62254 (I).CC BY · PubMed Central
FIGURE 4 Assessment of the ILPM. (A) C-index of the ILPM in all datasets. (B–D) Performance of the ILPM compared with other clinical variables in predicting prognosis in TCGA-STAD (n = 296) (B), GSE57303 (n = 68) (C), and GSE62254 (n = 298) (D). (E) AUC value of the ILPM and five published signatures in TCGA-STAD. (F–H) Multivariate Cox regression analysis of RS and other clinical variables in TCGA-STAD (F), GSE57303 (G), and GSE62254 (H). Data are presented as the hazard ratio (HR) ± 95% confidence interval [CI].
FIGURE 4 Assessment of the ILPM. (A) C-index of the ILPM in all datasets. (B–D) Performance of the ILPM compared with other clinical variables in predicting prognosis in TCGA-STAD (n = 296) (B), GSE57303 (n = 68) (C), and GSE62254 (n = 298) (D). (E) AUC value of the ILPM and five published signatures in TCGA-STAD. (F–H) Multivariate Cox regression analysis of RS and other clinical variables in TCGA-STAD (F), GSE57303 (G), and GSE62254 (H). Data are presented as the hazard ratio (HR) ± 95% confidence interval [CI].CC BY · PubMed Central
FIGURE 5 C-index and AUC assessment of RS and clinical variables. (A–C) C-index analysis of RS and clinical variables in TCGA-STAD (n = 296) (A), GSE57303 (n = 68) (B), and GSE62254 (n = 298) (C). (D) Time-dependent ROC analysis for predicting OS in all datasets.
FIGURE 5 C-index and AUC assessment of RS and clinical variables. (A–C) C-index analysis of RS and clinical variables in TCGA-STAD (n = 296) (A), GSE57303 (n = 68) (B), and GSE62254 (n = 298) (C). (D) Time-dependent ROC analysis for predicting OS in all datasets.CC BY · PubMed Central
FIGURE 6 Molecular and genomic features between high- and low-risk groups in TCGA-STAD. (A–C) Box plot of metabolism signatures (A), TME signatures (B), and tumor signatures (C) in high- and low-risk groups. *p < 0.05; **p < 0.01; ***p < 0.001; ****p < 0.0001. (D–E) SNV waterfall of top 20 (mutation frequency) genes in the high-risk group (n = 147) (D) and low-risk group (n = 147) (E).
FIGURE 6 Molecular and genomic features between high- and low-risk groups in TCGA-STAD. (A–C) Box plot of metabolism signatures (A), TME signatures (B), and tumor signatures (C) in high- and low-risk groups. *p < 0.05; **p < 0.01; ***p < 0.001; ****p < 0.0001. (D–E) SNV waterfall of top 20 (mutation frequency) genes in the high-risk group (n = 147) (D) and low-risk group (n = 147) (E).CC BY · PubMed Central
FIGURE 7 Proportion of infiltration of 28 immune cells was evaluated based on ssGSEA. (A) Box plot of the proportion of immune infiltrating cells in high- and low-risk groups. Green represents the high-risk group, and red represents the low-risk group. (B) RS and 28 immune cell correlation heat map. The cross marks represent a non-significant correlation, where blue is positive and red is negative. (C) 18 lncRNAs and 28 immune cell correlation heat map, where pink represents positive and green represents negative. *p < 0.05; **p < 0.01; ***p < 0.001; ****p < 0.0001.
FIGURE 7 Proportion of infiltration of 28 immune cells was evaluated based on ssGSEA. (A) Box plot of the proportion of immune infiltrating cells in high- and low-risk groups. Green represents the high-risk group, and red represents the low-risk group. (B) RS and 28 immune cell correlation heat map. The cross marks represent a non-significant correlation, where blue is positive and red is negative. (C) 18 lncRNAs and 28 immune cell correlation heat map, where pink represents positive and green represents negative. *p < 0.05; **p < 0.01; ***p < 0.001; ****p < 0.0001.CC BY · PubMed Central
FIGURE 8 Variations in drug sensitivity between model groups. (A–R) IC50 box diagram of 18 drugs with the significant difference in drug sensitivity in the high- and low-risk groups, respectively, in which yellow represents the high-risk group and blue represents the low-risk group.
FIGURE 8 Variations in drug sensitivity between model groups. (A–R) IC50 box diagram of 18 drugs with the significant difference in drug sensitivity in the high- and low-risk groups, respectively, in which yellow represents the high-risk group and blue represents the low-risk group.CC BY · PubMed Central
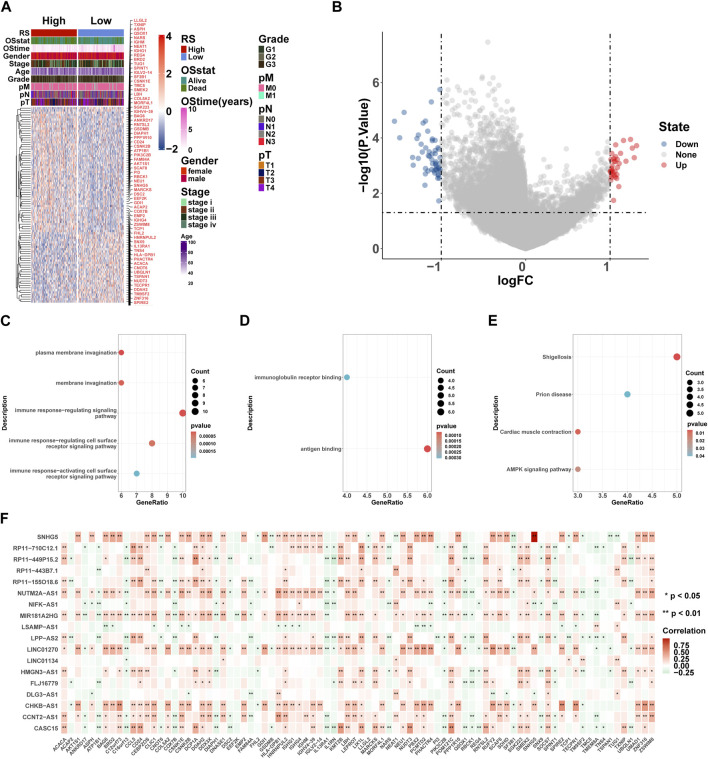
FIGURE 9 GO and KEGG enrichment analyses of DEGs. (A) Heatmaps of DEGs based on RS. (B) Volcano plot of DEGs based on RS. (C–E) Gene ontology (GO) and Kyoto Encyclopedia of Genes and Genomes (KEGG) pathway enrichment analysis of DEGs, including biological process (BP) (C), molecular function (MF) (D), and KEGG pathway (E). Count: number of genes related to the enriched GO or KEGG pathway. The color of the bar denotes the p-value. (F) 18 lncRNA and 86 DEG correlation heat map, where red represents positive and green represents negative. *p < 0.05; **p < 0.01; ***p < 0.001; ****p < 0.0001.
FIGURE 9 GO and KEGG enrichment analyses of DEGs. (A) Heatmaps of DEGs based on RS. (B) Volcano plot of DEGs based on RS. (C–E) Gene ontology (GO) and Kyoto Encyclopedia of Genes and Genomes (KEGG) pathway enrichment analysis of DEGs, including biological process (BP) (C), molecular function (MF) (D), and KEGG pathway (E). Count: number of genes related to the enriched GO or KEGG pathway. The color of the bar denotes the p-value. (F) 18 lncRNA and 86 DEG correlation heat map, where red represents positive and green represents negative. *p < 0.05; **p < 0.01; ***p < 0.001; ****p < 0.0001.CC BY · PubMed Central
FIGURE 10 Variations in GO, KEGG, and Hallmark pathway enrichment scores between model groups. GO (A-D) and KEGG (E-H) enriched the top four pathways with the most significant results based on GSEA. (I) Box plot of GSVA of 50 Hallmark pathways. *p < 0.05; **p < 0.01; ***p < 0.001; ****p < 0.0001.
FIGURE 10 Variations in GO, KEGG, and Hallmark pathway enrichment scores between model groups. GO (A-D) and KEGG (E-H) enriched the top four pathways with the most significant results based on GSEA. (I) Box plot of GSVA of 50 Hallmark pathways. *p < 0.05; **p < 0.01; ***p < 0.001; ****p < 0.0001.CC BY · PubMed Central

Verification

Claims the paper makes

The claims and statistics of this paper haven’t been checked yet.

Free: it reads the open-access text and checks the first 5 claims that cite a source we can check. Create a free account to check every claim.

A few free checks a day · papers already verified open instantly · results are public

Self-check

Percentages, sums and reported differences re-computed from the paper’s own numbers.

The self-check needs the paper’s full text.

Citations

The citation lists haven’t been fetched yet

References 49 · Cited by 5

Research works printed but not linked: 1

  1. Ponatinib, 2012, Clinical and research information on drug-induced liver injury

Metadata

Authors
Li, G., Huo, D., Guo, N., Li, Y., Ma, H., Liu, L., Xie, H., Zhang, D., Qu, B., & Chen, X.
Affiliations
  • Harbin Medical University (CN)
  • Harbin Normal University (CN)
Corresponding author
  • Qu, Bo
  • Chen, Xiujie
Venue
Frontiers in Genetics
Published
2023-04-04
Volume
14
Pages
1106724-1106724
ISSN
1664-8021 (ISSN-L)
OpenAlex
W4362557688
Cited by
5
References
49
Citations by year
2026: 1 · 2024: 3 · 2023: 1
FWCI
0.63
Type
journal article
Language
en
Open access
Locations
  • Frontiers in Genetics (publishedVersion, cc-by)
  • PubMed Central (publishedVersion, cc-by)
  • PubMed (publishedVersion)
  • DOAJ (DOAJ: Directory of Open Access Journals) (submittedVersion, cc-by-sa)
Funders
National Natural Science Foundation of China (61671191, 62072144)
Topics
  • Life Sciences › Biochemistry, Genetics and Molecular Biology › Cancer Research › Cancer-related molecular mechanisms research
  • Life Sciences › Biochemistry, Genetics and Molecular Biology › Cancer Research › Ferroptosis and cancer prognosis
  • Health Sciences › Medicine › Oncology › Cancer Immunotherapy and Biomarkers
Keywords
gastric cancer, long non-coding RNA, immune-related lncRNAs, prognostic signature, risk score, tumor immune microenvironment, immune cell infiltration, drug sensitivity, genomic mutations, differentially expressed genes, precision medicine

About these checks

Registry, retraction, Cites and statistics results are computed, not judged, with one exception: a printed reference that no index lists is read once by a model before it counts as a citation error. Claims are extracted by a model and kept only when their quote appears verbatim in the text; each cited source is then checked, with a model’s help, for whether it says what the claim relies on. Those verdicts can be wrong — read the claim’s quote and the cited source before relying on one.

Statistics and arithmetic are recomputed, not judged.

Confidence bands are shown only for fields calibrated on our annotated test set. None is calibrated yet, so no band is shown.

What counts as a claim ›How we measure confidence ›How we check this ›

Are you an author, or do you see a problem with this page? Request a review

How to cite

Cite CoChat for the checks on this page, and the paper for its own findings.

This page
CoChat. (2026). Citation check: Integrating multiple machine learning algorithms for prognostic prediction of gastric cancer based on immune-related lncRNAs. https://app.cochat.ai/papers/10.3389/fgene.2023.1106724
The paper
Li, G., Huo, D., Guo, N., Li, Y., Ma, H., Liu, L., Xie, H., Zhang, D., Qu, B., & Chen, X. (2023). Integrating multiple machine learning algorithms for prognostic prediction of gastric cancer based on immune-related lncRNAs. Frontiers in Genetics. https://doi.org/10.3389/fgene.2023.1106724

Data sources

Bibliographic data: Semantic Scholar, OpenAlex, Crossref.

Contains information from the Semantic Scholar Academic Graph Datasets, made available under the ODC Attribution License (ODC-BY 1.0).

Semantic Scholar’s data is described in: Kinney, R., et al. (2023). The Semantic Scholar Open Data Platform. arXiv:2301.10140.