

The DOI matches its Crossref record; 59 of the 59 references it cites were found in a registry or an index.
Single-cell RNA datasets and bulk RNA datasets analysis demonstrated C1Q+ tumor-associated macrophage as a major and antitumor immune cell population in osteosarcoma
Open accessAbstract
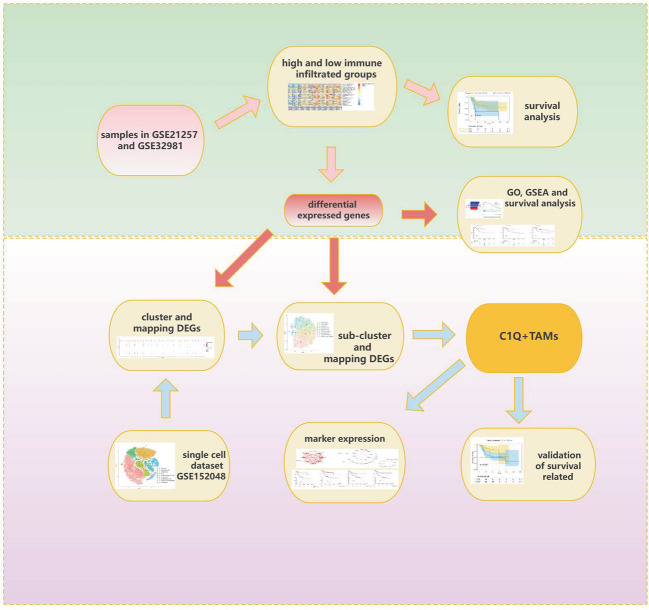
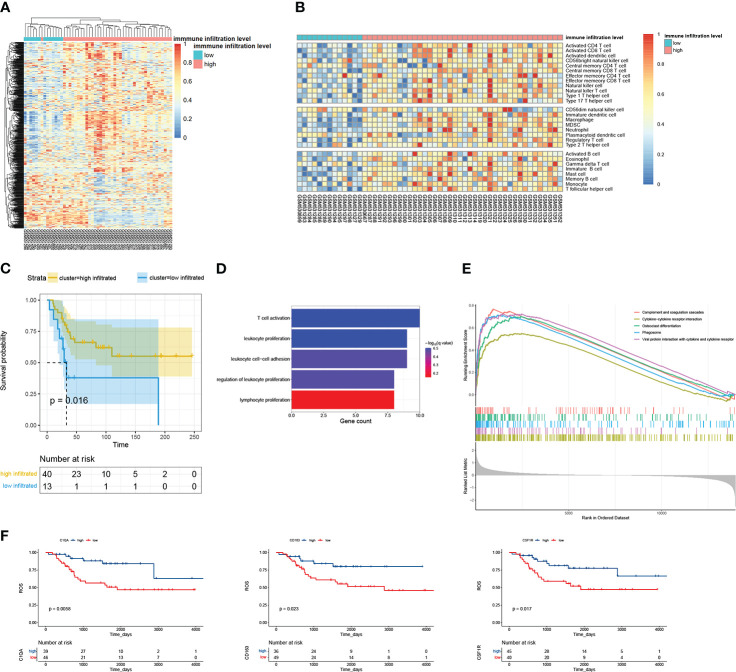
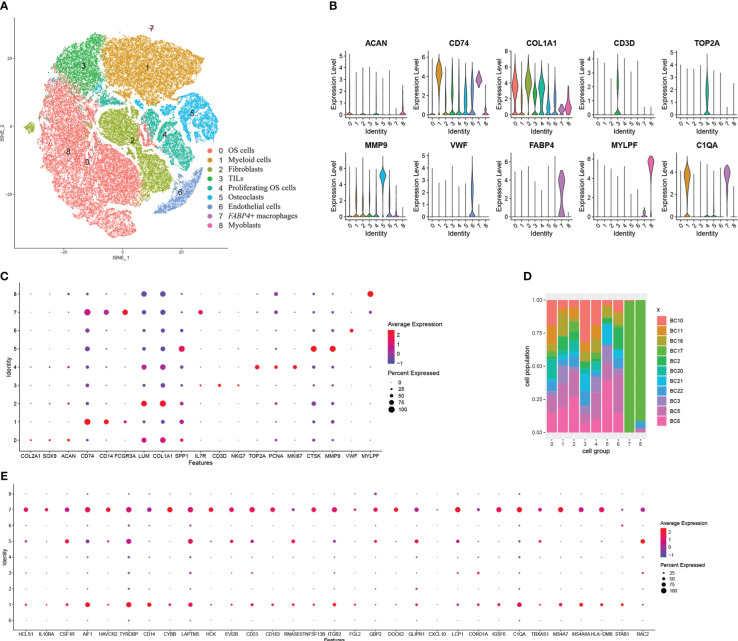
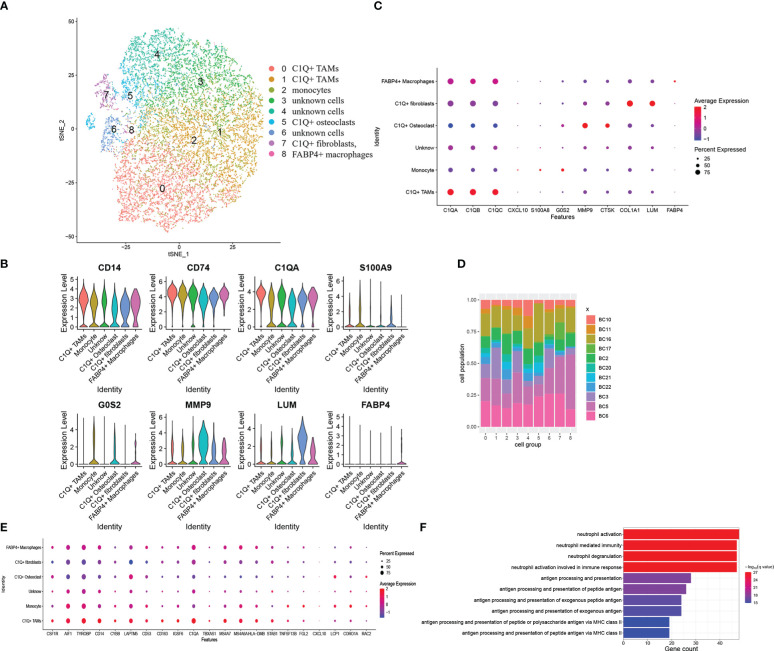
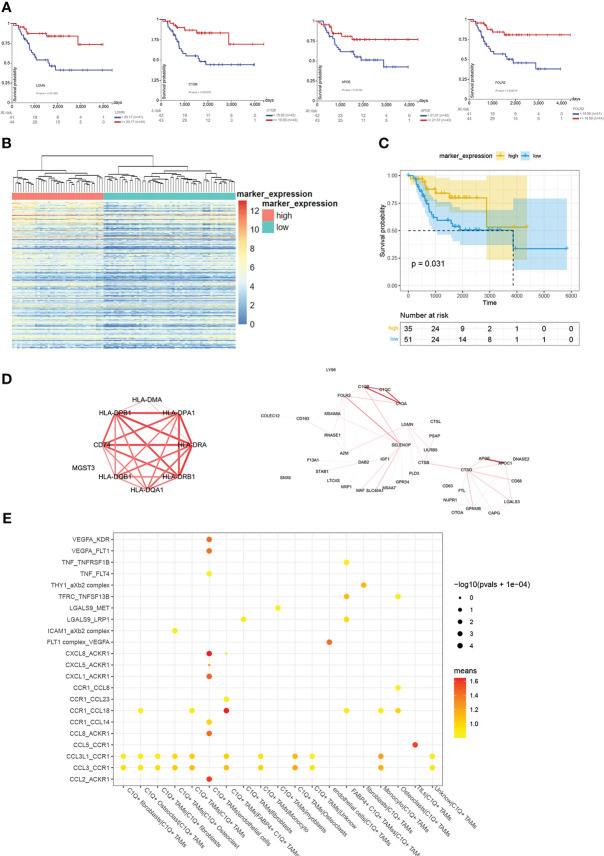
Background: Osteosarcoma is the most frequent primary bone tumor with a poor prognosis. Immune infiltration proved to have a strong impact on prognosis. We analyzed single-cell datasets and bulk datasets to confirm the main immune cell populations and their properties in osteosarcoma. Methods: The examples in bulk datasets GSE21257 and GSE32981 from the Gene Expression Omnibus database were divided into two immune infiltration level groups, and 34 differentially expressed genes were spotted. Then, we located these genes among nine major cell clusters and their subclusters identified from 99,668 individual cells in single-cell dataset GSE152048 including 11 osteosarcoma patients. Especially, the markers of all kinds of myeloid cells identified in single-cell dataset GSE152048 were set to gene ontology enrichment. We clustered the osteosarcoma samples in the TARGET-OS from the Therapeutically Applicable Research to Generate Effective Treatments dataset into two groups by complete component 1q positive macrophage markers and compared their survival. Results: Compared with the low-immune infiltrated group, the high-immune infiltrated group showed a better prognosis. Almost all the 34 differentially expressed genes expressed higher or exclusively among myeloid cells. A group of complete component 1q-positive macrophages was identified from the myeloid cells. In the bulk dataset TARGET-OS, these markers and the infiltration of complete component 1q-positive macrophages related to longer survival. Conclusions: Complete component 1q-positive tumor-associated macrophages were the major immune cell population in osteosarcoma, which contributed to a better prognosis.
Overview
The claims and statistics of this paper haven’t been checked yet.
Run the check — free, no account needed. It reads the open-access text and checks the sources it cites.
Integrity signals
Registry
Cites
Statistics
Figures
Verification
Claims the paper makes
The claims and statistics of this paper haven’t been checked yet.
Run the check — free, no account needed. It reads the open-access text and checks the sources it cites.
Claims other papers make about this one
Each is checked against this paper’s own text: does it say what the citing paper says it does?
The cited source says what the claim attributes to it.
In the citing paper
“In addition, a analysis of single-cell RNA datasets and bulk RNA datasets demonstrate that complete component 1q (C1Q)-positive TAMs have anti-tumor effect and predict a better prognosis for patients with osteosarcoma [74].”
From Advances on immunotherapy for osteosarcoma (2024) · cites this paper as [74]
Self-check
Percentages, sums and reported differences re-computed from the paper’s own numbers.
The self-check needs the paper’s full text.
Citations
Cites
Moderated estimation of fold change and dispersion for RNA-seq data with DESeq2
Love, M. I., Huber, W., & Anders, S. (2014) · Genome Biology · doi:10.1186/s13059-014-0550-8 · Cited by 95,106
Subramanian, A., Tamayo, P., Mootha, V. K., Mukherjee, S., Ebert, B. L., Gillette, M. A., Paulovich, A., Pomeroy, S. L., Golub, T. R., Lander, E. S., et al. (2005) · Proceedings of the National Academy of Sciences · doi:10.1073/pnas.0506580102 · Cited by 53,625
Robinson, M. D., McCarthy, D. J., & Smyth, G. K. (2010) · Bioinformatics · doi:10.1093/bioinformatics/btp616 · Cited by 41,364
limma powers differential expression analyses for RNA-sequencing and microarray studies
Ritchie, M. E., Phipson, B., Wu, D., Hu, Y., Law, C. W., Shi, W., & Smyth, G. K. (2015) · Nucleic Acids Research · doi:10.1093/nar/gkv007 · Cited by 40,458
Charoentong, P., Finotello, F., Angelova, M., Mayer, C., Efremova, M., Rieder, D., Hackl, H., & Trajanoski, Z. (2017) · Cell Reports · doi:10.1016/j.celrep.2016.12.019 · Cited by 5,041
McGinnis, C. S., Murrow, L. M., & Gartner, Z. J. (2019) · Cell Systems · doi:10.1016/j.cels.2019.03.003 · Cited by 4,521
Transforming Growth Factor-β Signaling in Immunity and Cancer
Batlle, E., & Massagué, J. (2019) · Immunity · doi:10.1016/j.immuni.2019.03.024 · Cited by 2,366
Single-cell reconstruction of the early maternal–fetal interface in humans
Vento-Tormo, R., Efremova, M., Botting, R. A., Turco, M. Y., Vento-Tormo, M., Meyer, K. B., Park, J.-E., Stephenson, E., Polański, K., Goncalves, A., et al. (2018) · Nature · doi:10.1038/s41586-018-0698-6 · Cited by 2,358
Diversity, Mechanisms, and Significance of Macrophage Plasticity
Locati, M., Curtale, G., & Mantovani, A. (2020) · Annual Review of Pathology: Mechanisms of Disease · doi:10.1146/annurev-pathmechdis-012418-012718 · Cited by 2,199
Osteosarcoma: Current Treatment and a Collaborative Pathway to Success
Isakoff, M. S., Bielack, S., Meltzer, P. S., & Gorlick, R. G. (2015) · Journal of Clinical Oncology · doi:10.1200/jco.2014.59.4895 · Cited by 1,578
Cited by
Sorted by citations
Advances on immunotherapy for osteosarcoma
Yu, S., & Yao, X. (2024) · Molecular Cancer · doi:10.1186/s12943-024-02105-9 · Cited by 270
Qian, Y., Yin, Y., Zheng, X., Liu, Z., & Wang, X. (2024) · Biomarker Research · doi:10.1186/s40364-023-00549-7 · Cited by 120
Self-citationCui, H., Tang, C.-J., Gao, Y., Li, Z., Zhang, J., & Li, Y.-D. (2023) · Frontiers in Immunology · doi:10.3389/fimmu.2023.1289223 · Cited by 41
Rebuilding the microenvironment of primary tumors in humans: a focus on stroma
Mun, S., Lee, H. J., & Kim, P. (2024) · Experimental & Molecular Medicine · doi:10.1038/s12276-024-01191-5 · Cited by 31
Targeting metastasis in paediatric bone sarcomas
Bull, E. C., Singh, A., Harden, A. M., Soanes, K., Habash, H., Toracchio, L., Carrabotta, M., Schreck, C., Shah, K. M., Riestra, P. V., et al. (2025) · Molecular Cancer · doi:10.1186/s12943-025-02365-z · Cited by 31
Metadata
- Authors
- Tu, J., Wang, D., Zheng, X., & Liu, B.
- Affiliations
- First Hospital of Jilin University (CN)
- Corresponding author
- Liu, Bin
- Venue
- Frontiers in Immunology
- Publisher
- Frontiers Media SA
- Published
- 2023-02-06
- Volume
- 14
- Pages
- 911368-911368
- ISSN
- 1664-3224 (ISSN-L)
- PMC
- PMC9939514
- OpenAlex
- W4319321889
- Cited by
- 27
- References
- 59
- Citations by year
- 2026: 6 · 2025: 8 · 2024: 8 · 2023: 5
- FWCI
- 2.95
- Type
- journal article
- Language
- en
- Open access
- gold
- doi.org
- Licence
- Locations
- Frontiers in Immunology (publishedVersion, cc-by)
- PubMed Central (publishedVersion, cc-by)
- PubMed (publishedVersion)
- DOAJ (DOAJ: Directory of Open Access Journals) (submittedVersion, cc-by-sa)
- Topics
- Life Sciences › Immunology and Microbiology › Immunology › Immune cells in cancer
- Health Sciences › Medicine › Oncology › Sarcoma Diagnosis and Treatment
- Health Sciences › Medicine › Oncology › Cancer Immunotherapy and Biomarkers
- Keywords
- osteosarcoma, tumor-associated macrophages, tumor immune microenvironment, immune cell infiltration, myeloid cells, prognostic factors, survival, differentially expressed genes, single-cell RNA sequencing, bulk RNA-seq
- MeSH terms
- Tumor-Associated Macrophages, Bone Neoplasms, Humans, RNA, Osteosarcoma, Complement C1q
About these checks
Registry, retraction, Cites and statistics results are computed, not judged, with one exception: a printed reference that no index lists is read once by a model before it counts as a citation error. Claims are extracted by a model and kept only when their quote appears verbatim in the text; each cited source is then checked, with a model’s help, for whether it says what the claim relies on. Those verdicts can be wrong — read the claim’s quote and the cited source before relying on one.
Statistics and arithmetic are recomputed, not judged.
Confidence bands are shown only for fields calibrated on our annotated test set. None is calibrated yet, so no band is shown.
What counts as a claim ›How we measure confidence ›How we check this ›
Are you an author, or do you see a problem with this page? Request a review
How to cite
Cite CoChat for the checks on this page, and the paper for its own findings.
- This page
- CoChat. (2026). Citation check: Single-cell RNA datasets and bulk RNA datasets analysis demonstrated C1Q+ tumor-associated macrophage as a major and antitumor immune cell population in osteosarcoma. https://app.cochat.ai/papers/10.3389/fimmu.2023.911368
- The paper
- Tu, J., Wang, D., Zheng, X., & Liu, B. (2023). Single-cell RNA datasets and bulk RNA datasets analysis demonstrated C1Q+ tumor-associated macrophage as a major and antitumor immune cell population in osteosarcoma. Frontiers in Immunology. https://doi.org/10.3389/fimmu.2023.911368
